Click a season to open this player’s full game log, splits and advanced stats for that year; click a team to open its page. A dash means no NBA games were recorded.
03 / EVERY CATEGORY THE PROVIDER REPORTS
Full statistical breakdown
Regular season 2026-27
Defensive
Metric
Total
NBA rank
Blocks
1
Tied-292nd
Defensive Rebounds
23
Tied-227th
Steals
23
Tied-10th
Defensive Rebound Rate
0.0
—
Defensive Rebounds Per Game
1.8
219th
Blocks Per Game
0.1
Tied-255th
Steals Per Game
1.8
14th
Defensive Rebounds Per 48
3.4
5,448th
Blocks Per 48
0.1
7,008th
Steals Per 48
3.4
240th
General
Metric
Total
NBA rank
Disqualifications
0
Tied-22nd
Flagrant Fouls
0
Tied-24th
Fouls
30
Tied-114th
Player Efficiency Rating
12.99
182nd
Rebound Rate
0.0
—
Ejections
0
Tied-7th
Technical Fouls
0
Tied-104th
Rebounds
31
—
Value Over Replacement Player
10.6
—
Minutes
323
Tied-2nd
Minutes Per Game
24.8
—
Rating
18.2
Tied-66th
Plus-Minus
+29
Tied-1st
Rebounds Per Game
2.4
227th
Fouls Per Game
2.3
Tied-117th
Flagrant Fouls Per Game
0.0
Tied-21st
Technical Fouls Per Game
0.0
Tied-84th
Ejections Per Game
0.0
Tied-6th
Disqualifications Per Game
0.0
Tied-21st
Assist To Turnover Ratio
2.9
—
Steal To Foul Ratio
0.8
—
Block To Foul Ratio
0.0
—
Team Rebounds Per Game
0.0
—
Rebounds
31
—
Total Technical Fouls
0
—
Assist To Turnover Ratio
0.0
—
Steal To Turnover Ratio
1.3
—
Rebounds Per 48 Minutes
4.6
—
Fouls Per 48 Minutes
4.5
2,736th
Flagrant Fouls Per 48 Minutes
0.0
576th
Technical Fouls Per 48 Minutes
0.0
2,496th
Ejections Per 48 Minutes
0.0
168th
Disqualifications Per 48 Minutes
0.0
528th
R/40
3.8
—
Games Played
13
13th
Games Started
0
Tied-258th
Double Double
1
Tied-68th
Triple Double
0
Tied-13th
Offensive
Metric
Total
NBA rank
Assists
52
Tied-56th
Effective Field Goal Percentage
51.3
—
Field Goals
43/112
—
Field Goals Attempted
112
Tied-119th
Field Goals Made
43
Tied-157th
Field Goal Percentage
38.4
—
Free Throws
6/10
—
Free Throw Percentage
60.0
Tied-252nd
Free Throws Attempted
10
Tied-260th
Free Throws Made
6
Tied-276th
Offensive Rebounds
8
Tied-218th
Points
121
Tied-156th
Turnovers
18
Tied-119th
3-Point Field Goal Percentage
34.5
137th
3-Point Field Goals Attempted
84
43rd
3-Point Field Goals Made
29
Tied-45th
True Shooting Percentage
52.0
—
Total Turnovers
18
—
Assist Ratio
27.9
—
Points in the Paint
0
Tied-1st
Offensive Rebound Rate
0.0
—
Turnover Ratio
9.7
—
Brick Index
0.00
—
Usage Rate
0.0
—
Average Field Goals Made
3.3
—
Average Field Goals Attempted
8.6
332nd
Average 3-Point Field Goals Made
2.2
Tied-49th
Average 3-Point Field Goals Attempted
6.5
41st
Average Free Throws Made
0.5
—
Average Free Throws Attempted
0.8
Tied-235th
Points Per Game
9.3
155th
Offensive Rebounds Per Game
0.6
Tied-208th
Assists Per Game
4.0
Tied-57th
Turnovers Per Game
1.4
127th
Offensive Rebound Percentage
0.1
—
Estimated Possessions
126.0
—
Estimated Possessions Per Game
9.7
—
Points Per Estimated Possession
1.0
—
Team Turnovers Per Game
0.0
—
Total Turnovers Per Game
1.4
—
3-Point Field Goal Percentage
34.5
114th
2-Point Field Goals Made
14.0
Tied-112th
2-Point Field Goals Attempted
28.0
Tied-162nd
2-Point Field Goals Made per Game
1.1
—
2-Point Field Goals Attempted per Game
2.2
—
2-Point Field Goal Percentage
50.0
—
Shooting Efficiency
0.51
—
Scoring Efficiency
1.080
—
Fieldgoals Made Per 48
6.4
3,768th
Fieldgoals Attempted Per 48
16.6
2,856th
3-Point Fieldgoals Made Per 48
4.3
1,080th
3-Point Fieldgoals Attempted Per 48
12.5
Tied-1,032nd
Freethrows Made Per 48
0.9
6,624th
Freethrows Attempted Per 48
1.5
6,240th
Points Scored Per 48
18.0
3,744th
Offensive Rebounds Per 48
1.2
5,232nd
Assists Per 48
7.7
1,344th
Turnovers
2.7
2,856th
P/40
15.0
—
A/40
6.4
—
04 / EFFICIENCY, SHOOTING PROFILE, PER-36
Advanced metrics
True shooting %51.9%
Effective FG %51.2%
2-point FG %52.4%
3-point attempt rate75.6%
Free throw rate9.3%
Points per shot attempt1.08
% of points from 3s71.0%
Assist-to-turnover2.86
Points per 36 min13.5
Rebounds per 36 min3.5
Assists per 36 min5.8
Steals per 36 min2.61
Blocks per 36 min0.15
Turnovers per 36 min2.03
Stocks (STL + BLK) per game1.90
Pts + Reb + Ast per game15.7
Efficiency (EFF) per game10.6
Game Score per game (Hollinger)7.8
Minutes per game24.8
Calculated by BallersCulture from the supplied 2026-27 box-score totals using standard formulas (hover a tile to see the formula). Tracking-based metrics such as BPM, VORP, on/off and RAPTOR are not available from this data source.
05 / 13 GAMES IN 2026-27
Game log: Regular season
Date
Opp
Result
MIN
FG
FG%
3PT
3P%
FT
FT%
REB
AST
BLK
STL
PF
TO
PTS
Nov 17
@ DEN
W 117-105
26
4-7
57.1
2-5
40.0
0-0
0.0
3
3
0
1
2
0
10
Nov 16
vs LAL
L 131-123
28
8-14
57.1
5-10
50.0
5-6
83.3
4
4
0
0
1
1
26
Nov 13
vs CHA
W 101-96
27
5-13
38.5
3-9
33.3
0-0
0.0
2
1
0
2
1
2
13
Nov 11
vs LAC
W 133-110
22
4-9
44.4
4-9
44.4
0-0
0.0
2
8
0
1
2
1
12
Nov 10
vs SA
L 122-96
24
2-6
33.3
2-4
50.0
0-0
0.0
2
3
0
0
5
1
6
Nov 8
vs HOU
W 102-99
20
3-6
50.0
1-3
33.3
0-0
0.0
3
4
0
0
0
0
7
Nov 6
vs ORL
W 117-104
24
2-9
22.2
2-5
40.0
0-0
0.0
2
2
0
3
4
1
6
Nov 5
vs POR
L 132-119
23
1-5
20.0
0-4
0.0
0-0
0.0
3
2
0
2
1
2
2
Nov 3
@ GS
L 116-113
24
1-8
12.5
1-6
16.7
0-0
0.0
1
2
0
2
3
0
3
Oct 31
vs DEN
L 127-120
33
6-11
54.5
4-8
50.0
0-0
0.0
3
10
1
4
2
2
16
Oct 27
@ OKC
L 125-114
23
3-9
33.3
3-8
37.5
0-0
0.0
1
2
0
2
3
2
9
Oct 25
vs GS
W 131-122
28
4-7
57.1
2-5
40.0
1-3
33.3
4
9
0
2
3
2
11
Oct 22
@ POR
L 124-83
21
0-8
0.0
0-8
0.0
0-1
0.0
1
2
0
4
3
4
0
06 / 2026-27 HOME / AWAY, RESULTS, MONTHS AND OPPONENTS
Splits
split
Split
GP
MIN
FG
FG%
3PT
3P%
FT
FT%
OR
DR
REB
AST
BLK
STL
PF
TO
PTS
All Splits
13
24.8
3.3-8.6
38.4
2.2-6.5
34.5
0.5-0.8
60.0
0.6
1.8
2.4
4.0
0.1
1.8
2.3
1.4
9.3
Home
9
25.2
3.9-8.9
43.8
2.6-6.3
40.4
0.7-1.0
66.7
0.6
2.2
2.8
4.8
0.1
1.6
2.1
1.3
11.0
Road
4
23.8
2.0-8.0
25.0
1.5-6.8
22.2
0.0-0.3
0.0
0.8
0.8
1.5
2.3
0.0
2.3
2.8
1.5
5.5
vs. Division
4
25.5
4.3-9.5
44.7
3.0-7.5
40.0
1.5-2.3
66.7
0.5
2.3
2.8
5.8
0.0
1.3
2.3
1.0
13.0
vs. Conference
11
24.8
3.3-8.2
40.0
2.2-6.4
34.3
0.5-0.9
60.0
0.7
1.7
2.5
4.5
0.1
1.6
2.3
1.4
9.3
3+ Days Rest
2
27.5
3.0-9.5
31.6
2.0-8.0
25.0
0.0-0.5
0.0
1.0
1.0
2.0
6.0
0.5
4.0
2.5
3.0
8.0
Month
Split
GP
MIN
FG
FG%
3PT
3P%
FT
FT%
OR
DR
REB
AST
BLK
STL
PF
TO
PTS
October
4
26.5
3.3-8.8
37.1
2.3-7.3
31.0
0.3-1.0
25.0
0.8
1.5
2.3
5.8
0.3
3.0
2.8
2.5
9.0
November
9
24.1
3.3-8.6
39.0
2.2-6.1
36.4
0.6-0.7
83.3
0.6
1.9
2.4
3.2
0.0
1.2
2.1
0.9
9.4
Pre All-Star
13
24.8
3.3-8.6
38.4
2.2-6.5
34.5
0.5-0.8
60.0
0.6
1.8
2.4
4.0
0.1
1.8
2.3
1.4
9.3
Result
Split
GP
MIN
FG
FG%
3PT
3P%
FT
FT%
OR
DR
REB
AST
BLK
STL
PF
TO
PTS
Wins
6
24.5
3.7-8.5
43.1
2.3-6.0
38.9
0.2-0.5
33.3
0.3
2.3
2.7
4.5
0.0
1.5
2.0
1.0
9.8
Losses
7
25.1
3.0-8.7
34.4
2.1-6.9
31.3
0.7-1.0
71.4
0.9
1.3
2.1
3.6
0.1
2.0
2.6
1.7
8.9
Day
Split
GP
MIN
FG
FG%
3PT
3P%
FT
FT%
OR
DR
REB
AST
BLK
STL
PF
TO
PTS
Monday
4
24.5
2.5-7.5
33.3
2.0-5.8
34.8
0.0-0.0
0.0
1.0
0.8
1.8
2.5
0.0
1.3
3.3
0.8
7.0
Tuesday
1
22.0
4.0-9.0
44.4
4.0-9.0
44.4
0.0-0.0
0.0
0.0
2.0
2.0
8.0
0.0
1.0
2.0
1.0
12.0
Wednesday
2
22.0
0.5-6.5
7.7
0.0-6.0
0.0
0.0-0.5
0.0
1.0
1.0
2.0
2.0
0.0
3.0
2.0
3.0
1.0
Thursday
2
25.0
3.5-11.0
31.8
2.5-7.0
35.7
0.0-0.0
0.0
0.0
2.0
2.0
1.5
0.0
2.5
2.5
1.5
9.5
Friday
1
33.0
6.0-11.0
54.5
4.0-8.0
50.0
0.0-0.0
0.0
1.0
2.0
3.0
10.0
1.0
4.0
2.0
2.0
16.0
Saturday
2
24.0
3.5-6.5
53.8
1.5-4.0
37.5
0.5-1.5
33.3
0.5
3.0
3.5
6.5
0.0
1.0
1.5
1.0
9.0
Sunday
1
28.0
8.0-14.0
57.1
5.0-10.0
50.0
5.0-6.0
83.3
0.0
4.0
4.0
4.0
0.0
0.0
1.0
1.0
26.0
Opponent
Split
GP
MIN
FG
FG%
3PT
3P%
FT
FT%
OR
DR
REB
AST
BLK
STL
PF
TO
PTS
Charlotte Hornets
1
27.0
5.0-13.0
38.5
3.0-9.0
33.3
0.0-0.0
0.0
0.0
2.0
2.0
1.0
0.0
2.0
1.0
2.0
13.0
Denver Nuggets
2
30.0
5.0-9.0
55.6
3.0-6.5
46.2
0.0-0.0
0.0
1.0
2.0
3.0
6.5
0.5
2.5
2.0
1.0
13.0
Golden State Warriors
2
26.0
2.5-7.5
33.3
1.5-5.5
27.3
0.5-1.5
33.3
1.0
1.5
2.5
5.5
0.0
2.0
3.0
1.0
7.0
Houston Rockets
1
20.0
3.0-6.0
50.0
1.0-3.0
33.3
0.0-0.0
0.0
0.0
3.0
3.0
4.0
0.0
0.0
0.0
0.0
7.0
Los Angeles Clippers
1
22.0
4.0-9.0
44.4
4.0-9.0
44.4
0.0-0.0
0.0
0.0
2.0
2.0
8.0
0.0
1.0
2.0
1.0
12.0
Los Angeles Lakers
1
28.0
8.0-14.0
57.1
5.0-10.0
50.0
5.0-6.0
83.3
0.0
4.0
4.0
4.0
0.0
0.0
1.0
1.0
26.0
Orlando Magic
1
24.0
2.0-9.0
22.2
2.0-5.0
40.0
0.0-0.0
0.0
0.0
2.0
2.0
2.0
0.0
3.0
4.0
1.0
6.0
Portland Trail Blazers
2
22.0
0.5-6.5
7.7
0.0-6.0
0.0
0.0-0.5
0.0
1.0
1.0
2.0
2.0
0.0
3.0
2.0
3.0
1.0
San Antonio Spurs
1
24.0
2.0-6.0
33.3
2.0-4.0
50.0
0.0-0.0
0.0
2.0
0.0
2.0
3.0
0.0
0.0
5.0
1.0
6.0
Oklahoma City Thunder
1
23.0
3.0-9.0
33.3
3.0-8.0
37.5
0.0-0.0
0.0
0.0
1.0
1.0
2.0
0.0
2.0
3.0
2.0
9.0
07 / SEASON-BY-SEASON HISTORY
Career statistics
Regular Season Averages
Season
Team
GP
GS
MIN
FG
FG%
3PT
3P%
FT
FT%
OR
DR
REB
AST
BLK
STL
PF
TO
PTS
2023-24
Denver Nuggets
24
0
9.4
1.3-2.9
46.4
0.6-1.6
39.5
0.3-0.5
66.7
0.0
0.8
0.9
1.1
0.0
0.5
1.0
0.6
3.6
2024-25
Phoenix Suns
33
9
14.0
2.1-4.8
43.0
1.2-2.7
43.3
0.6-0.7
86.4
0.7
1.7
2.4
2.4
0.2
0.6
0.9
0.5
5.9
2025-26
Phoenix Suns
80
58
28.5
4.4-10.5
41.8
2.9-7.2
40.1
1.0-1.1
87.4
1.1
3.0
4.1
4.6
0.2
1.2
1.6
1.6
12.7
2026-27
Phoenix Suns
13
0
24.8
3.3-8.6
38.4
2.2-6.5
34.5
0.5-0.8
60.0
0.6
1.8
2.4
4.0
0.1
1.8
2.3
1.4
9.3
Career
—
150
67
21.9
3.3-7.9
41.9
2.1-5.3
39.9
0.7-0.9
83.2
0.8
2.2
3.0
3.5
0.1
1.0
1.4
1.2
9.4
Regular Season Totals
Season
Team
FG
FG%
3PT
3P%
FT
FT%
OR
DR
REB
AST
BLK
STL
PF
TO
PTS
2023-24
Denver Nuggets
32-69
46.4
15-38
39.5
8-12
66.7
1
20
21
27
0
13
24
14
87
2024-25
Phoenix Suns
68-158
43.0
39-90
43.3
19-22
86.4
22
56
78
78
5
21
30
17
194
2025-26
Phoenix Suns
352-842
41.8
232-578
40.1
76-87
87.4
89
238
327
371
16
99
130
125
1012
2026-27
Phoenix Suns
43-112
38.4
29-84
34.5
6-10
60.0
8
23
31
52
1
23
30
18
121
Career
—
495-1181
41.9
315-790
39.9
109-131
83.2
120
337
457
528
22
156
214
174
1414
Regular Season Misc Totals
Season
Team
DD2
TD3
DQ
EJECT
TECH
FLAG
AST/TO
STL/TO
SC-EFF
SH-EFF
2023-24
Denver Nuggets
0
0
0
0
0
0
1.9
0.9
1.261
0.57
2024-25
Phoenix Suns
1
0
0
0
0
0
4.6
1.2
1.228
0.55
2025-26
Phoenix Suns
3
0
0
0
0
0
3.0
0.8
1.202
0.56
2026-27
Phoenix Suns
1
0
0
0
0
0
2.9
1.3
1.080
0.51
Career
—
5
0
0
0
0
0
3.0
0.9
1.197
0.55
Scoring, rebounding and assist trend
08 / SHOT CHART AND ZONE SHOOTING
Shot profile
Shot-location data is not connected. Add a BALLDONTLIE GOAT-tier NBA API key in NBA Players → Settings to enable shot charts and zone shooting.
LATEST UPDATEGillespie dropped 26 points (8-14 FG, 5-10 3Pt, 5-6 FT), four rebounds and four assists in 28 minutes during Sunday's 131-123 loss to the Lakers.
Gillespie set a new season high in scoring. He was highly efficient from everywhere on the floor, as Gillespie tallied season highs in made (eight) and attempted (14) field goals, made (five) and attempted (six) free throws and made (five) and attempted (10) three-pointers. He's been very productive over his last three outings, averaging 17.0 points, 2.7 rebounds, 4.3 assists, 1.0 steals and 4.0 triples per game during that span.




 Amir CoffeyG #2
 CJ HuntleyF #21
 Devin BookerG #15
 Dillon BrooksF #3
 Drew TimmeF #2
 Duop ReathC #26
 Haywood HighsmithF #19
 Isaiah LiversF #18
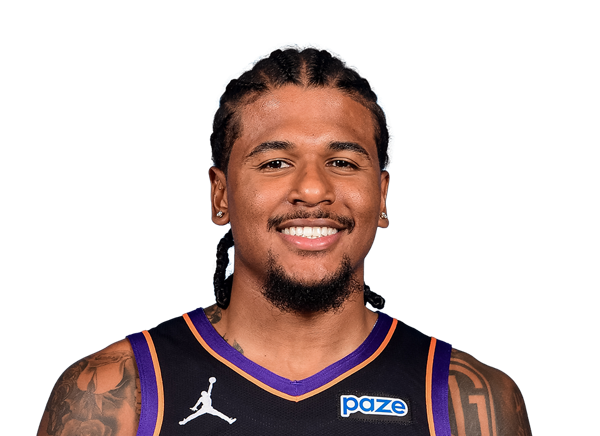 Jalen GreenG #4
 Jamaree BouyeaG #17
 Jordan GoodwinG #23
 Kennedy ChandlerG #2
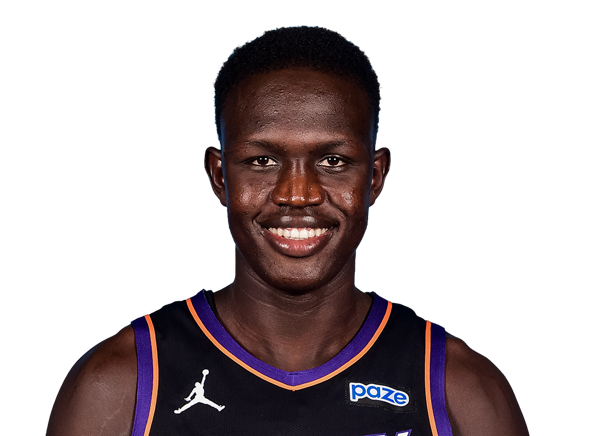 Khaman MaluachC #10
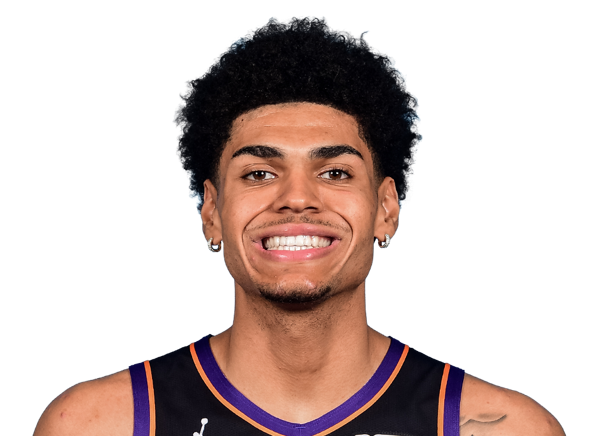 Koa PeatF #18
 Koby BreaG #14
 Luke KennardG #8
 Mark WilliamsC #25
 Miles BridgesF #22
 Oso IghodaroF #11
 Pat SpencerG #61
 Phillip WheelerF
 Rasheer FlemingF #20
 Ryan DunnF