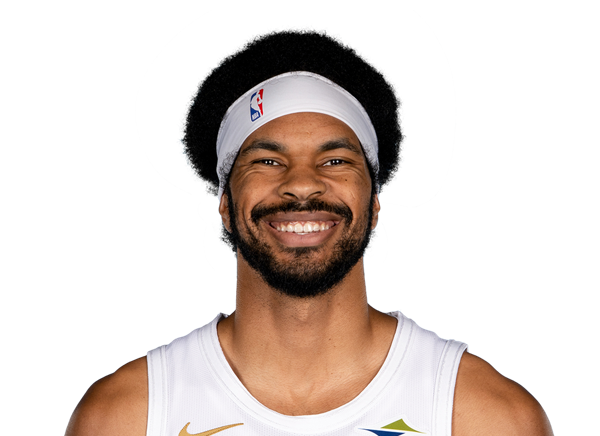
Click a season to open this player’s full game log, splits and advanced stats for that year; click a team to open its page. A dash means no NBA games were recorded.
03 / EVERY CATEGORY THE PROVIDER REPORTS
Full statistical breakdown
Regular season 2023-24
Defensive
Metric
Total
NBA rank
Blocks
81
20th
Defensive Rebounds
568
11th
Steals
53
Tied-129th
Defensive Rebound Rate
0.0
—
Defensive Rebounds Per Game
7.4
12th
Blocks Per Game
1.1
24th
Steals Per Game
0.7
135th
Defensive Rebounds Per 48
11.2
528th
Blocks Per 48
1.6
960th
Steals Per 48
1.0
Tied-6,192nd
Defensive Real Plus-Minus
-0.31
—
General
Metric
Total
NBA rank
Disqualifications
1
Tied-39th
Flagrant Fouls
0
Tied-76th
Fouls
147
Tied-101st
Player Efficiency Rating
21.82
19th
Rebound Rate
0.0
—
Ejections
0
Tied-61st
Technical Fouls
1
Tied-182nd
Rebounds
811
—
Value Over Replacement Player
409.0
—
Wins Above Replacement Player
0.2
—
Real Plus-Minus
-0.05
—
Minutes
2442
1st
Minutes Per Game
31.7
—
Rating
35.5
Tied-2nd
Plus-Minus
+201
Tied-1st
Rebounds Per Game
10.5
11th
Fouls Per Game
1.9
Tied-120th
Flagrant Fouls Per Game
0.0
Tied-60th
Technical Fouls Per Game
0.0
Tied-158th
Ejections Per Game
0.0
Tied-39th
Disqualifications Per Game
0.0
Tied-68th
Assist To Turnover Ratio
1.7
—
Steal To Foul Ratio
0.4
—
Block To Foul Ratio
0.6
—
Team Rebounds Per Game
0.0
—
Rebounds
811
—
Total Technical Fouls
1
—
Assist To Turnover Ratio
0.0
—
Steal To Turnover Ratio
0.4
—
Rebounds Per 48 Minutes
15.9
—
Fouls Per 48 Minutes
2.9
Tied-4,848th
Flagrant Fouls Per 48 Minutes
0.0
Tied-3,648th
Technical Fouls Per 48 Minutes
0.0
Tied-8,736th
Ejections Per 48 Minutes
0.0
Tied-2,928th
Disqualifications Per 48 Minutes
0.0
Tied-1,872nd
R/40
13.3
—
Games Played
77
77th
Games Started
77
Tied-18th
Double Double
42
Tied-11th
Triple Double
0
Tied-38th
Offensive
Metric
Total
NBA rank
Assists
210
107th
Effective Field Goal Percentage
63.4
—
Field Goals
519/819
—
Field Goals Attempted
819
88th
Field Goals Made
519
40th
Field Goal Percentage
63.4
4th
Free Throws
233/314
—
Free Throw Percentage
74.2
165th
Free Throws Attempted
314
37th
Free Throws Made
233
46th
Offensive Rebounds
243
6th
Points
1271
59th
Turnovers
121
77th
3-Point Field Goal Percentage
0.0
Tied-228th
3-Point Field Goals Attempted
6
Tied-467th
3-Point Field Goals Made
0
Tied-498th
True Shooting Percentage
66.4
—
Total Turnovers
121
—
Assist Ratio
16.3
—
Points in the Paint
0
Tied-1st
Offensive Rebound Rate
0.0
—
Turnover Ratio
9.4
—
Brick Index
0.00
—
Usage Rate
0.0
—
Average Field Goals Made
6.7
61st
Average Field Goals Attempted
10.6
455th
Average 3-Point Field Goals Made
0.0
—
Average 3-Point Field Goals Attempted
0.1
224th
Average Free Throws Made
3.0
54th
Average Free Throws Attempted
4.1
40th
Points Per Game
16.5
63rd
Offensive Rebounds Per Game
3.2
6th
Assists Per Game
2.7
103rd
Turnovers Per Game
1.6
78th
Offensive Rebound Percentage
0.8
—
Estimated Possessions
822.6
—
Estimated Possessions Per Game
10.7
—
Points Per Estimated Possession
1.5
—
Team Turnovers Per Game
0.0
—
Total Turnovers Per Game
1.6
—
3-Point Field Goal Percentage
0.0
—
2-Point Field Goals Made
519.0
538th
2-Point Field Goals Attempted
813.0
555th
2-Point Field Goals Made per Game
6.7
—
2-Point Field Goals Attempted per Game
10.6
—
2-Point Field Goal Percentage
63.8
4th
Shooting Efficiency
0.63
—
Scoring Efficiency
1.552
—
Fieldgoals Made Per 48
10.2
1,920th
Fieldgoals Attempted Per 48
16.1
4,224th
3-Point Fieldgoals Made Per 48
0.0
Tied-23,904th
3-Point Fieldgoals Attempted Per 48
0.1
Tied-22,416th
Freethrows Made Per 48
4.6
2,208th
Freethrows Attempted Per 48
6.2
1,776th
Points Scored Per 48
25.0
2,832nd
Offensive Rebounds Per 48
4.8
288th
Assists Per 48
4.1
5,136th
Turnovers
2.4
3,696th
P/40
20.8
—
A/40
3.4
—
Offensive Real Plus-Minus
0.27
—
Playoffs 2023-24
Defensive
Metric
Total
NBA rank
Blocks
4
Tied-58th
Defensive Rebounds
40
44th
Steals
5
Tied-70th
Defensive Rebound Rate
0.0
—
Defensive Rebounds Per Game
10.0
—
Blocks Per Game
1.0
—
Steals Per Game
1.3
—
Defensive Rebounds Per 48
15.1
Tied-1,056th
Blocks Per 48
1.5
1,392nd
Steals Per 48
1.9
1,680th
General
Metric
Total
NBA rank
Disqualifications
0
Tied-9th
Flagrant Fouls
0
Tied-10th
Fouls
8
Tied-120th
Player Efficiency Rating
0.00
—
Rebound Rate
0.0
—
Ejections
0
Tied-5th
Technical Fouls
0
Tied-47th
Rebounds
55
—
Value Over Replacement Player
-20.1
—
Minutes
127
Tied-2nd
Minutes Per Game
31.8
—
Rating
37.7
Tied-98th
Plus-Minus
-8
Tied-1st
Rebounds Per Game
13.8
2nd
Fouls Per Game
2.0
—
Flagrant Fouls Per Game
0.0
—
Technical Fouls Per Game
0.0
—
Ejections Per Game
0.0
—
Disqualifications Per Game
0.0
—
Assist To Turnover Ratio
1.0
—
Steal To Foul Ratio
0.6
—
Block To Foul Ratio
0.5
—
Team Rebounds Per Game
0.0
—
Rebounds
55
—
Total Technical Fouls
0
—
Assist To Turnover Ratio
0.0
—
Steal To Turnover Ratio
1.0
—
Rebounds Per 48 Minutes
20.8
—
Fouls Per 48 Minutes
3.0
2,880th
Flagrant Fouls Per 48 Minutes
0.0
240th
Technical Fouls Per 48 Minutes
0.0
1,128th
Ejections Per 48 Minutes
0.0
120th
Disqualifications Per 48 Minutes
0.0
216th
R/40
17.3
—
Games Played
4
4th
Games Started
4
Tied-68th
Double Double
2
Tied-22nd
Triple Double
0
Tied-6th
Offensive
Metric
Total
NBA rank
Assists
5
Tied-119th
Effective Field Goal Percentage
67.6
—
Field Goals
25/37
—
Field Goals Attempted
37
107th
Field Goals Made
25
Tied-78th
Field Goal Percentage
67.6
1st
Free Throws
18/26
—
Free Throw Percentage
69.2
—
Free Throws Attempted
26
Tied-40th
Free Throws Made
18
49th
Offensive Rebounds
15
Tied-36th
Points
68
77th
Turnovers
5
Tied-93rd
3-Point Field Goal Percentage
0.0
—
3-Point Field Goals Attempted
0
Tied-182nd
3-Point Field Goals Made
0
Tied-154th
True Shooting Percentage
70.2
—
Total Turnovers
5
—
Assist Ratio
8.6
—
Points in the Paint
0
Tied-1st
Offensive Rebound Rate
0.0
—
Turnover Ratio
8.6
—
Brick Index
0.00
—
Usage Rate
0.0
—
Average Field Goals Made
6.3
33rd
Average Field Goals Attempted
9.3
—
Average 3-Point Field Goals Made
0.0
—
Average 3-Point Field Goals Attempted
0.0
—
Average Free Throws Made
4.5
Tied-15th
Average Free Throws Attempted
6.5
—
Points Per Game
17.0
—
Offensive Rebounds Per Game
3.8
—
Assists Per Game
1.3
—
Turnovers Per Game
1.3
—
Offensive Rebound Percentage
1.3
—
Estimated Possessions
37.4
—
Estimated Possessions Per Game
9.4
—
Points Per Estimated Possession
1.8
—
Team Turnovers Per Game
0.0
—
Total Turnovers Per Game
1.3
—
3-Point Field Goal Percentage
0.0
—
2-Point Field Goals Made
25.0
76th
2-Point Field Goals Attempted
37.0
289th
2-Point Field Goals Made per Game
6.3
—
2-Point Field Goals Attempted per Game
9.3
—
2-Point Field Goal Percentage
67.6
1st
Shooting Efficiency
0.68
—
Scoring Efficiency
1.838
—
Fieldgoals Made Per 48
9.4
1,872nd
Fieldgoals Attempted Per 48
14.0
Tied-2,568th
3-Point Fieldgoals Made Per 48
0.0
3,696th
3-Point Fieldgoals Attempted Per 48
0.0
4,368th
Freethrows Made Per 48
6.8
Tied-1,176th
Freethrows Attempted Per 48
9.8
960th
Points Scored Per 48
25.7
Tied-1,848th
Offensive Rebounds Per 48
5.7
864th
Assists Per 48
1.9
2,856th
Turnovers
1.9
2,232nd
P/40
21.4
—
A/40
1.6
—
04 / EFFICIENCY, SHOOTING PROFILE, PER-36
Advanced metrics
True shooting %66.5%
Effective FG %63.2%
2-point FG %63.8%
3-point attempt rate0.9%
Free throw rate38.7%
Points per shot attempt1.56
% of points from 3s0.0%
Assist-to-turnover1.69
Points per 36 min18.7
Rebounds per 36 min11.9
Assists per 36 min3.1
Steals per 36 min0.79
Blocks per 36 min1.25
Turnovers per 36 min1.82
Stocks (STL + BLK) per game1.80
Pts + Reb + Ast per game29.7
Efficiency (EFF) per game24.9
Game Score per game (Hollinger)16.8
Minutes per game31.7
Calculated by BallersCulture from the supplied 2023-24 box-score totals using standard formulas (hover a tile to see the formula). Tracking-based metrics such as BPM, VORP, on/off and RAPTOR are not available from this data source.
05 / 77 GAMES IN 2023-24
Game log: Regular season
Date
Opp
Result
MIN
FG
FG%
3PT
3P%
FT
FT%
REB
AST
BLK
STL
PF
TO
PTS
Apr 15
vs CHA
L 120-110
23
7-7
100.0
0-0
0.0
0-0
0.0
7
2
0
2
1
3
14
Apr 13
vs IND
W 129-120
38
13-14
92.9
0-0
0.0
3-8
37.5
13
3
0
0
2
2
29
Apr 11
vs MEM
W 110-98
34
7-13
53.8
0-1
0.0
2-2
100.0
10
5
3
0
1
1
16
Apr 8
@ LAC
L 120-118
35
6-12
50.0
0-0
0.0
5-5
100.0
10
1
1
1
1
1
17
Apr 7
@ LAL
L 116-97
34
6-12
50.0
0-0
0.0
0-0
0.0
12
3
0
1
2
1
12
Apr 4
@ PHX
L 122-101
37
9-15
60.0
0-0
0.0
2-2
100.0
5
4
0
0
2
0
20
Apr 3
@ UTAH
W 129-113
33
8-11
72.7
0-0
0.0
5-6
83.3
12
5
0
1
0
0
21
Apr 1
@ DEN
L 130-101
27
9-15
60.0
0-0
0.0
1-2
50.0
4
1
1
0
2
2
19
Mar 30
vs PHI
W 117-114
26
6-9
66.7
0-0
0.0
1-1
100.0
11
2
0
0
1
2
13
Mar 28
@ CHA
L 118-111
34
11-14
78.6
0-0
0.0
2-4
50.0
8
3
0
1
2
1
24
Mar 26
vs CHA
W 115-92
33
7-9
77.8
0-0
0.0
3-3
100.0
13
4
0
1
1
0
17
Mar 25
@ MIA
L 121-84
22
3-7
42.9
0-0
0.0
3-4
75.0
4
3
0
0
1
2
9
Mar 23
@ MIN
L 104-91
33
5-10
50.0
0-0
0.0
5-6
83.3
13
5
1
0
1
0
15
Mar 21
vs MIA
L 107-104
39
10-13
76.9
0-0
0.0
5-6
83.3
20
3
0
0
2
2
25
Mar 19
@ IND
W 108-103
34
8-12
66.7
0-0
0.0
7-8
87.5
9
1
1
1
0
1
23
Mar 17
@ HOU
L 117-103
26
4-7
57.1
0-0
0.0
2-2
100.0
7
0
3
0
2
3
10
Mar 14
@ NO
W 116-95
32
8-13
61.5
0-0
0.0
1-2
50.0
10
1
2
0
1
1
17
Mar 12
vs PHX
L 117-111
38
5-7
71.4
0-0
0.0
5-6
83.3
10
2
0
1
3
1
15
Mar 11
vs BKN
L 120-101
29
6-11
54.5
0-0
0.0
3-4
75.0
9
3
2
0
2
1
15
Mar 9
vs MIN
W 113-104 OT
46
9-19
47.4
0-0
0.0
15-21
71.4
18
3
2
2
1
1
33
Mar 7
@ ATL
L 112-101
37
7-11
63.6
0-0
0.0
4-5
80.0
19
3
1
0
0
3
18
Mar 6
vs BOS
W 105-104
35
9-16
56.3
0-0
0.0
3-3
100.0
12
2
1
0
0
0
21
Mar 4
vs NY
L 107-98
36
8-13
61.5
0-0
0.0
2-4
50.0
7
6
1
1
1
1
18
Mar 2
@ DET
W 110-100
35
1-7
14.3
0-0
0.0
7-8
87.5
15
2
1
1
1
2
9
Feb 29
@ CHI
L 132-123 2OT
34
5-12
41.7
0-0
0.0
1-2
50.0
4
4
2
1
3
0
11
Feb 28
vs DAL
W 121-119
33
7-9
77.8
0-0
0.0
5-6
83.3
9
0
1
0
0
1
19
Feb 26
@ WSH
W 114-105
37
11-18
61.1
0-0
0.0
0-2
0.0
12
5
1
0
3
1
22
Feb 24
@ PHI
L 104-97
36
10-16
62.5
0-0
0.0
4-8
50.0
9
0
1
0
3
1
24
Feb 23
vs ORL
L 116-109
34
6-10
60.0
0-0
0.0
6-8
75.0
10
1
0
2
1
2
18
Feb 15
vs CHI
W 108-105
35
6-9
66.7
0-1
0.0
1-2
50.0
10
3
1
1
1
0
13
Feb 13
vs PHI
L 123-121
37
9-13
69.2
0-0
0.0
3-4
75.0
10
3
1
0
2
3
21
Feb 11
@ TOR
W 119-95
30
9-12
75.0
0-1
0.0
0-2
0.0
15
2
1
0
2
1
18
Feb 9
@ BKN
W 118-95
30
3-6
50.0
0-1
0.0
8-8
100.0
10
2
2
0
2
2
14
Feb 8
@ WSH
W 114-106
37
5-12
41.7
0-1
0.0
2-4
50.0
9
2
2
0
1
3
12
Feb 6
vs SAC
W 136-110
30
8-10
80.0
0-0
0.0
3-4
75.0
7
3
2
0
1
0
19
Feb 4
@ SA
W 117-101
31
12-18
66.7
0-0
0.0
2-2
100.0
16
0
0
0
1
1
26
Feb 2
@ MEM
W 108-101
21
6-13
46.2
0-0
0.0
2-4
50.0
9
2
3
0
1
2
14
Feb 1
vs DET
W 128-121
30
7-10
70.0
0-0
0.0
0-0
0.0
11
0
1
1
2
1
14
Jan 30
vs LAC
W 118-108
36
6-9
66.7
0-0
0.0
8-11
72.7
17
3
1
1
3
3
20
Jan 27
@ MIL
W 112-100
36
9-20
45.0
0-0
0.0
6-7
85.7
14
1
2
1
4
4
24
Jan 25
@ MIL
L 126-116
32
10-19
52.6
0-0
0.0
1-2
50.0
12
5
0
0
0
1
21
Jan 23
@ ORL
W 126-99
27
6-8
75.0
0-0
0.0
2-4
50.0
11
4
2
0
2
2
14
Jan 21
@ ATL
W 116-95
33
6-8
75.0
0-0
0.0
2-2
100.0
11
2
3
3
2
4
14
Jan 18
vs MIL
W 135-95
26
9-15
60.0
0-0
0.0
3-3
100.0
13
3
1
0
0
1
21
Jan 16
vs CHI
W 109-91
34
4-5
80.0
0-0
0.0
2-2
100.0
14
3
1
2
1
2
10
Jan 12
vs BKN
W 111-102
38
3-5
60.0
0-0
0.0
6-6
100.0
12
4
4
2
5
1
12
Jan 8
vs SA
W 117-115
31
11-19
57.9
0-0
0.0
7-7
100.0
16
2
1
1
3
1
29
Jan 6
vs WSH
W 114-90
29
5-7
71.4
0-0
0.0
2-2
100.0
12
3
1
2
2
4
12
Jan 4
vs WSH
W 140-101
29
7-10
70.0
0-0
0.0
3-4
75.0
19
7
2
0
0
1
17
Jan 2
@ TOR
L 124-121
34
5-11
45.5
0-0
0.0
6-8
75.0
11
4
0
1
4
0
16
Dec 30
vs MIL
L 119-111
40
15-17
88.2
0-0
0.0
0-0
0.0
12
6
2
0
2
0
30
Dec 28
@ DAL
W 113-110
35
9-17
52.9
0-0
0.0
6-6
100.0
23
6
0
2
1
4
24
Dec 24
@ CHI
W 109-95
35
6-9
66.7
0-1
0.0
7-10
70.0
17
7
1
1
0
0
19
Dec 22
vs NO
L 123-104
27
7-8
87.5
0-0
0.0
0-0
0.0
7
3
0
1
0
1
14
Dec 21
vs UTAH
W 124-116
30
8-13
61.5
0-0
0.0
1-2
50.0
8
3
0
2
1
2
17
Dec 19
vs HOU
W 135-130 OT
29
3-7
42.9
0-0
0.0
4-7
57.1
6
2
2
0
5
1
10
Dec 17
vs ATL
W 127-119
35
12-14
85.7
0-0
0.0
1-1
100.0
14
1
1
2
1
4
25
Dec 15
@ BOS
L 116-107
39
4-7
57.1
0-0
0.0
0-0
0.0
10
3
0
0
1
3
8
Dec 13
@ BOS
L 120-113
37
6-9
66.7
0-0
0.0
2-5
40.0
5
5
2
3
4
2
14
Dec 12
@ ORL
L 104-94
15
2-3
66.7
0-0
0.0
0-0
0.0
7
1
0
1
6
1
4
Dec 9
@ MIA
W 111-99
25
3-9
33.3
0-0
0.0
0-2
0.0
9
1
0
1
2
0
6
Dec 7
vs ORL
W 121-111
19
4-5
80.0
0-0
0.0
0-0
0.0
11
2
0
1
5
4
8
Dec 3
@ DET
W 110-101
34
8-9
88.9
0-0
0.0
3-5
60.0
11
3
0
1
2
2
19
Dec 1
vs POR
L 103-95
38
6-9
66.7
0-0
0.0
0-0
0.0
10
2
2
0
3
1
12
Nov 29
vs ATL
W 128-105
30
5-6
83.3
0-0
0.0
1-1
100.0
8
2
0
0
4
0
11
Nov 27
vs TOR
W 105-102
27
9-10
90.0
0-0
0.0
0-0
0.0
4
3
2
0
4
2
18
Nov 26
vs LAL
L 121-115
37
9-12
75.0
0-0
0.0
3-4
75.0
14
3
2
3
3
2
21
Nov 23
vs MIA
L 129-96
23
1-2
50.0
0-0
0.0
2-2
100.0
4
2
0
0
2
3
4
Nov 22
@ PHI
W 122-119 OT
35
12-20
60.0
0-0
0.0
2-2
100.0
13
3
0
0
4
2
26
Nov 20
vs DEN
W 121-109
29
6-10
60.0
0-0
0.0
3-6
50.0
5
5
0
1
3
2
15
Nov 18
vs DET
W 108-100
32
4-8
50.0
0-0
0.0
2-3
66.7
7
2
5
0
1
2
10
Nov 16
@ POR
W 109-95
29
3-3
100.0
0-0
0.0
5-6
83.3
9
1
3
0
3
3
11
Nov 14
@ SAC
L 132-120
22
5-6
83.3
0-0
0.0
2-3
66.7
9
1
0
0
2
2
12
Nov 12
@ GS
W 118-110
28
2-6
33.3
0-0
0.0
8-9
88.9
5
4
0
0
4
1
12
Nov 9
@ OKC
L 128-120
26
4-6
66.7
0-0
0.0
6-9
66.7
6
1
1
2
0
1
14
Nov 6
vs GS
W 115-104
28
5-7
71.4
0-0
0.0
2-2
100.0
9
3
0
0
1
2
12
Nov 4
@ IND
L 121-116
21
4-6
66.7
0-0
0.0
2-3
66.7
7
0
2
1
4
1
10
06 / 4 GAMES IN 2023-24
Game log: Playoffs
Date
Opp
Result
MIN
FG
FG%
3PT
3P%
FT
FT%
REB
AST
BLK
STL
PF
TO
PTS
Apr 28
@ ORL
L 112-89
29
8-11
72.7
0-0
0.0
5-7
71.4
9
0
0
1
1
1
21
Apr 26
@ ORL
L 121-83
24
5-6
83.3
0-0
0.0
5-5
100.0
8
0
1
0
2
2
15
Apr 23
vs ORL
W 96-86
39
6-10
60.0
0-0
0.0
4-8
50.0
20
3
3
2
4
2
16
Apr 21
vs ORL
W 97-83
35
6-10
60.0
0-0
0.0
4-6
66.7
18
2
0
2
1
0
16
07 / 2023-24 HOME / AWAY, RESULTS, MONTHS AND OPPONENTS
LATEST UPDATEAllen (knee) has been ruled out for Saturday's game against the Mavericks.
Allen will get a break to rest his injured right knee after playing in each of Cleveland's last three games. With Evan Mobley (toe) also out, Thomas Bryant can be expected to take on a larger role Saturday.