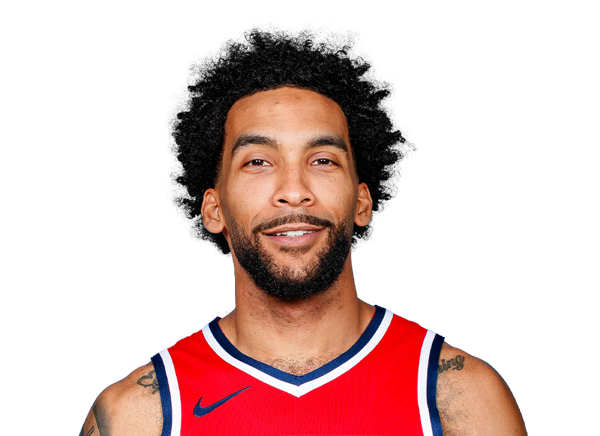
Click a season to open this player’s full game log, splits and advanced stats for that year; click a team to open its page. A dash means no NBA games were recorded.
03 / EVERY CATEGORY THE PROVIDER REPORTS
Full statistical breakdown
Regular season 2022-23
Defensive
Metric
Total
NBA rank
Blocks
0
Tied-491st
Defensive Rebounds
5
Tied-497th
Steals
1
Tied-496th
Defensive Rebound Rate
0.0
—
Defensive Rebounds Per Game
1.0
—
Blocks Per Game
0.0
—
Steals Per Game
0.2
—
Defensive Rebounds Per 48
7.1
Tied-2,982nd
Blocks Per 48
0.0
Tied-2,946th
Steals Per 48
1.4
Tied-2,976th
Defensive Real Plus-Minus
-2.17
—
General
Metric
Total
NBA rank
Disqualifications
0
Tied-155th
Flagrant Fouls
0
Tied-145th
Fouls
2
Tied-514th
Player Efficiency Rating
10.38
—
Rebound Rate
13.0
—
Ejections
0
Tied-65th
Technical Fouls
0
Tied-255th
Rebounds
8
—
Value Over Replacement Player
0.0
—
Wins Above Replacement Player
0.0
—
Real Plus-Minus
-3.38
—
Minutes
34
8th
Minutes Per Game
6.8
—
Rating
4.6
Tied-370th
Plus-Minus
-4
Tied-1st
Rebounds Per Game
1.6
—
Fouls Per Game
0.4
—
Flagrant Fouls Per Game
0.0
—
Technical Fouls Per Game
0.0
—
Ejections Per Game
0.0
—
Disqualifications Per Game
0.0
—
Assist To Turnover Ratio
INF
—
Steal To Foul Ratio
0.5
—
Block To Foul Ratio
0.0
—
Team Rebounds Per Game
0.0
—
Rebounds
8
—
Total Technical Fouls
0
—
Assist To Turnover Ratio
0.0
—
Steal To Turnover Ratio
INF
—
Rebounds Per 48 Minutes
11.3
—
Fouls Per 48 Minutes
2.8
Tied-3,084th
Flagrant Fouls Per 48 Minutes
0.0
Tied-870th
Technical Fouls Per 48 Minutes
0.0
Tied-1,530th
Ejections Per 48 Minutes
0.0
Tied-390th
Disqualifications Per 48 Minutes
0.0
Tied-930th
R/40
9.4
—
Games Played
5
5th
Games Started
0
Tied-413th
Double Double
0
Tied-253rd
Triple Double
0
Tied-39th
Offensive
Metric
Total
NBA rank
Assists
4
Tied-486th
Effective Field Goal Percentage
36.7
—
Field Goals
5/15
—
Field Goals Attempted
15
Tied-494th
Field Goals Made
5
Tied-501st
Field Goal Percentage
33.3
—
Free Throws
0/0
—
Free Throw Percentage
0.0
—
Free Throws Attempted
0
Tied-516th
Free Throws Made
0
Tied-511th
Offensive Rebounds
3
Tied-467th
Points
11
506th
Turnovers
0
Tied-519th
3-Point Field Goal Percentage
20.0
—
3-Point Field Goals Attempted
5
Tied-468th
3-Point Field Goals Made
1
Tied-459th
True Shooting Percentage
36.7
—
Total Turnovers
0
—
Assist Ratio
21.1
—
Points in the Paint
0
Tied-1st
Offensive Rebound Rate
9.6
—
Turnover Ratio
0.0
—
Brick Index
0.00
—
Usage Rate
0.0
—
Average Field Goals Made
1.0
—
Average Field Goals Attempted
3.0
—
Average 3-Point Field Goals Made
0.2
—
Average 3-Point Field Goals Attempted
1.0
—
Average Free Throws Made
0.0
—
Average Free Throws Attempted
0.0
—
Points Per Game
2.2
—
Offensive Rebounds Per Game
0.6
—
Assists Per Game
0.8
—
Turnovers Per Game
0.0
—
Offensive Rebound Percentage
0.3
—
Estimated Possessions
12.0
—
Estimated Possessions Per Game
2.4
—
Points Per Estimated Possession
0.9
—
Team Turnovers Per Game
0.0
—
Total Turnovers Per Game
0.0
—
3-Point Field Goal Percentage
20.0
—
2-Point Field Goals Made
4.0
Tied-42nd
2-Point Field Goals Attempted
10.0
Tied-26th
2-Point Field Goals Made per Game
0.8
—
2-Point Field Goals Attempted per Game
2.0
—
2-Point Field Goal Percentage
40.0
—
Shooting Efficiency
0.37
—
Scoring Efficiency
0.733
—
Fieldgoals Made Per 48
7.1
Tied-3,006th
Fieldgoals Attempted Per 48
21.2
Tied-2,964th
3-Point Fieldgoals Made Per 48
1.4
Tied-2,754th
3-Point Fieldgoals Attempted Per 48
7.1
Tied-2,808th
Freethrows Made Per 48
0.0
Tied-3,066th
Freethrows Attempted Per 48
0.0
Tied-3,096th
Points Scored Per 48
15.5
3,036th
Offensive Rebounds Per 48
4.2
Tied-2,802nd
Assists Per 48
5.6
Tied-2,916th
Turnovers
0.0
Tied-3,114th
P/40
12.9
—
A/40
4.7
—
Offensive Real Plus-Minus
-1.21
—
Playoffs 2022-23
Defensive
Metric
Total
NBA rank
Blocks
0
Tied-147th
Defensive Rebounds
0
Tied-198th
Steals
0
Tied-159th
Defensive Rebound Rate
0.0
—
Defensive Rebounds Per Game
0.0
—
Blocks Per Game
0.0
—
Steals Per Game
0.0
—
Defensive Rebounds Per 48
0.0
3,168th
Blocks Per 48
0.0
2,352nd
Steals Per 48
0.0
2,544th
Defensive Real Plus-Minus
-2.28
—
General
Metric
Total
NBA rank
Disqualifications
0
Tied-19th
Flagrant Fouls
0
Tied-19th
Fouls
2
Tied-161st
Player Efficiency Rating
0.00
—
Rebound Rate
0.0
—
Ejections
0
Tied-6th
Technical Fouls
0
Tied-43rd
Rebounds
0
—
Value Over Replacement Player
0.0
—
Wins Above Replacement Player
0.0
—
Real Plus-Minus
-3.43
—
Minutes
10
Tied-3rd
Minutes Per Game
2.5
—
Rating
0.2
Tied-244th
Plus-Minus
0
Tied-1st
Rebounds Per Game
0.0
—
Fouls Per Game
0.5
—
Flagrant Fouls Per Game
0.0
—
Technical Fouls Per Game
0.0
—
Ejections Per Game
0.0
—
Disqualifications Per Game
0.0
—
Assist To Turnover Ratio
0.0
—
Steal To Foul Ratio
0.0
—
Block To Foul Ratio
0.0
—
Team Rebounds Per Game
0.0
—
Rebounds
0
—
Total Technical Fouls
0
—
Assist To Turnover Ratio
0.0
—
Steal To Turnover Ratio
0.0
—
Rebounds Per 48 Minutes
0.0
—
Fouls Per 48 Minutes
9.6
2,576th
Flagrant Fouls Per 48 Minutes
0.0
304th
Technical Fouls Per 48 Minutes
0.0
688th
Ejections Per 48 Minutes
0.0
96th
Disqualifications Per 48 Minutes
0.0
304th
R/40
0.0
—
Games Played
4
4th
Games Started
0
Tied-106th
Double Double
0
Tied-58th
Triple Double
0
Tied-6th
Offensive
Metric
Total
NBA rank
Assists
0
Tied-184th
Effective Field Goal Percentage
25.0
—
Field Goals
1/4
—
Field Goals Attempted
4
Tied-173rd
Field Goals Made
1
Tied-178th
Field Goal Percentage
25.0
—
Free Throws
0/0
—
Free Throw Percentage
0.0
—
Free Throws Attempted
0
Tied-164th
Free Throws Made
0
Tied-162nd
Offensive Rebounds
0
Tied-165th
Points
2
Tied-185th
Turnovers
0
Tied-181st
3-Point Field Goal Percentage
0.0
—
3-Point Field Goals Attempted
3
Tied-145th
3-Point Field Goals Made
0
Tied-153rd
True Shooting Percentage
25.0
—
Total Turnovers
0
—
Assist Ratio
0.0
—
Points in the Paint
0
Tied-1st
Offensive Rebound Rate
0.0
—
Turnover Ratio
0.0
—
Brick Index
0.00
—
Usage Rate
0.0
—
Average Field Goals Made
0.3
—
Average Field Goals Attempted
1.0
—
Average 3-Point Field Goals Made
0.0
—
Average 3-Point Field Goals Attempted
0.8
—
Average Free Throws Made
0.0
—
Average Free Throws Attempted
0.0
—
Points Per Game
0.5
—
Offensive Rebounds Per Game
0.0
—
Assists Per Game
0.0
—
Turnovers Per Game
0.0
—
Offensive Rebound Percentage
0.0
—
Estimated Possessions
4.0
—
Estimated Possessions Per Game
1.0
—
Points Per Estimated Possession
0.5
—
Team Turnovers Per Game
0.0
—
Total Turnovers Per Game
0.0
—
3-Point Field Goal Percentage
0.0
—
2-Point Field Goals Made
1.0
Tied-25th
2-Point Field Goals Attempted
1.0
Tied-28th
2-Point Field Goals Made per Game
0.3
—
2-Point Field Goals Attempted per Game
0.3
—
2-Point Field Goal Percentage
100.0
—
Shooting Efficiency
0.25
—
Scoring Efficiency
0.500
—
Fieldgoals Made Per 48
4.8
2,848th
Fieldgoals Attempted Per 48
19.2
2,768th
3-Point Fieldgoals Made Per 48
0.0
2,448th
3-Point Fieldgoals Attempted Per 48
14.4
2,320th
Freethrows Made Per 48
0.0
2,592nd
Freethrows Attempted Per 48
0.0
2,624th
Points Scored Per 48
9.6
2,960th
Offensive Rebounds Per 48
0.0
2,640th
Assists Per 48
0.0
2,944th
Turnovers
0.0
2,896th
P/40
8.0
—
A/40
0.0
—
Offensive Real Plus-Minus
-1.15
—
04 / EFFICIENCY, SHOOTING PROFILE, PER-36
Advanced metrics
True shooting %36.7%
Effective FG %36.7%
2-point FG %40.0%
3-point attempt rate33.3%
Free throw rate0.0%
Points per shot attempt0.73
% of points from 3s27.3%
Points per 36 min11.6
Rebounds per 36 min8.5
Assists per 36 min4.2
Steals per 36 min1.06
Blocks per 36 min0.00
Turnovers per 36 min0.00
Stocks (STL + BLK) per game0.20
Pts + Reb + Ast per game4.6
Efficiency (EFF) per game2.8
Game Score per game (Hollinger)1.8
Minutes per game6.8
Calculated by BallersCulture from the supplied 2022-23 box-score totals using standard formulas (hover a tile to see the formula). Tracking-based metrics such as BPM, VORP, on/off and RAPTOR are not available from this data source.
05 / 5 GAMES IN 2022-23
Game log: Regular season
Date
Opp
Result
MIN
FG
FG%
3PT
3P%
FT
FT%
REB
AST
BLK
STL
PF
TO
PTS
Apr 10
vs ATL
W 120-114
20
2-12
16.7
1-5
20.0
0-0
0.0
4
3
0
1
0
0
5
Apr 8
vs TOR
W 121-102
4
0-0
0.0
0-0
0.0
0-0
0.0
0
0
0
0
1
0
0
Dec 8
vs LAL
W 126-113
2
0-0
0.0
0-0
0.0
0-0
0.0
1
1
0
0
0
0
0
Nov 1
vs ATL
W 139-109
5
2-2
100.0
0-0
0.0
0-0
0.0
2
0
0
0
1
0
4
Oct 29
vs PHI
L 112-90
3
1-1
100.0
0-0
0.0
0-0
0.0
1
0
0
0
0
0
2
06 / 4 GAMES IN 2022-23
Game log: Playoffs
Date
Opp
Result
MIN
FG
FG%
3PT
3P%
FT
FT%
REB
AST
BLK
STL
PF
TO
PTS
May 26
vs MIA
W 110-97
2
0-0
0.0
0-0
0.0
0-0
0.0
0
0
0
0
0
0
0
May 24
@ MIA
W 116-99
1
0-0
0.0
0-0
0.0
0-0
0.0
0
0
0
0
0
0
0
May 15
vs PHI
W 112-88
2
1-2
50.0
0-1
0.0
0-0
0.0
0
0
0
0
1
0
2
May 4
vs PHI
W 121-87
5
0-2
0.0
0-2
0.0
0-0
0.0
0
0
0
0
1
0
0
07 / 2022-23 HOME / AWAY, RESULTS, MONTHS AND OPPONENTS
Splits
split
Split
GP
MIN
FG
FG%
3PT
3P%
FT
FT%
OR
DR
REB
AST
BLK
STL
PF
TO
PTS
All Splits
5
6.8
1.0-3.0
33.3
0.2-1.0
20.0
0.0-0.0
0.0
0.6
1.0
1.6
0.8
0.0
0.2
0.4
0.0
2.2
Home
5
6.8
1.0-3.0
33.3
0.2-1.0
20.0
0.0-0.0
0.0
0.6
1.0
1.6
0.8
0.0
0.2
0.4
0.0
2.2
vs. Division
2
3.5
0.5-0.5
100.0
0.0-0.0
0.0
0.0-0.0
0.0
0.5
0.0
0.5
0.0
0.0
0.0
0.5
0.0
1.0
vs. Conference
4
8.0
1.3-3.8
33.3
0.3-1.3
20.0
0.0-0.0
0.0
0.8
1.0
1.8
0.8
0.0
0.3
0.5
0.0
2.8
3+ Days Rest
3
3.0
0.3-0.3
100.0
0.0-0.0
0.0
0.0-0.0
0.0
0.3
0.3
0.7
0.3
0.0
0.0
0.3
0.0
0.7
Month
Split
GP
MIN
FG
FG%
3PT
3P%
FT
FT%
OR
DR
REB
AST
BLK
STL
PF
TO
PTS
October
2
4.5
1.5-1.5
100.0
0.0-0.0
0.0
0.0-0.0
0.0
0.5
1.0
1.5
0.0
0.0
0.0
0.5
0.0
3.0
December
1
2.0
0.0-0.0
0.0
0.0-0.0
0.0
0.0-0.0
0.0
0.0
1.0
1.0
1.0
0.0
0.0
0.0
0.0
0.0
April
2
11.5
1.0-6.0
16.7
0.5-2.5
20.0
0.0-0.0
0.0
1.0
1.0
2.0
1.5
0.0
0.5
0.5
0.0
2.5
Pre All-Star
3
3.7
1.0-1.0
100.0
0.0-0.0
0.0
0.0-0.0
0.0
0.3
1.0
1.3
0.3
0.0
0.0
0.3
0.0
2.0
Post All-Star
2
11.5
1.0-6.0
16.7
0.5-2.5
20.0
0.0-0.0
0.0
1.0
1.0
2.0
1.5
0.0
0.5
0.5
0.0
2.5
Result
Split
GP
MIN
FG
FG%
3PT
3P%
FT
FT%
OR
DR
REB
AST
BLK
STL
PF
TO
PTS
Wins
4
7.8
1.0-3.5
28.6
0.3-1.3
20.0
0.0-0.0
0.0
0.5
1.3
1.8
1.0
0.0
0.3
0.5
0.0
2.3
Losses
1
3.0
1.0-1.0
100.0
0.0-0.0
0.0
0.0-0.0
0.0
1.0
0.0
1.0
0.0
0.0
0.0
0.0
0.0
2.0
Day
Split
GP
MIN
FG
FG%
3PT
3P%
FT
FT%
OR
DR
REB
AST
BLK
STL
PF
TO
PTS
Monday
1
5.0
2.0-2.0
100.0
0.0-0.0
0.0
0.0-0.0
0.0
0.0
2.0
2.0
0.0
0.0
0.0
1.0
0.0
4.0
Wednesday
1
2.0
0.0-0.0
0.0
0.0-0.0
0.0
0.0-0.0
0.0
0.0
1.0
1.0
1.0
0.0
0.0
0.0
0.0
0.0
Friday
2
3.5
0.5-0.5
100.0
0.0-0.0
0.0
0.0-0.0
0.0
0.5
0.0
0.5
0.0
0.0
0.0
0.5
0.0
1.0
Sunday
1
20.0
2.0-12.0
16.7
1.0-5.0
20.0
0.0-0.0
0.0
2.0
2.0
4.0
3.0
0.0
1.0
0.0
0.0
5.0
Opponent
Split
GP
MIN
FG
FG%
3PT
3P%
FT
FT%
OR
DR
REB
AST
BLK
STL
PF
TO
PTS
Atlanta Hawks
2
12.5
2.0-7.0
28.6
0.5-2.5
20.0
0.0-0.0
0.0
1.0
2.0
3.0
1.5
0.0
0.5
0.5
0.0
4.5
Los Angeles Lakers
1
2.0
0.0-0.0
0.0
0.0-0.0
0.0
0.0-0.0
0.0
0.0
1.0
1.0
1.0
0.0
0.0
0.0
0.0
0.0
Philadelphia 76ers
1
3.0
1.0-1.0
100.0
0.0-0.0
0.0
0.0-0.0
0.0
1.0
0.0
1.0
0.0
0.0
0.0
0.0
0.0
2.0
Toronto Raptors
1
4.0
0.0-0.0
0.0
0.0-0.0
0.0
0.0-0.0
0.0
0.0
0.0
0.0
0.0
0.0
0.0
1.0
0.0
0.0
08 / SEASON-BY-SEASON HISTORY
Career statistics
Regular Season Averages
Season
Team
GP
GS
MIN
FG
FG%
3PT
3P%
FT
FT%
OR
DR
REB
AST
BLK
STL
PF
TO
PTS
2021-22
Toronto Raptors
36
0
7.8
0.9-1.9
46.3
0.3-0.8
35.7
0.3-0.3
100.0
1.0
1.0
2.0
0.3
0.1
0.2
0.9
0.2
2.3
2022-23
Toronto Raptors
3
0
3.7
1.0-1.0
100.0
0.0-0.0
0.0
0.0-0.0
0.0
0.3
1.0
1.3
0.3
0.0
0.0
0.3
0.0
2.0
2022-23
Boston Celtics
2
0
11.5
1.0-6.0
16.7
0.5-2.5
20.0
0.0-0.0
0.0
1.0
1.0
2.0
1.5
0.0
0.5
0.5
0.0
2.5
2022-23
2022 23 Totals
5
0
6.8
1.0-3.0
33.3
0.2-1.0
20.0
0.0-0.0
0.0
0.6
1.0
1.6
0.8
0.0
0.2
0.4
0.0
2.2
2023-24
Washington Wizards
15
1
15.7
2.1-5.2
41.0
0.9-3.0
28.9
0.8-1.0
80.0
1.3
2.3
3.5
1.3
0.6
0.7
0.9
0.7
5.9
2024-25
Washington Wizards
62
31
21.6
3.4-6.6
51.1
1.2-3.1
38.3
0.8-1.2
68.5
1.8
3.9
5.7
1.0
0.6
1.0
1.8
0.9
8.8
2025-26
Washington Wizards
69
19
20.0
3.4-6.7
50.2
0.8-2.4
31.9
1.2-1.5
78.4
2.1
3.5
5.6
1.2
0.6
0.9
1.7
0.7
8.7
2026-27
Washington Wizards
4
0
18.3
3.0-5.0
60.0
0.5-1.8
28.6
0.8-0.8
100.0
1.5
6.0
7.5
1.3
0.5
0.5
1.5
0.0
7.3
Career
—
191
51
17.5
2.7-5.5
49.6
0.8-2.3
34.5
0.8-1.1
76.2
1.7
3.0
4.7
1.0
0.5
0.8
1.5
0.6
7.1
Regular Season Totals
Season
Team
FG
FG%
3PT
3P%
FT
FT%
OR
DR
REB
AST
BLK
STL
PF
TO
PTS
2021-22
Toronto Raptors
31-67
46.3
10-28
35.7
9-9
100.0
37
35
72
11
4
8
32
8
81
2022-23
Toronto Raptors
3-3
100.0
0-0
0.0
0-0
0.0
1
3
4
1
0
0
1
0
6
2022-23
Boston Celtics
2-12
16.7
1-5
20.0
0-0
0.0
2
2
4
3
0
1
1
0
5
2022-23
2022 23 Totals
5-15
33.3
1-5
20.0
0-0
0.0
3
5
8
4
0
1
2
0
11
2023-24
Washington Wizards
32-78
41.0
13-45
28.9
12-15
80.0
19
34
53
19
9
10
14
10
89
2024-25
Washington Wizards
210-411
51.1
74-193
38.3
50-73
68.5
112
239
351
60
39
65
110
54
544
2025-26
Washington Wizards
232-462
50.2
53-166
31.9
80-102
78.4
145
239
384
84
43
59
114
45
597
2026-27
Washington Wizards
12-20
60.0
2-7
28.6
3-3
100.0
6
24
30
5
2
2
6
0
29
Career
—
522-1053
49.6
153-444
34.5
154-202
76.2
322
576
898
183
97
145
278
117
1351
Regular Season Misc Totals
Season
Team
DD2
TD3
DQ
EJECT
TECH
FLAG
AST/TO
STL/TO
SC-EFF
SH-EFF
2021-22
Toronto Raptors
0
0
0
1
1
0
1.4
1.0
1.209
0.54
2022-23
Toronto Raptors
0
0
0
0
0
0
INF
0.0
2.000
1.00
2022-23
Boston Celtics
0
0
0
0
0
0
INF
INF
0.417
0.21
2022-23
2022 23 Totals
0
0
0
0
0
0
INF
INF
0.733
0.37
2023-24
Washington Wizards
0
0
0
0
0
0
1.9
1.0
1.141
0.49
2024-25
Washington Wizards
8
0
0
0
1
1
1.1
1.2
1.324
0.60
2025-26
Washington Wizards
4
0
0
2
7
0
1.9
1.3
1.292
0.56
2026-27
Washington Wizards
1
0
0
0
0
0
INF
INF
1.450
0.65
Career
—
13
0
0
3
9
1
1.6
1.2
1.283
0.57
Scoring, rebounding and assist trend
09 / RECORD, TEAM STATS AND TEAMMATES
Team
TEAM \u00b7 2022-23
2022 23 Totals
10 / SALARY BY SEASON
Contract
Season
Salary
2022-23
$28,241
2024-25
$1.8M
2025-26
$2.35M
2026-27
$2.67M
Total listed: $6.85M · source: espn.
11 / LATEST REPORT
Injury status
No current injury report entry for this player.
12 / SIGNINGS, TRADES AND ROSTER MOVES
Transactions
No recorded transactions for this player.
13 / LATEST COVERAGE
Player news
LATEST UPDATEChampagnie (foot) is expected to miss several months, per Josh Robbins of The Athletic.
The forward underwent surgery Wednesday to address a fractured foot, and the Wizards hope Champagnie will be ready to return around the All-Star break in February. The likes of Bilal Coulibaly, Tre Johnson and Bub Carrington will all be asked to help pick up the slack for the foreseeable future.