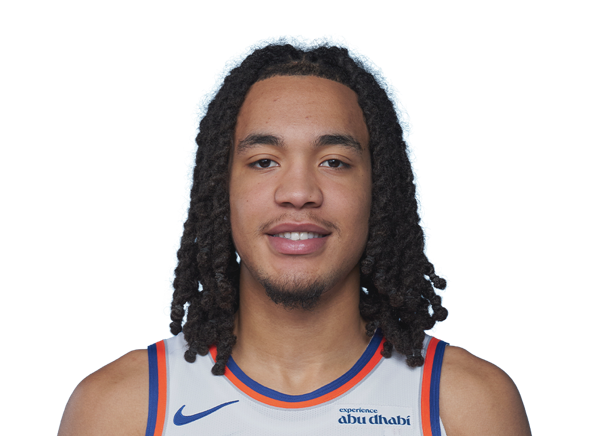
Click a season to open this player’s full game log, splits and advanced stats for that year; click a team to open its page. A dash means no NBA games were recorded.
03 / EVERY CATEGORY THE PROVIDER REPORTS
Full statistical breakdown
Regular season 2025-26
Defensive
Metric
Total
NBA rank
Blocks
1
Tied-493rd
Defensive Rebounds
23
Tied-463rd
Steals
3
Tied-500th
Defensive Rebound Rate
0.0
—
Defensive Rebounds Per Game
0.8
—
Blocks Per Game
0.0
—
Steals Per Game
0.1
—
Defensive Rebounds Per 48
8.1
Tied-2,778th
Blocks Per 48
0.4
Tied-2,958th
Steals Per 48
1.1
Tied-3,000th
General
Metric
Total
NBA rank
Disqualifications
0
Tied-41st
Flagrant Fouls
0
Tied-116th
Fouls
8
Tied-510th
Player Efficiency Rating
9.61
—
Rebound Rate
0.0
—
Ejections
0
Tied-51st
Technical Fouls
0
Tied-269th
Rebounds
27
—
Value Over Replacement Player
0.0
—
Minutes
136
8th
Minutes Per Game
4.7
—
Rating
3.1
Tied-95th
Plus-Minus
-5
Tied-1st
Rebounds Per Game
0.9
—
Fouls Per Game
0.3
—
Flagrant Fouls Per Game
0.0
—
Technical Fouls Per Game
0.0
—
Ejections Per Game
0.0
—
Disqualifications Per Game
0.0
—
Assist To Turnover Ratio
4.0
—
Steal To Foul Ratio
0.4
—
Block To Foul Ratio
0.1
—
Team Rebounds Per Game
0.0
—
Rebounds
27
—
Total Technical Fouls
0
—
Assist To Turnover Ratio
0.0
—
Steal To Turnover Ratio
1.0
—
Rebounds Per 48 Minutes
9.5
—
Fouls Per 48 Minutes
2.8
Tied-3,060th
Flagrant Fouls Per 48 Minutes
0.0
Tied-696th
Technical Fouls Per 48 Minutes
0.0
Tied-1,614th
Ejections Per 48 Minutes
0.0
Tied-306th
Disqualifications Per 48 Minutes
0.0
Tied-246th
R/40
7.9
—
Games Played
29
29th
Games Started
0
Tied-450th
Double Double
0
Tied-284th
Triple Double
0
Tied-38th
Offensive
Metric
Total
NBA rank
Assists
12
Tied-468th
Effective Field Goal Percentage
40.6
—
Field Goals
16/48
—
Field Goals Attempted
48
Tied-479th
Field Goals Made
16
Tied-485th
Field Goal Percentage
33.3
—
Free Throws
9/11
—
Free Throw Percentage
81.8
—
Free Throws Attempted
11
Tied-457th
Free Throws Made
9
Tied-452nd
Offensive Rebounds
4
Tied-495th
Points
48
Tied-482nd
Turnovers
3
Tied-514th
3-Point Field Goal Percentage
21.9
—
3-Point Field Goals Attempted
32
Tied-412th
3-Point Field Goals Made
7
Tied-426th
True Shooting Percentage
45.4
—
Total Turnovers
3
—
Assist Ratio
17.7
—
Points in the Paint
0
Tied-1st
Offensive Rebound Rate
0.0
—
Turnover Ratio
4.4
—
Brick Index
0.00
—
Usage Rate
0.0
—
Average Field Goals Made
0.6
—
Average Field Goals Attempted
1.7
—
Average 3-Point Field Goals Made
0.2
—
Average 3-Point Field Goals Attempted
1.1
—
Average Free Throws Made
0.3
—
Average Free Throws Attempted
0.4
—
Points Per Game
1.7
—
Offensive Rebounds Per Game
0.1
—
Assists Per Game
0.4
—
Turnovers Per Game
0.1
—
Offensive Rebound Percentage
0.1
—
Estimated Possessions
51.4
—
Estimated Possessions Per Game
1.8
—
Points Per Estimated Possession
0.9
—
Team Turnovers Per Game
0.0
—
Total Turnovers Per Game
0.1
—
3-Point Field Goal Percentage
21.9
—
2-Point Field Goals Made
9.0
Tied-59th
2-Point Field Goals Attempted
16.0
Tied-67th
2-Point Field Goals Made per Game
0.3
—
2-Point Field Goals Attempted per Game
0.6
—
2-Point Field Goal Percentage
56.3
—
Shooting Efficiency
0.41
—
Scoring Efficiency
1.000
—
Fieldgoals Made Per 48
5.6
Tied-2,910th
Fieldgoals Attempted Per 48
16.9
Tied-2,874th
3-Point Fieldgoals Made Per 48
2.5
Tied-2,556th
3-Point Fieldgoals Attempted Per 48
11.3
Tied-2,472nd
Freethrows Made Per 48
3.2
Tied-2,712th
Freethrows Attempted Per 48
3.9
Tied-2,742nd
Points Scored Per 48
16.9
Tied-2,892nd
Offensive Rebounds Per 48
1.4
Tied-2,970th
Assists Per 48
4.2
Tied-2,808th
Turnovers
1.1
Tied-3,084th
P/40
14.1
—
A/40
3.5
—
Playoffs 2025-26
Defensive
Metric
Total
NBA rank
Blocks
0
Tied-154th
Defensive Rebounds
5
Tied-156th
Steals
2
Tied-125th
Defensive Rebound Rate
0.0
—
Defensive Rebounds Per Game
0.7
—
Blocks Per Game
0.0
—
Steals Per Game
0.3
—
Defensive Rebounds Per 48
6.0
2,496th
Blocks Per 48
0.0
2,464th
Steals Per 48
2.4
2,000th
General
Metric
Total
NBA rank
Disqualifications
0
Tied-9th
Flagrant Fouls
0
Tied-18th
Fouls
1
Tied-193rd
Player Efficiency Rating
0.00
—
Rebound Rate
0.0
—
Ejections
0
Tied-7th
Technical Fouls
0
Tied-63rd
Rebounds
7
—
Value Over Replacement Player
0.0
—
Minutes
40
Tied-3rd
Minutes Per Game
5.7
—
Rating
4.9
Tied-120th
Plus-Minus
-3
Tied-1st
Rebounds Per Game
1.0
—
Fouls Per Game
0.1
—
Flagrant Fouls Per Game
0.0
—
Technical Fouls Per Game
0.0
—
Ejections Per Game
0.0
—
Disqualifications Per Game
0.0
—
Assist To Turnover Ratio
1.5
—
Steal To Foul Ratio
2.0
—
Block To Foul Ratio
0.0
—
Team Rebounds Per Game
0.0
—
Rebounds
7
—
Total Technical Fouls
0
—
Assist To Turnover Ratio
0.0
—
Steal To Turnover Ratio
1.0
—
Rebounds Per 48 Minutes
8.4
—
Fouls Per 48 Minutes
1.2
3,088th
Flagrant Fouls Per 48 Minutes
0.0
288th
Technical Fouls Per 48 Minutes
0.0
1,008th
Ejections Per 48 Minutes
0.0
112th
Disqualifications Per 48 Minutes
0.0
144th
R/40
7.0
—
Games Played
7
7th
Games Started
0
Tied-104th
Double Double
0
Tied-49th
Triple Double
0
Tied-5th
Offensive
Metric
Total
NBA rank
Assists
3
Tied-150th
Effective Field Goal Percentage
59.4
—
Field Goals
8/16
—
Field Goals Attempted
16
Tied-148th
Field Goals Made
8
Tied-143rd
Field Goal Percentage
50.0
—
Free Throws
1/2
—
Free Throw Percentage
50.0
—
Free Throws Attempted
2
Tied-153rd
Free Throws Made
1
Tied-165th
Offensive Rebounds
2
Tied-147th
Points
20
Tied-145th
Turnovers
2
Tied-152nd
3-Point Field Goal Percentage
37.5
—
3-Point Field Goals Attempted
8
Tied-133rd
3-Point Field Goals Made
3
Tied-122nd
True Shooting Percentage
59.2
—
Total Turnovers
2
—
Assist Ratio
13.7
—
Points in the Paint
0
Tied-1st
Offensive Rebound Rate
0.0
—
Turnover Ratio
9.1
—
Brick Index
0.00
—
Usage Rate
0.0
—
Average Field Goals Made
1.1
—
Average Field Goals Attempted
2.3
—
Average 3-Point Field Goals Made
0.4
—
Average 3-Point Field Goals Attempted
1.1
—
Average Free Throws Made
0.1
—
Average Free Throws Attempted
0.3
—
Points Per Game
2.9
—
Offensive Rebounds Per Game
0.3
—
Assists Per Game
0.4
—
Turnovers Per Game
0.3
—
Offensive Rebound Percentage
0.3
—
Estimated Possessions
16.8
—
Estimated Possessions Per Game
2.4
—
Points Per Estimated Possession
1.2
—
Team Turnovers Per Game
0.0
—
Total Turnovers Per Game
0.3
—
3-Point Field Goal Percentage
37.5
—
2-Point Field Goals Made
5.0
Tied-21st
2-Point Field Goals Attempted
8.0
Tied-15th
2-Point Field Goals Made per Game
0.7
—
2-Point Field Goals Attempted per Game
1.1
—
2-Point Field Goal Percentage
62.5
—
Shooting Efficiency
0.59
—
Scoring Efficiency
1.250
—
Fieldgoals Made Per 48
9.6
2,288th
Fieldgoals Attempted Per 48
19.2
2,368th
3-Point Fieldgoals Made Per 48
3.6
1,952nd
3-Point Fieldgoals Attempted Per 48
9.6
2,128th
Freethrows Made Per 48
1.2
2,640th
Freethrows Attempted Per 48
2.4
2,448th
Points Scored Per 48
24.0
2,320th
Offensive Rebounds Per 48
2.4
2,352nd
Assists Per 48
3.6
2,400th
Turnovers
2.4
2,432nd
P/40
20.0
—
A/40
3.0
—
04 / EFFICIENCY, SHOOTING PROFILE, PER-36
Advanced metrics
True shooting %45.3%
Effective FG %41.2%
2-point FG %66.7%
3-point attempt rate64.7%
Free throw rate23.5%
Points per shot attempt1.00
% of points from 3s35.3%
Assist-to-turnover4.00
Points per 36 min13.0
Rebounds per 36 min6.9
Assists per 36 min3.1
Steals per 36 min0.77
Blocks per 36 min0.00
Turnovers per 36 min0.77
Stocks (STL + BLK) per game0.10
Pts + Reb + Ast per game3.0
Efficiency (EFF) per game1.8
Game Score per game (Hollinger)1.2
Minutes per game4.7
Calculated by BallersCulture from the supplied 2025-26 box-score totals using standard formulas (hover a tile to see the formula). Tracking-based metrics such as BPM, VORP, on/off and RAPTOR are not available from this data source.
05 / 28 GAMES IN 2025-26
Game log: Regular season
Date
Opp
Result
MIN
FG
FG%
3PT
3P%
FT
FT%
REB
AST
BLK
STL
PF
TO
PTS
Apr 13
vs CHA
L 110-96
27
5-11
45.5
1-5
20.0
1-3
33.3
4
2
0
0
2
1
12
Apr 11
vs TOR
W 112-95
4
0-2
0.0
0-2
0.0
2-2
100.0
1
0
0
0
0
0
2
Apr 4
vs CHI
W 136-96
10
2-5
40.0
1-4
25.0
0-0
0.0
1
0
0
0
1
0
5
Apr 1
@ HOU
L 111-94
2
0-1
0.0
0-1
0.0
0-0
0.0
1
0
0
0
0
0
0
Mar 23
vs WSH
W 145-113
3
0-2
0.0
0-2
0.0
0-0
0.0
0
0
0
0
0
0
0
Mar 18
vs IND
W 136-110
4
1-4
25.0
0-3
0.0
0-0
0.0
2
1
0
0
0
1
2
Mar 14
@ IND
W 101-92
6
1-3
33.3
1-2
50.0
0-0
0.0
1
0
1
0
2
0
3
Mar 12
@ UTAH
W 134-117
2
0-2
0.0
0-2
0.0
0-0
0.0
1
0
0
0
0
0
0
Mar 7
@ DEN
W 142-103
9
4-5
80.0
3-3
100.0
0-0
0.0
2
0
0
0
0
1
11
Feb 9
@ BOS
W 111-89
4
0-0
0.0
0-0
0.0
0-0
0.0
2
1
0
0
0
0
0
Feb 7
@ DET
L 118-80
7
1-4
25.0
1-3
33.3
2-2
100.0
1
0
0
1
0
0
5
Jan 22
vs BKN
W 120-66
7
0-0
0.0
0-0
0.0
0-0
0.0
0
1
0
0
0
0
0
Jan 20
vs DAL
L 114-97
3
0-0
0.0
0-0
0.0
0-0
0.0
0
1
0
0
0
0
0
Jan 16
@ GS
L 126-113
1
1-1
100.0
0-0
0.0
0-0
0.0
0
0
0
0
0
0
2
Jan 15
@ SAC
L 112-101
3
0-0
0.0
0-0
0.0
0-0
0.0
0
0
0
0
0
0
0
Jan 8
vs LAC
W 123-111
1
0-0
0.0
0-0
0.0
0-0
0.0
1
0
0
0
0
0
0
Jan 6
@ DET
L 121-90
5
0-0
0.0
0-0
0.0
2-2
100.0
2
1
0
1
0
0
2
Jan 3
vs ATL
L 111-99
2
0-0
0.0
0-0
0.0
0-0
0.0
1
1
0
0
0
0
0
Dec 24
@ MIN
L 115-104
11
0-2
0.0
0-2
0.0
0-0
0.0
2
1
0
0
2
0
0
Dec 19
@ IND
W 114-113
4
0-0
0.0
0-0
0.0
0-0
0.0
0
1
0
1
0
0
0
Nov 27
@ CHA
W 129-101
2
0-0
0.0
0-0
0.0
0-0
0.0
1
0
0
0
0
0
0
Nov 25
@ BKN
W 113-100
3
0-1
0.0
0-1
0.0
0-0
0.0
1
0
0
0
0
0
0
Nov 23
@ ORL
L 133-121
3
0-1
0.0
0-1
0.0
0-0
0.0
0
0
0
0
0
0
0
Nov 13
vs ORL
L 124-107
2
1-2
50.0
0-1
0.0
0-0
0.0
0
1
0
0
0
0
2
Nov 10
vs BKN
W 134-98
6
0-2
0.0
0-0
0.0
2-2
100.0
1
0
0
0
0
0
2
Nov 6
vs MIN
W 137-114
2
0-0
0.0
0-0
0.0
0-0
0.0
1
1
0
0
1
0
0
Nov 4
vs WSH
W 119-102
4
0-0
0.0
0-0
0.0
0-0
0.0
1
0
0
0
0
0
0
Nov 3
vs CHI
W 128-116
1
0-0
0.0
0-0
0.0
0-0
0.0
0
0
0
0
0
0
0
06 / 7 GAMES IN 2025-26
Game log: Playoffs
Date
Opp
Result
MIN
FG
FG%
3PT
3P%
FT
FT%
REB
AST
BLK
STL
PF
TO
PTS
May 26
@ CLE
W 130-93
7
2-4
50.0
1-2
50.0
1-2
50.0
1
0
0
1
0
0
6
May 22
vs CLE
W 109-93
1
0-1
0.0
0-1
0.0
0-0
0.0
0
0
0
0
0
0
0
May 11
@ PHI
W 144-114
12
2-4
50.0
1-1
100.0
0-0
0.0
3
1
0
0
0
1
5
May 9
@ PHI
W 108-94
2
0-0
0.0
0-0
0.0
0-0
0.0
1
0
0
0
0
1
0
May 5
vs PHI
W 137-98
9
2-3
66.7
0-1
0.0
0-0
0.0
1
2
0
1
0
0
4
May 1
@ ATL
W 140-89
8
2-4
50.0
1-3
33.3
0-0
0.0
1
0
0
0
1
0
5
Apr 29
vs ATL
W 126-97
1
0-0
0.0
0-0
0.0
0-0
0.0
0
0
0
0
0
0
0
07 / 2025-26 HOME / AWAY, RESULTS, MONTHS AND OPPONENTS
LATEST UPDATEDadiet posted 10 points (3-9 FG, 1-7 3Pt, 3-4 FT), one rebound, one assist and one block across 18 minutes in Tuesday's 148-98 preseason loss to Toronto.
Dadiet struggled to connect from the perimeter, missing six of his seven three-point attempts, though he managed to reach double figures with a late triple. With New York resting its usual starters, the third-year wing received another opportunity to compete for a place in the team's rotation.