Click a season to open this player’s full game log, splits and advanced stats for that year; click a team to open its page. A dash means no NBA games were recorded.
03 / EVERY CATEGORY THE PROVIDER REPORTS
Full statistical breakdown
Regular season 2026-27
Defensive
Metric
Total
NBA rank
Blocks
9
Tied-61st
Defensive Rebounds
65
Tied-34th
Steals
13
Tied-74th
Defensive Rebound Rate
0.0
—
Defensive Rebounds Per Game
5.0
41st
Blocks Per Game
0.7
Tied-78th
Steals Per Game
1.0
81st
Defensive Rebounds Per 48
7.6
1,632nd
Blocks Per 48
1.1
2,928th
Steals Per 48
1.5
3,552nd
General
Metric
Total
NBA rank
Disqualifications
1
Tied-4th
Flagrant Fouls
0
Tied-22nd
Fouls
40
Tied-21st
Player Efficiency Rating
18.72
55th
Rebound Rate
0.0
—
Ejections
0
Tied-7th
Technical Fouls
3
Tied-2nd
Rebounds
96
—
Value Over Replacement Player
48.5
—
Minutes
410
Tied-1st
Minutes Per Game
31.5
—
Rating
34.2
Tied-23rd
Plus-Minus
-37
Tied-1st
Rebounds Per Game
7.4
30th
Fouls Per Game
3.1
Tied-30th
Flagrant Fouls Per Game
0.0
Tied-19th
Technical Fouls Per Game
0.2
Tied-9th
Ejections Per Game
0.0
Tied-6th
Disqualifications Per Game
0.1
Tied-13th
Assist To Turnover Ratio
1.1
—
Steal To Foul Ratio
0.3
—
Block To Foul Ratio
0.2
—
Team Rebounds Per Game
0.0
—
Rebounds
96
—
Total Technical Fouls
3
—
Assist To Turnover Ratio
0.0
—
Steal To Turnover Ratio
0.3
—
Rebounds Per 48 Minutes
11.2
—
Fouls Per 48 Minutes
4.7
1,008th
Flagrant Fouls Per 48 Minutes
0.0
1,056th
Technical Fouls Per 48 Minutes
0.4
96th
Ejections Per 48 Minutes
0.0
336th
Disqualifications Per 48 Minutes
0.1
192nd
R/40
9.4
—
Games Played
13
13th
Games Started
13
Tied-22nd
Double Double
3
Tied-27th
Triple Double
0
Tied-12th
Offensive
Metric
Total
NBA rank
Assists
45
Tied-73rd
Effective Field Goal Percentage
56.6
—
Field Goals
89/183
—
Field Goals Attempted
183
Tied-40th
Field Goals Made
89
Tied-34th
Field Goal Percentage
48.6
46th
Free Throws
56/76
—
Free Throw Percentage
73.7
Tied-177th
Free Throws Attempted
76
Tied-22nd
Free Throws Made
56
Tied-29th
Offensive Rebounds
31
25th
Points
263
30th
Turnovers
42
11th
3-Point Field Goal Percentage
41.4
64th
3-Point Field Goals Attempted
70
Tied-59th
3-Point Field Goals Made
29
Tied-38th
True Shooting Percentage
60.8
—
Total Turnovers
42
—
Assist Ratio
14.8
—
Points in the Paint
0
Tied-1st
Offensive Rebound Rate
0.0
—
Turnover Ratio
13.8
—
Brick Index
0.00
—
Usage Rate
0.0
—
Average Field Goals Made
6.8
41st
Average Field Goals Attempted
14.1
419th
Average 3-Point Field Goals Made
2.2
Tied-50th
Average 3-Point Field Goals Attempted
5.4
68th
Average Free Throws Made
4.3
Tied-36th
Average Free Throws Attempted
5.8
27th
Points Per Game
20.2
38th
Offensive Rebounds Per Game
2.4
28th
Assists Per Game
3.5
Tied-79th
Turnovers Per Game
3.2
11th
Offensive Rebound Percentage
0.3
—
Estimated Possessions
224.4
—
Estimated Possessions Per Game
17.3
—
Points Per Estimated Possession
1.2
—
Team Turnovers Per Game
0.0
—
Total Turnovers Per Game
3.2
—
3-Point Field Goal Percentage
41.4
50th
2-Point Field Goals Made
60.0
4th
2-Point Field Goals Attempted
113.0
19th
2-Point Field Goals Made per Game
4.6
—
2-Point Field Goals Attempted per Game
8.7
—
2-Point Field Goal Percentage
53.1
46th
Shooting Efficiency
0.57
—
Scoring Efficiency
1.437
—
Fieldgoals Made Per 48
10.4
1,632nd
Fieldgoals Attempted Per 48
21.4
1,920th
3-Point Fieldgoals Made Per 48
3.4
1,824th
3-Point Fieldgoals Attempted Per 48
8.2
2,832nd
Freethrows Made Per 48
6.6
1,392nd
Freethrows Attempted Per 48
8.9
1,056th
Points Scored Per 48
30.8
Tied-1,440th
Offensive Rebounds Per 48
3.6
Tied-1,200th
Assists Per 48
5.3
3,504th
Turnovers
4.9
Tied-528th
P/40
25.7
—
A/40
4.4
—
04 / EFFICIENCY, SHOOTING PROFILE, PER-36
Advanced metrics
True shooting %60.7%
Effective FG %56.0%
2-point FG %52.9%
3-point attempt rate38.3%
Free throw rate41.1%
Points per shot attempt1.43
% of points from 3s32.7%
Assist-to-turnover1.09
Points per 36 min23.1
Rebounds per 36 min8.5
Assists per 36 min4.0
Steals per 36 min1.14
Blocks per 36 min0.80
Turnovers per 36 min3.66
Stocks (STL + BLK) per game1.70
Pts + Reb + Ast per game31.1
Efficiency (EFF) per game20.8
Game Score per game (Hollinger)15.1
Minutes per game31.5
Calculated by BallersCulture from the supplied 2026-27 box-score totals using standard formulas (hover a tile to see the formula). Tracking-based metrics such as BPM, VORP, on/off and RAPTOR are not available from this data source.
05 / 13 GAMES IN 2026-27
Game log: Regular season
Date
Opp
Result
MIN
FG
FG%
3PT
3P%
FT
FT%
REB
AST
BLK
STL
PF
TO
PTS
Nov 14
@ SA
L 123-85
24
1-13
7.7
0-2
0.0
1-2
50.0
7
1
1
0
3
3
3
Nov 12
@ HOU
L 115-108
36
9-19
47.4
2-7
28.6
5-8
62.5
10
0
0
2
2
2
25
Nov 10
vs NO
W 138-87
27
8-10
80.0
4-4
100.0
3-4
75.0
7
4
0
1
3
2
23
Nov 8
vs ORL
W 126-119 OT
37
9-15
60.0
2-4
50.0
3-4
75.0
8
3
3
0
5
6
23
Nov 6
vs MIA
W 120-100
30
6-14
42.9
1-3
33.3
4-6
66.7
8
6
1
3
4
2
17
Nov 3
vs PHX
W 116-113
29
3-10
30.0
2-6
33.3
8-9
88.9
5
5
1
1
4
2
16
Nov 2
vs LAC
W 124-112
34
13-19
68.4
6-11
54.5
5-6
83.3
4
6
0
1
1
2
37
Oct 31
vs LAL
W 112-95
24
2-3
66.7
1-2
50.0
1-2
50.0
1
0
0
0
6
5
6
Oct 29
@ MIN
W 119-114
35
11-20
55.0
2-5
40.0
2-4
50.0
9
1
1
1
3
7
26
Oct 27
@ DEN
W 134-114
31
9-19
47.4
1-8
12.5
12-13
92.3
12
6
1
0
2
3
31
Oct 25
@ PHX
L 131-122
36
9-19
47.4
6-11
54.5
2-3
66.7
9
5
1
0
0
2
26
Oct 24
vs MEM
L 111-108
37
4-11
36.4
1-3
33.3
9-12
75.0
13
6
0
3
3
6
18
Oct 22
@ LAL
L 127-105
29
5-11
45.5
1-4
25.0
1-3
33.3
3
2
0
1
4
0
12
06 / 2026-27 HOME / AWAY, RESULTS, MONTHS AND OPPONENTS
Splits
split
Split
GP
MIN
FG
FG%
3PT
3P%
FT
FT%
OR
DR
REB
AST
BLK
STL
PF
TO
PTS
All Splits
13
31.5
6.8-14.1
48.6
2.2-5.4
41.4
4.3-5.8
73.7
2.4
5.0
7.4
3.5
0.7
1.0
3.1
3.2
20.2
Home
7
31.4
6.4-11.7
54.9
2.4-4.7
51.5
4.7-6.1
76.7
2.0
4.6
6.6
4.3
0.7
1.3
3.7
3.6
20.0
Road
6
31.7
7.3-16.8
43.6
2.0-6.2
32.4
3.8-5.5
69.7
2.8
5.5
8.3
2.5
0.7
0.7
2.3
2.8
20.5
vs. Division
5
30.6
6.4-12.4
51.6
3.2-6.8
47.1
3.4-4.6
73.9
2.2
2.2
4.4
3.6
0.4
0.6
3.0
2.2
19.4
vs. Conference
11
31.2
6.7-14.0
48.1
2.4-5.7
41.3
4.5-6.0
74.2
2.6
4.6
7.3
3.3
0.5
0.9
2.8
3.1
20.3
3+ Days Rest
1
29.0
5.0-11.0
45.5
1.0-4.0
25.0
1.0-3.0
33.3
2.0
1.0
3.0
2.0
0.0
1.0
4.0
0.0
12.0
Month
Split
GP
MIN
FG
FG%
3PT
3P%
FT
FT%
OR
DR
REB
AST
BLK
STL
PF
TO
PTS
October
6
32.0
6.7-13.8
48.2
2.0-5.5
36.4
4.5-6.2
73.0
3.3
4.5
7.8
3.3
0.5
0.8
3.0
3.8
19.8
November
7
31.1
7.0-14.3
49.0
2.4-5.3
45.9
4.1-5.6
74.4
1.6
5.4
7.0
3.6
0.9
1.1
3.1
2.7
20.6
Pre All-Star
13
31.5
6.8-14.1
48.6
2.2-5.4
41.4
4.3-5.8
73.7
2.4
5.0
7.4
3.5
0.7
1.0
3.1
3.2
20.2
Result
Split
GP
MIN
FG
FG%
3PT
3P%
FT
FT%
OR
DR
REB
AST
BLK
STL
PF
TO
PTS
Wins
8
31.0
7.6-13.8
55.5
2.4-5.4
44.2
4.8-6.0
79.2
1.6
5.1
6.8
3.9
0.9
0.9
3.5
3.6
22.4
Losses
5
32.4
5.6-14.6
38.4
2.0-5.4
37.0
3.6-5.6
64.3
3.6
4.8
8.4
2.8
0.4
1.2
2.4
2.6
16.8
Position
Split
GP
MIN
FG
FG%
3PT
3P%
FT
FT%
OR
DR
REB
AST
BLK
STL
PF
TO
PTS
As Starter
13
31.5
6.8-14.1
48.6
2.2-5.4
41.4
4.3-5.8
73.7
2.4
5.0
7.4
3.5
0.7
1.0
3.1
3.2
20.2
Day
Split
GP
MIN
FG
FG%
3PT
3P%
FT
FT%
OR
DR
REB
AST
BLK
STL
PF
TO
PTS
Monday
3
29.3
6.7-13.0
51.3
2.3-6.0
38.9
7.7-8.7
88.5
2.3
5.7
8.0
5.0
0.7
0.7
3.0
2.3
23.3
Wednesday
3
33.0
8.3-16.7
50.0
1.7-5.3
31.3
2.7-5.0
53.3
2.0
5.3
7.3
1.0
0.3
1.3
3.0
3.0
21.0
Thursday
1
30.0
6.0-14.0
42.9
1.0-3.0
33.3
4.0-6.0
66.7
1.0
7.0
8.0
6.0
1.0
3.0
4.0
2.0
17.0
Friday
3
28.3
2.3-9.0
25.9
0.7-2.3
28.6
3.7-5.3
68.8
3.0
4.0
7.0
2.3
0.3
1.0
4.0
4.7
9.0
Saturday
2
37.0
9.0-17.0
52.9
4.0-7.5
53.3
2.5-3.5
71.4
3.0
5.5
8.5
4.0
2.0
0.0
2.5
4.0
24.5
Sunday
1
34.0
13.0-19.0
68.4
6.0-11.0
54.5
5.0-6.0
83.3
2.0
2.0
4.0
6.0
0.0
1.0
1.0
2.0
37.0
Opponent
Split
GP
MIN
FG
FG%
3PT
3P%
FT
FT%
OR
DR
REB
AST
BLK
STL
PF
TO
PTS
Denver Nuggets
1
31.0
9.0-19.0
47.4
1.0-8.0
12.5
12.0-13.0
92.3
4.0
8.0
12.0
6.0
1.0
0.0
2.0
3.0
31.0
Houston Rockets
1
36.0
9.0-19.0
47.4
2.0-7.0
28.6
5.0-8.0
62.5
2.0
8.0
10.0
0.0
0.0
2.0
2.0
2.0
25.0
Los Angeles Clippers
1
34.0
13.0-19.0
68.4
6.0-11.0
54.5
5.0-6.0
83.3
2.0
2.0
4.0
6.0
0.0
1.0
1.0
2.0
37.0
Los Angeles Lakers
2
26.5
3.5-7.0
50.0
1.0-3.0
33.3
1.0-2.5
40.0
1.0
1.0
2.0
1.0
0.0
0.5
5.0
2.5
9.0
Memphis Grizzlies
1
37.0
4.0-11.0
36.4
1.0-3.0
33.3
9.0-12.0
75.0
7.0
6.0
13.0
6.0
0.0
3.0
3.0
6.0
18.0
Miami Heat
1
30.0
6.0-14.0
42.9
1.0-3.0
33.3
4.0-6.0
66.7
1.0
7.0
8.0
6.0
1.0
3.0
4.0
2.0
17.0
Minnesota Timberwolves
1
35.0
11.0-20.0
55.0
2.0-5.0
40.0
2.0-4.0
50.0
2.0
7.0
9.0
1.0
1.0
1.0
3.0
7.0
26.0
New Orleans Pelicans
1
27.0
8.0-10.0
80.0
4.0-4.0
100.0
3.0-4.0
75.0
1.0
6.0
7.0
4.0
0.0
1.0
3.0
2.0
23.0
Orlando Magic
1
37.0
9.0-15.0
60.0
2.0-4.0
50.0
3.0-4.0
75.0
1.0
7.0
8.0
3.0
3.0
0.0
5.0
6.0
23.0
Phoenix Suns
2
33.0
6.0-14.5
41.4
4.0-8.5
47.1
5.0-6.0
83.3
3.5
3.5
7.0
5.0
1.0
0.5
2.0
2.0
21.0
San Antonio Spurs
1
24.0
1.0-13.0
7.7
0.0-2.0
0.0
1.0-2.0
50.0
2.0
5.0
7.0
1.0
1.0
0.0
3.0
3.0
3.0
07 / SEASON-BY-SEASON HISTORY
Career statistics
Regular Season Averages
Season
Team
GP
GS
MIN
FG
FG%
3PT
3P%
FT
FT%
OR
DR
REB
AST
BLK
STL
PF
TO
PTS
2026-27
Golden State Warriors
13
13
31.5
6.8-14.1
48.6
2.2-5.4
41.4
4.3-5.8
73.7
2.4
5.0
7.4
3.5
0.7
1.0
3.1
3.2
20.2
Career
—
13
13
31.5
6.8-14.1
48.6
2.2-5.4
41.4
4.3-5.8
73.7
2.4
5.0
7.4
3.5
0.7
1.0
3.1
3.2
20.2
Regular Season Totals
Season
Team
FG
FG%
3PT
3P%
FT
FT%
OR
DR
REB
AST
BLK
STL
PF
TO
PTS
2026-27
Golden State Warriors
89-183
48.6
29-70
41.4
56-76
73.7
31
65
96
45
9
13
40
42
263
Career
—
89-183
48.6
29-70
41.4
56-76
73.7
31
65
96
45
9
13
40
42
263
Regular Season Misc Totals
Season
Team
DD2
TD3
DQ
EJECT
TECH
FLAG
AST/TO
STL/TO
SC-EFF
SH-EFF
2026-27
Golden State Warriors
3
0
1
0
3
0
1.1
0.3
1.437
0.57
Career
—
3
0
1
0
3
0
1.1
0.3
1.437
0.57
08 / SHOT CHART AND ZONE SHOOTING
Shot profile
Shot-location data is not connected. Add a BALLDONTLIE GOAT-tier NBA API key in NBA Players → Settings to enable shot charts and zone shooting.
LATEST UPDATELendeborg amassed 25 points (9-19 FG, 2-7 3Pt, 5-8 FT), 10 rebounds and two steals over 36 minutes in Wednesday's 115-108 loss to the Rockets.
This was Lendeborg's third straight 20-plus-point performance and the third double-double of his career. The rookie ranks inside the top-50 of all players on the season with averages of 21.7 points, 7.4 rebounds, 3.7 assists, 2.4 triples, 1.1 steals and 0.7 swats per contest on 51.8 percent shooting from the field and 74.3 percent at the line.


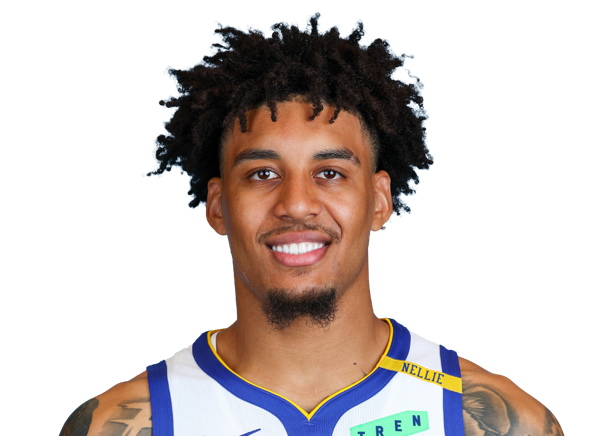

 Al HorfordC #20
 Alex TooheyF #22
 Brandin PodziemskiG #2
 Brandon WilliamsG #12
 Charles BasseyC #28
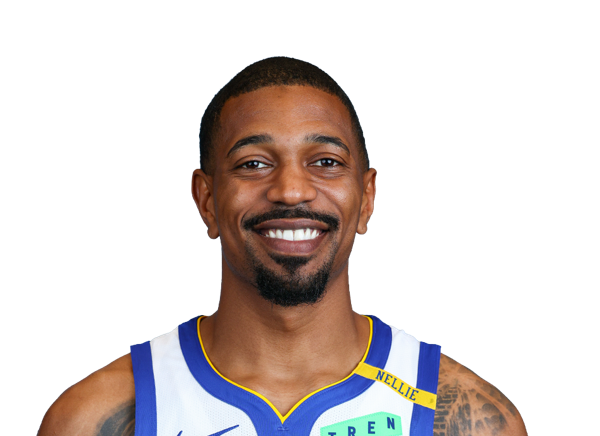 De’Anthony MeltonG #8
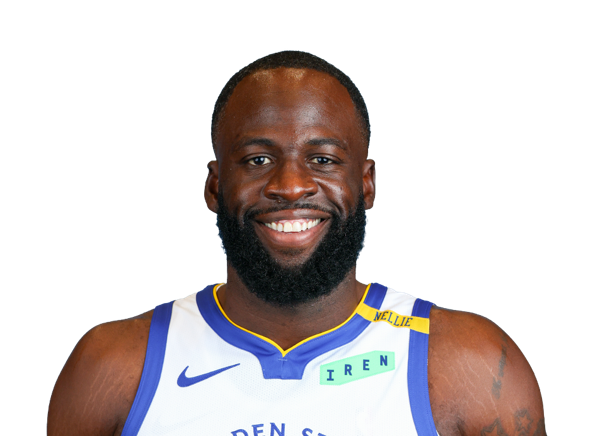 Draymond GreenF #23
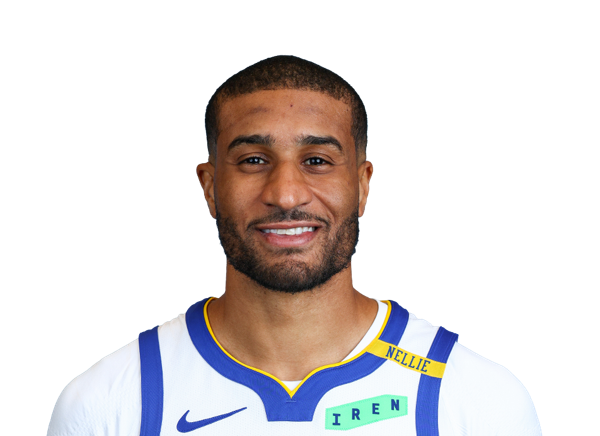 Gary Payton IIG
 Georges NiangF #32
 Graham IkeF #45
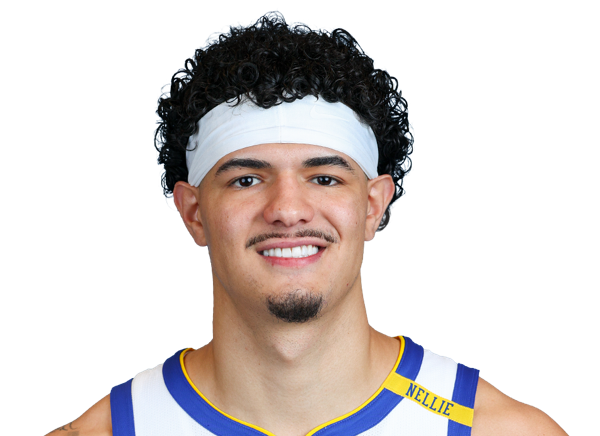 Gui SantosF #15
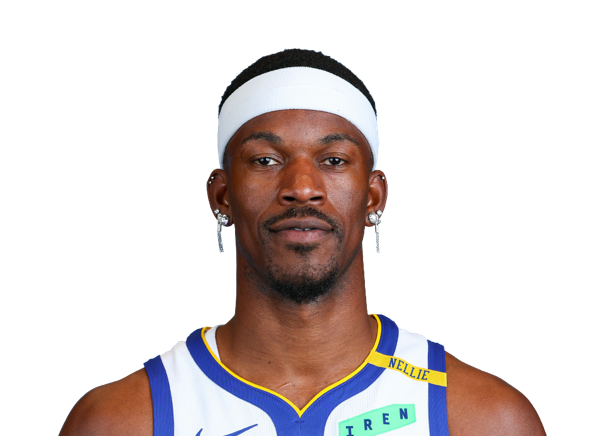 Jimmy Butler IIIF #10
 Kristaps PorzingisC #7
 Lajae JonesG
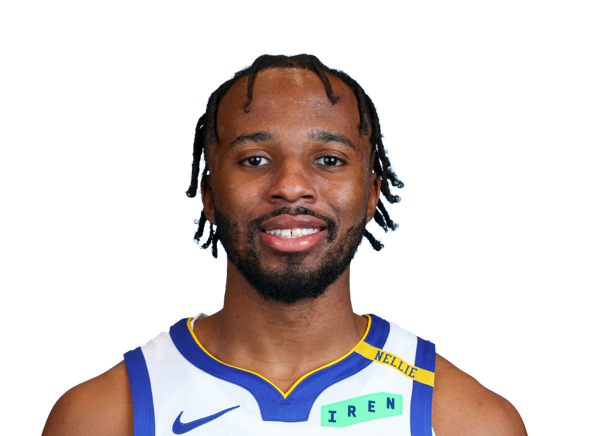 LJ CryerG #18
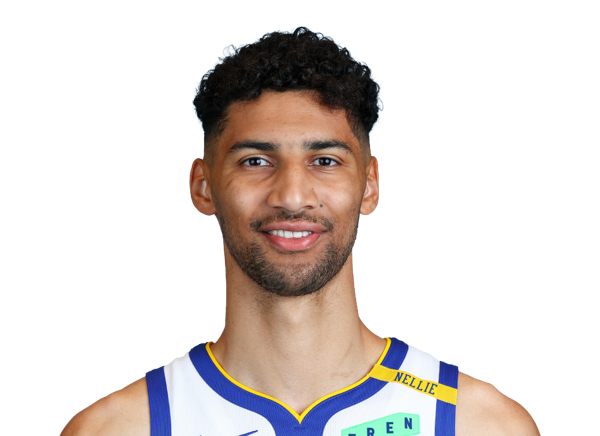 Malevy LeonsF #33
 Miles KellyG #26
 Moses MoodyG #4
 Nate WilliamsG #19
 Omer YurtsevenC #77
 Seth CurryG #31
 Stephen CurryG #30
 Tyler BurtonF
 Will RichardG #3