Click a season to open this player’s full game log, splits and advanced stats for that year; click a team to open its page. A dash means no NBA games were recorded.
03 / EVERY CATEGORY THE PROVIDER REPORTS
Full statistical breakdown
Regular season 2026-27
Defensive
Metric
Total
NBA rank
Blocks
1
Tied-289th
Defensive Rebounds
2
Tied-405th
Steals
1
Tied-360th
Defensive Rebound Rate
0.0
—
Defensive Rebounds Per Game
0.4
—
Blocks Per Game
0.2
—
Steals Per Game
0.2
—
Defensive Rebounds Per 48
3.3
2,777th
Blocks Per 48
1.7
1,981st
Steals Per 48
1.7
2,468th
General
Metric
Total
NBA rank
Disqualifications
0
Tied-21st
Flagrant Fouls
0
Tied-22nd
Fouls
1
Tied-421st
Player Efficiency Rating
7.47
—
Rebound Rate
0.0
—
Ejections
0
Tied-7th
Technical Fouls
0
Tied-101st
Rebounds
3
—
Value Over Replacement Player
-1.4
—
Minutes
29
Tied-7th
Minutes Per Game
5.8
—
Rating
2.9
Tied-427th
Plus-Minus
-10
Tied-1st
Rebounds Per Game
0.6
—
Fouls Per Game
0.2
—
Flagrant Fouls Per Game
0.0
—
Technical Fouls Per Game
0.0
—
Ejections Per Game
0.0
—
Disqualifications Per Game
0.0
—
Assist To Turnover Ratio
1.5
—
Steal To Foul Ratio
1.0
—
Block To Foul Ratio
1.0
—
Team Rebounds Per Game
0.0
—
Rebounds
3
—
Total Technical Fouls
0
—
Assist To Turnover Ratio
0.0
—
Steal To Turnover Ratio
0.5
—
Rebounds Per 48 Minutes
5.0
—
Fouls Per 48 Minutes
1.7
2,886th
Flagrant Fouls Per 48 Minutes
0.0
150th
Technical Fouls Per 48 Minutes
0.0
692nd
Ejections Per 48 Minutes
0.0
48th
Disqualifications Per 48 Minutes
0.0
144th
R/40
4.1
—
Games Played
5
5th
Games Started
0
Tied-257th
Double Double
0
Tied-119th
Triple Double
0
Tied-12th
Offensive
Metric
Total
NBA rank
Assists
3
Tied-362nd
Effective Field Goal Percentage
42.9
—
Field Goals
3/7
—
Field Goals Attempted
7
Tied-405th
Field Goals Made
3
Tied-405th
Field Goal Percentage
42.9
—
Free Throws
1/2
—
Free Throw Percentage
50.0
—
Free Throws Attempted
2
Tied-370th
Free Throws Made
1
Tied-389th
Offensive Rebounds
1
Tied-386th
Points
7
Tied-415th
Turnovers
2
Tied-365th
3-Point Field Goal Percentage
0.0
—
3-Point Field Goals Attempted
1
Tied-395th
3-Point Field Goals Made
0
Tied-379th
True Shooting Percentage
44.4
—
Total Turnovers
2
—
Assist Ratio
23.3
—
Points in the Paint
0
Tied-1st
Offensive Rebound Rate
0.0
—
Turnover Ratio
15.5
—
Brick Index
0.00
—
Usage Rate
0.0
—
Average Field Goals Made
0.6
—
Average Field Goals Attempted
1.4
—
Average 3-Point Field Goals Made
0.0
—
Average 3-Point Field Goals Attempted
0.2
—
Average Free Throws Made
0.2
—
Average Free Throws Attempted
0.4
—
Points Per Game
1.4
—
Offensive Rebounds Per Game
0.2
—
Assists Per Game
0.6
—
Turnovers Per Game
0.4
—
Offensive Rebound Percentage
0.3
—
Estimated Possessions
8.8
—
Estimated Possessions Per Game
1.8
—
Points Per Estimated Possession
0.8
—
Team Turnovers Per Game
0.0
—
Total Turnovers Per Game
0.4
—
3-Point Field Goal Percentage
0.0
—
2-Point Field Goals Made
3.0
Tied-26th
2-Point Field Goals Attempted
6.0
Tied-10th
2-Point Field Goals Made per Game
0.6
—
2-Point Field Goals Attempted per Game
1.2
—
2-Point Field Goal Percentage
50.0
—
Shooting Efficiency
0.43
—
Scoring Efficiency
1.000
—
Fieldgoals Made Per 48
5.0
2,777th
Fieldgoals Attempted Per 48
11.6
2,777th
3-Point Fieldgoals Made Per 48
0.0
2,598th
3-Point Fieldgoals Attempted Per 48
1.7
2,708th
Freethrows Made Per 48
1.7
2,667th
Freethrows Attempted Per 48
3.3
2,537th
Points Scored Per 48
11.6
2,845th
Offensive Rebounds Per 48
1.7
2,646th
Assists Per 48
5.0
2,482nd
Turnovers
3.3
2,502nd
P/40
9.7
—
A/40
4.1
—
04 / EFFICIENCY, SHOOTING PROFILE, PER-36
Advanced metrics
True shooting %44.4%
Effective FG %42.9%
2-point FG %50.0%
3-point attempt rate14.3%
Free throw rate28.6%
Points per shot attempt1.00
% of points from 3s0.0%
Assist-to-turnover1.50
Points per 36 min8.7
Rebounds per 36 min3.7
Assists per 36 min3.7
Steals per 36 min1.24
Blocks per 36 min1.24
Turnovers per 36 min2.48
Stocks (STL + BLK) per game0.40
Pts + Reb + Ast per game2.6
Efficiency (EFF) per game1.6
Game Score per game (Hollinger)1.1
Minutes per game5.8
Calculated by BallersCulture from the supplied 2026-27 box-score totals using standard formulas (hover a tile to see the formula). Tracking-based metrics such as BPM, VORP, on/off and RAPTOR are not available from this data source.
05 / 5 GAMES IN 2026-27
Game log: Regular season
Date
Opp
Result
MIN
FG
FG%
3PT
3P%
FT
FT%
REB
AST
BLK
STL
PF
TO
PTS
Nov 14
vs MEM
L 142-111
4
0-0
0.0
0-0
0.0
1-2
50.0
0
0
0
0
0
1
1
Nov 12
vs BKN
L 145-111
7
1-2
50.0
0-1
0.0
0-0
0.0
1
0
0
0
0
0
2
Nov 10
@ GS
L 138-87
12
1-3
33.3
0-0
0.0
0-0
0.0
2
3
0
1
1
0
2
Nov 9
@ LAC
L 139-123
3
1-1
100.0
0-0
0.0
0-0
0.0
0
0
0
0
0
0
2
Nov 1
vs ATL
W 121-99
3
0-1
0.0
0-0
0.0
0-0
0.0
0
0
1
0
0
1
0
06 / 2026-27 HOME / AWAY, RESULTS, MONTHS AND OPPONENTS
Splits
split
Split
GP
MIN
FG
FG%
3PT
3P%
FT
FT%
OR
DR
REB
AST
BLK
STL
PF
TO
PTS
All Splits
5
5.8
0.6-1.4
42.9
0.0-0.2
0.0
0.2-0.4
50.0
0.2
0.4
0.6
0.6
0.2
0.2
0.2
0.4
1.4
Home
3
4.7
0.3-1.0
33.3
0.0-0.3
0.0
0.3-0.7
50.0
0.0
0.3
0.3
0.0
0.3
0.0
0.0
0.7
1.0
Road
2
7.5
1.0-2.0
50.0
0.0-0.0
0.0
0.0-0.0
0.0
0.5
0.5
1.0
1.5
0.0
0.5
0.5
0.0
2.0
vs. Division
1
4.0
0.0-0.0
0.0
0.0-0.0
0.0
1.0-2.0
50.0
0.0
0.0
0.0
0.0
0.0
0.0
0.0
1.0
1.0
vs. Conference
3
6.7
0.7-1.3
50.0
0.0-0.0
0.0
0.3-0.7
50.0
0.3
0.3
0.7
1.0
0.0
0.3
0.3
0.3
1.7
3+ Days Rest
2
3.0
0.5-1.0
50.0
0.0-0.0
0.0
0.0-0.0
0.0
0.0
0.0
0.0
0.0
0.5
0.0
0.0
0.5
1.0
Month
Split
GP
MIN
FG
FG%
3PT
3P%
FT
FT%
OR
DR
REB
AST
BLK
STL
PF
TO
PTS
October
1
3.0
0.0-1.0
0.0
0.0-0.0
0.0
0.0-0.0
0.0
0.0
0.0
0.0
0.0
1.0
0.0
0.0
1.0
0.0
November
4
6.5
0.8-1.5
50.0
0.0-0.3
0.0
0.3-0.5
50.0
0.3
0.5
0.8
0.8
0.0
0.3
0.3
0.3
1.8
Pre All-Star
5
5.8
0.6-1.4
42.9
0.0-0.2
0.0
0.2-0.4
50.0
0.2
0.4
0.6
0.6
0.2
0.2
0.2
0.4
1.4
Result
Split
GP
MIN
FG
FG%
3PT
3P%
FT
FT%
OR
DR
REB
AST
BLK
STL
PF
TO
PTS
Wins
1
3.0
0.0-1.0
0.0
0.0-0.0
0.0
0.0-0.0
0.0
0.0
0.0
0.0
0.0
1.0
0.0
0.0
1.0
0.0
Losses
4
6.5
0.8-1.5
50.0
0.0-0.3
0.0
0.3-0.5
50.0
0.3
0.5
0.8
0.8
0.0
0.3
0.3
0.3
1.8
Day
Split
GP
MIN
FG
FG%
3PT
3P%
FT
FT%
OR
DR
REB
AST
BLK
STL
PF
TO
PTS
Monday
1
12.0
1.0-3.0
33.3
0.0-0.0
0.0
0.0-0.0
0.0
1.0
1.0
2.0
3.0
0.0
1.0
1.0
0.0
2.0
Wednesday
1
7.0
1.0-2.0
50.0
0.0-1.0
0.0
0.0-0.0
0.0
0.0
1.0
1.0
0.0
0.0
0.0
0.0
0.0
2.0
Friday
1
4.0
0.0-0.0
0.0
0.0-0.0
0.0
1.0-2.0
50.0
0.0
0.0
0.0
0.0
0.0
0.0
0.0
1.0
1.0
Saturday
1
3.0
0.0-1.0
0.0
0.0-0.0
0.0
0.0-0.0
0.0
0.0
0.0
0.0
0.0
1.0
0.0
0.0
1.0
0.0
Sunday
1
3.0
1.0-1.0
100.0
0.0-0.0
0.0
0.0-0.0
0.0
0.0
0.0
0.0
0.0
0.0
0.0
0.0
0.0
2.0
Opponent
Split
GP
MIN
FG
FG%
3PT
3P%
FT
FT%
OR
DR
REB
AST
BLK
STL
PF
TO
PTS
Atlanta Hawks
1
3.0
0.0-1.0
0.0
0.0-0.0
0.0
0.0-0.0
0.0
0.0
0.0
0.0
0.0
1.0
0.0
0.0
1.0
0.0
Brooklyn Nets
1
7.0
1.0-2.0
50.0
0.0-1.0
0.0
0.0-0.0
0.0
0.0
1.0
1.0
0.0
0.0
0.0
0.0
0.0
2.0
Golden State Warriors
1
12.0
1.0-3.0
33.3
0.0-0.0
0.0
0.0-0.0
0.0
1.0
1.0
2.0
3.0
0.0
1.0
1.0
0.0
2.0
Los Angeles Clippers
1
3.0
1.0-1.0
100.0
0.0-0.0
0.0
0.0-0.0
0.0
0.0
0.0
0.0
0.0
0.0
0.0
0.0
0.0
2.0
Memphis Grizzlies
1
4.0
0.0-0.0
0.0
0.0-0.0
0.0
1.0-2.0
50.0
0.0
0.0
0.0
0.0
0.0
0.0
0.0
1.0
1.0
07 / SEASON-BY-SEASON HISTORY
Career statistics
Regular Season Averages
Season
Team
GP
GS
MIN
FG
FG%
3PT
3P%
FT
FT%
OR
DR
REB
AST
BLK
STL
PF
TO
PTS
2024-25
Milwaukee Bucks
7
0
6.3
1.1-2.7
42.1
0.4-0.7
60.0
0.1-0.3
50.0
0.0
1.0
1.0
1.0
0.0
0.1
0.0
0.6
2.9
2024-25
Washington Wizards
22
11
27.0
3.4-8.8
38.1
1.0-3.9
24.7
1.4-1.6
88.6
0.4
2.0
2.4
3.1
0.1
0.5
2.3
1.4
9.1
2024-25
2024 25 Totals
29
11
22.0
2.8-7.3
38.5
0.8-3.1
26.7
1.1-1.3
86.5
0.3
1.8
2.0
2.6
0.1
0.4
1.7
1.2
7.6
2025-26
Washington Wizards
25
0
8.6
1.1-3.3
32.5
0.3-1.0
28.0
0.4-0.5
75.0
0.3
0.9
1.2
0.9
0.0
0.3
0.6
0.7
2.8
2025-26
Dallas Mavericks
23
0
10.4
1.3-4.0
32.3
0.2-1.4
15.6
1.1-1.2
89.3
0.3
0.8
1.0
1.1
0.1
0.2
0.7
0.5
3.9
2025-26
2025 26 Totals
48
0
9.4
1.2-3.7
32.4
0.3-1.2
21.1
0.7-0.8
85.0
0.3
0.9
1.1
1.0
0.1
0.2
0.6
0.6
3.3
2026-27
New Orleans Pelicans
5
0
5.8
0.6-1.4
42.9
0.0-0.2
0.0
0.2-0.4
50.0
0.2
0.4
0.6
0.6
0.2
0.2
0.2
0.4
1.4
Career
—
82
11
13.7
1.7-4.8
35.9
0.4-1.8
24.3
0.8-1.0
84.8
0.3
1.1
1.4
1.5
0.1
0.3
1.0
0.8
4.7
Regular Season Totals
Season
Team
FG
FG%
3PT
3P%
FT
FT%
OR
DR
REB
AST
BLK
STL
PF
TO
PTS
2024-25
Milwaukee Bucks
8-19
42.1
3-5
60.0
1-2
50.0
0
7
7
7
0
1
0
4
20
2024-25
Washington Wizards
74-194
38.1
21-85
24.7
31-35
88.6
8
44
52
69
3
11
50
31
200
2024-25
2024 25 Totals
82-213
38.5
24-90
26.7
32-37
86.5
8
51
59
76
3
12
50
35
220
2025-26
Washington Wizards
27-83
32.5
7-25
28.0
9-12
75.0
8
23
31
22
0
7
15
18
70
2025-26
Dallas Mavericks
30-93
32.3
5-32
15.6
25-28
89.3
6
18
24
25
3
4
15
12
90
2025-26
2025 26 Totals
57-176
32.4
12-57
21.1
34-40
85.0
14
41
55
47
3
11
30
30
160
2026-27
New Orleans Pelicans
3-7
42.9
0-1
0.0
1-2
50.0
1
2
3
3
1
1
1
2
7
Career
—
142-396
35.9
36-148
24.3
67-79
84.8
23
94
117
126
7
24
81
67
387
Regular Season Misc Totals
Season
Team
DD2
TD3
DQ
EJECT
TECH
FLAG
AST/TO
STL/TO
SC-EFF
SH-EFF
2024-25
Milwaukee Bucks
0
0
0
0
0
0
1.8
0.3
1.053
0.50
2024-25
Washington Wizards
0
0
0
0
0
0
2.2
0.4
1.031
0.44
2024-25
2024 25 Totals
0
0
0
0
0
0
2.2
0.3
1.033
0.44
2025-26
Washington Wizards
0
0
0
0
0
0
1.2
0.4
0.843
0.37
2025-26
Dallas Mavericks
0
0
0
0
0
0
2.1
0.3
0.968
0.35
2025-26
2025 26 Totals
0
0
0
0
0
0
1.6
0.4
0.909
0.36
2026-27
New Orleans Pelicans
0
0
0
0
0
0
1.5
0.5
1.000
0.43
Career
—
0
0
0
0
0
0
1.9
0.4
0.977
0.40
Scoring, rebounding and assist trend
08 / SHOT CHART AND ZONE SHOOTING
Shot profile
Shot-location data is not connected. Add a BALLDONTLIE GOAT-tier NBA API key in NBA Players → Settings to enable shot charts and zone shooting.
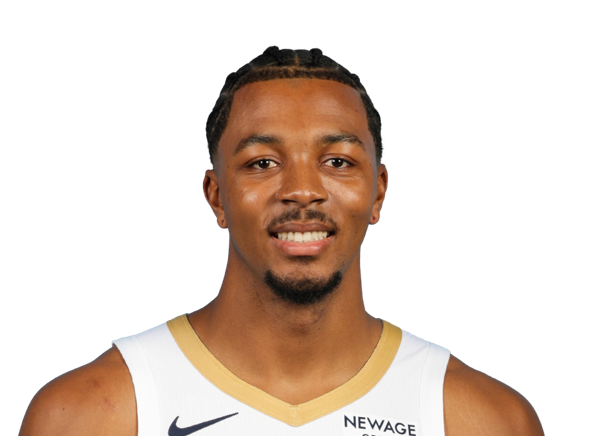
LATEST UPDATEThe Pelicans recalled Johnson from the G League's Laketown Squadron on Saturday.
After being assigned to the G League earlier in the day, Johnson will now rejoin the parent club ahead of Saturday's game against Denver. The 21-year-old has averaged just 6.5 minutes over New Orleans' last four games and will continue to have limited opportunities at the NBA level.


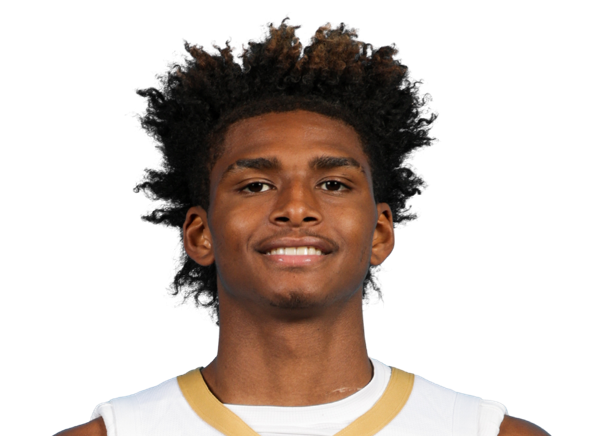

 Bennedict MathurinG #24
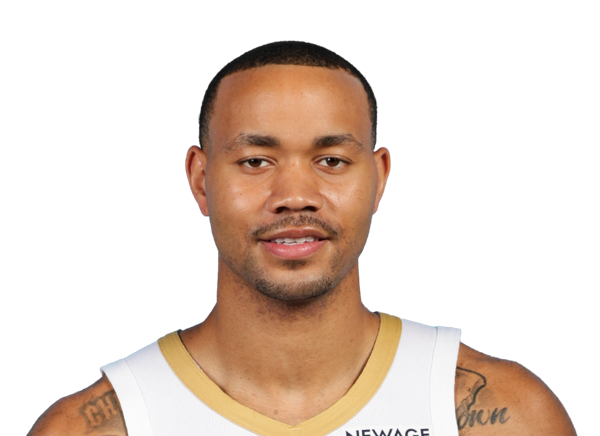 Bryce McGowensG #11
 Christian KolokoC #35
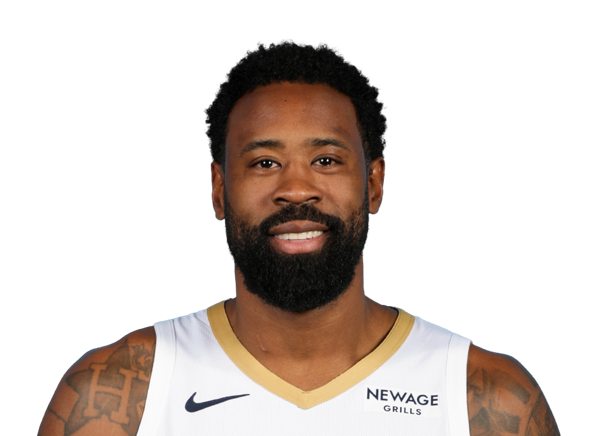 DeAndre JordanC #6
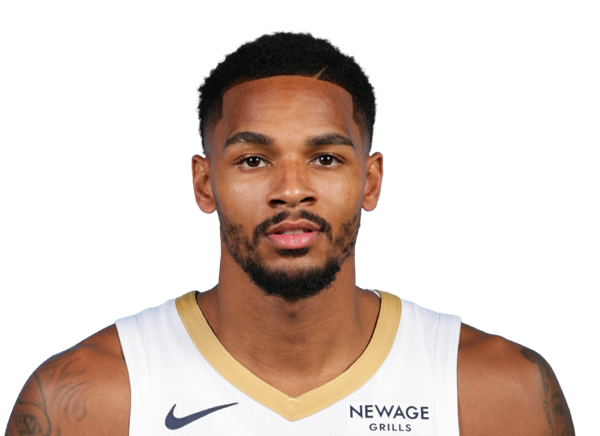 Dejounte MurrayG #5
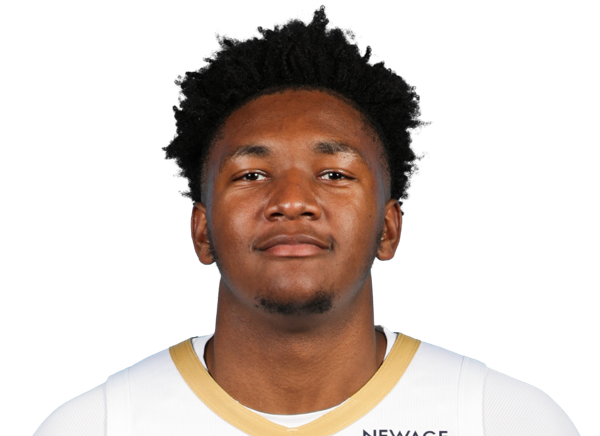 Derik QueenC #22
 Herbert JonesF #2
 Hunter DickinsonC #4
 Jalon MooreF
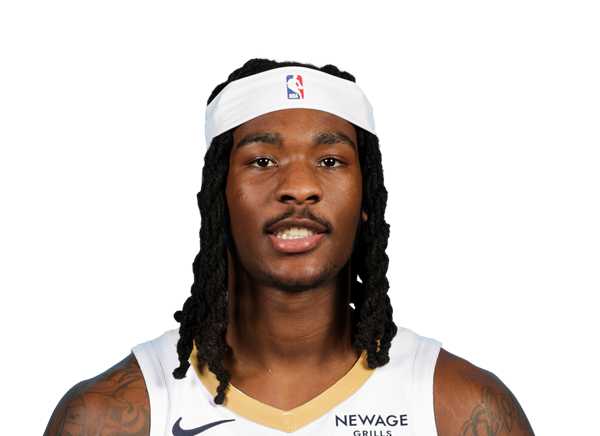 Jaron Pierre Jr.G #10
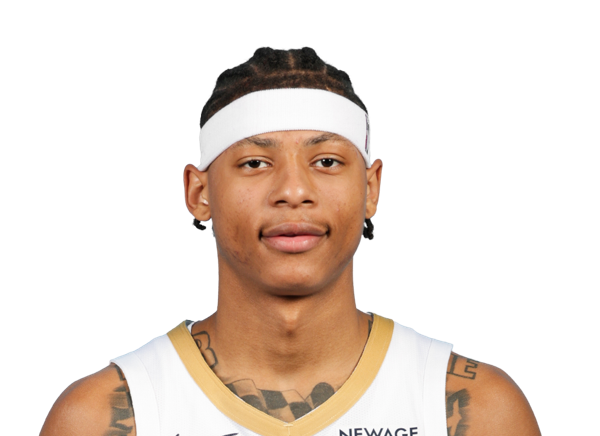 Jeremiah FearsG
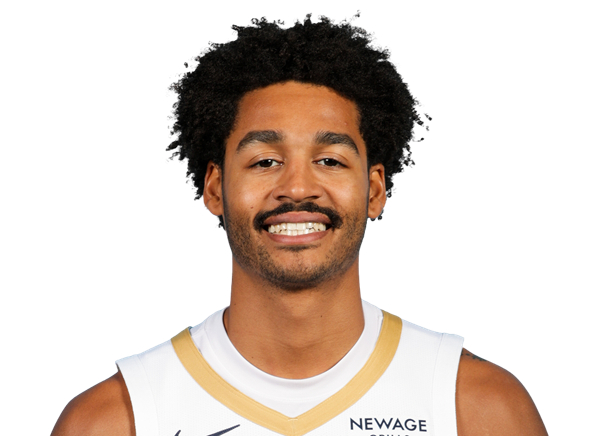 Jordan PooleG #3
 Josh OduroC #13
 Julian ReeseF #13
 Karlo MatkovicF #17
 Malik DiaF #8
 Saddiq BeyF #41
 Taj GibsonF
 Trendon WatfordF #9
 Trey Murphy IIIF #25
 Yves MissiC #21
 Zion WilliamsonF #1