Click a season to open this player’s full game log, splits and advanced stats for that year; click a team to open its page. A dash means no NBA games were recorded.
03 / EVERY CATEGORY THE PROVIDER REPORTS
Full statistical breakdown
Regular season 2026-27
Defensive
Metric
Total
NBA rank
Blocks
5
Tied-138th
Defensive Rebounds
34
Tied-153rd
Steals
14
Tied-62nd
Defensive Rebound Rate
0.0
—
Defensive Rebounds Per Game
3.8
—
Blocks Per Game
0.6
—
Steals Per Game
1.6
—
Defensive Rebounds Per 48
5.8
2,448th
Blocks Per 48
0.9
2,208th
Steals Per 48
2.4
992nd
General
Metric
Total
NBA rank
Disqualifications
0
Tied-22nd
Flagrant Fouls
0
Tied-24th
Fouls
21
Tied-206th
Player Efficiency Rating
13.91
—
Rebound Rate
0.0
—
Ejections
0
Tied-7th
Technical Fouls
1
Tied-31st
Rebounds
41
—
Value Over Replacement Player
0.0
—
Minutes
282
Tied-3rd
Minutes Per Game
31.3
—
Rating
25.6
Tied-83rd
Plus-Minus
-74
Tied-1st
Rebounds Per Game
4.6
—
Fouls Per Game
2.3
—
Flagrant Fouls Per Game
0.0
—
Technical Fouls Per Game
0.1
—
Ejections Per Game
0.0
—
Disqualifications Per Game
0.0
—
Assist To Turnover Ratio
1.9
—
Steal To Foul Ratio
0.7
—
Block To Foul Ratio
0.2
—
Team Rebounds Per Game
0.0
—
Rebounds
41
—
Total Technical Fouls
1
—
Assist To Turnover Ratio
0.0
—
Steal To Turnover Ratio
0.7
—
Rebounds Per 48 Minutes
7.0
—
Fouls Per 48 Minutes
3.6
3,296th
Flagrant Fouls Per 48 Minutes
0.0
384th
Technical Fouls Per 48 Minutes
0.2
496th
Ejections Per 48 Minutes
0.0
112th
Disqualifications Per 48 Minutes
0.0
352nd
R/40
5.8
—
Games Played
9
9th
Games Started
9
Tied-123rd
Double Double
0
Tied-121st
Triple Double
0
Tied-13th
Offensive
Metric
Total
NBA rank
Assists
40
Tied-91st
Effective Field Goal Percentage
47.1
—
Field Goals
44/102
—
Field Goals Attempted
102
Tied-143rd
Field Goals Made
44
Tied-151st
Field Goal Percentage
43.1
—
Free Throws
25/27
—
Free Throw Percentage
92.6
—
Free Throws Attempted
27
Tied-132nd
Free Throws Made
25
Tied-108th
Offensive Rebounds
7
Tied-236th
Points
121
Tied-156th
Turnovers
21
Tied-98th
3-Point Field Goal Percentage
29.6
—
3-Point Field Goals Attempted
27
Tied-224th
3-Point Field Goals Made
8
Tied-232nd
True Shooting Percentage
53.1
—
Total Turnovers
21
—
Assist Ratio
22.9
—
Points in the Paint
0
Tied-1st
Offensive Rebound Rate
0.0
—
Turnover Ratio
12.0
—
Brick Index
0.00
—
Usage Rate
0.0
—
Average Field Goals Made
4.9
—
Average Field Goals Attempted
11.3
—
Average 3-Point Field Goals Made
0.9
—
Average 3-Point Field Goals Attempted
3.0
—
Average Free Throws Made
2.8
70th
Average Free Throws Attempted
3.0
—
Points Per Game
13.4
—
Offensive Rebounds Per Game
0.8
—
Assists Per Game
4.4
—
Turnovers Per Game
2.3
—
Offensive Rebound Percentage
0.1
—
Estimated Possessions
126.8
—
Estimated Possessions Per Game
14.1
—
Points Per Estimated Possession
1.0
—
Team Turnovers Per Game
0.0
—
Total Turnovers Per Game
2.3
—
3-Point Field Goal Percentage
29.6
—
2-Point Field Goals Made
36.0
81st
2-Point Field Goals Attempted
75.0
81st
2-Point Field Goals Made per Game
4.0
—
2-Point Field Goals Attempted per Game
8.3
—
2-Point Field Goal Percentage
48.0
1st
Shooting Efficiency
0.47
—
Scoring Efficiency
1.186
—
Fieldgoals Made Per 48
7.5
2,416th
Fieldgoals Attempted Per 48
17.4
2,288th
3-Point Fieldgoals Made Per 48
1.4
3,712th
3-Point Fieldgoals Attempted Per 48
4.6
3,584th
Freethrows Made Per 48
4.3
1,728th
Freethrows Attempted Per 48
4.6
2,112th
Points Scored Per 48
20.6
2,496th
Offensive Rebounds Per 48
1.2
3,776th
Assists Per 48
6.8
1,456th
Turnovers
3.6
1,568th
P/40
17.2
—
A/40
5.7
—
04 / EFFICIENCY, SHOOTING PROFILE, PER-36
Advanced metrics
True shooting %53.1%
Effective FG %47.3%
2-point FG %48.2%
3-point attempt rate26.5%
Free throw rate26.5%
Points per shot attempt1.19
% of points from 3s20.1%
Assist-to-turnover1.91
Points per 36 min15.4
Rebounds per 36 min5.3
Assists per 36 min5.1
Steals per 36 min1.84
Blocks per 36 min0.69
Turnovers per 36 min2.65
Stocks (STL + BLK) per game2.20
Pts + Reb + Ast per game22.4
Efficiency (EFF) per game15.7
Game Score per game (Hollinger)11.0
Minutes per game31.3
Calculated by BallersCulture from the supplied 2026-27 box-score totals using standard formulas (hover a tile to see the formula). Tracking-based metrics such as BPM, VORP, on/off and RAPTOR are not available from this data source.
05 / 9 GAMES IN 2026-27
Game log: Regular season
Date
Opp
Result
MIN
FG
FG%
3PT
3P%
FT
FT%
REB
AST
BLK
STL
PF
TO
PTS
Nov 12
vs BKN
L 145-111
28
2-6
33.3
1-3
33.3
0-1
0.0
2
4
0
1
1
2
5
Nov 10
@ GS
L 138-87
18
5-10
50.0
2-3
66.7
0-0
0.0
3
1
0
0
5
1
12
Nov 9
@ LAC
L 139-123
28
1-6
16.7
0-1
0.0
4-4
100.0
3
3
0
0
3
1
6
Nov 7
vs MIN
L 115-109
35
3-11
27.3
1-2
50.0
0-0
0.0
2
4
1
1
3
2
7
Nov 5
vs UTAH
W 120-113 OT
45
4-7
57.1
1-3
33.3
11-11
100.0
8
4
0
4
2
4
20
Oct 29
vs DEN
L 104-91
30
4-11
36.4
0-2
0.0
2-2
100.0
8
5
0
1
1
2
10
Oct 25
@ DEN
L 141-135 OT
35
9-18
50.0
1-6
16.7
3-4
75.0
6
6
1
2
2
2
22
Oct 24
@ UTAH
L 120-119
30
7-15
46.7
0-2
0.0
2-2
100.0
6
6
0
3
2
3
16
Oct 22
vs IND
L 123-120
34
9-18
50.0
2-5
40.0
3-3
100.0
3
7
3
2
2
4
23
06 / 2026-27 HOME / AWAY, RESULTS, MONTHS AND OPPONENTS
Splits
split
Split
GP
MIN
FG
FG%
3PT
3P%
FT
FT%
OR
DR
REB
AST
BLK
STL
PF
TO
PTS
All Splits
9
31.3
4.9-11.3
43.1
0.9-3.0
29.6
2.8-3.0
92.6
0.8
3.8
4.6
4.4
0.6
1.6
2.3
2.3
13.4
Home
5
34.4
4.4-10.6
41.5
1.0-3.0
33.3
3.2-3.4
94.1
0.6
4.0
4.6
4.8
0.8
1.8
1.8
2.8
13.0
Road
4
27.8
5.5-12.3
44.9
0.8-3.0
25.0
2.3-2.5
90.0
1.0
3.5
4.5
4.0
0.3
1.3
3.0
1.8
14.0
vs. Conference
7
31.4
4.7-11.1
42.3
0.7-2.7
26.3
3.1-3.3
95.7
0.7
4.4
5.1
4.1
0.3
1.6
2.6
2.1
13.3
3+ Days Rest
3
36.3
5.7-12.0
47.2
1.0-3.3
30.0
5.3-5.3
100.0
1.0
5.3
6.3
5.3
1.0
2.3
1.7
3.3
17.7
Month
Split
GP
MIN
FG
FG%
3PT
3P%
FT
FT%
OR
DR
REB
AST
BLK
STL
PF
TO
PTS
October
4
32.3
7.3-15.5
46.8
0.8-3.8
20.0
2.5-2.8
90.9
1.3
4.5
5.8
6.0
1.0
2.0
1.8
2.8
17.8
November
5
30.6
3.0-8.0
37.5
1.0-2.4
41.7
3.0-3.2
93.8
0.4
3.2
3.6
3.2
0.2
1.2
2.8
2.0
10.0
Pre All-Star
9
31.3
4.9-11.3
43.1
0.9-3.0
29.6
2.8-3.0
92.6
0.8
3.8
4.6
4.4
0.6
1.6
2.3
2.3
13.4
Result
Split
GP
MIN
FG
FG%
3PT
3P%
FT
FT%
OR
DR
REB
AST
BLK
STL
PF
TO
PTS
Wins
1
45.0
4.0-7.0
57.1
1.0-3.0
33.3
11.0-11.0
100.0
0.0
8.0
8.0
4.0
0.0
4.0
2.0
4.0
20.0
Losses
8
29.8
5.0-11.9
42.1
0.9-3.0
29.2
1.8-2.0
87.5
0.9
3.3
4.1
4.5
0.6
1.3
2.4
2.1
12.6
Position
Split
GP
MIN
FG
FG%
3PT
3P%
FT
FT%
OR
DR
REB
AST
BLK
STL
PF
TO
PTS
As Starter
9
31.3
4.9-11.3
43.1
0.9-3.0
29.6
2.8-3.0
92.6
0.8
3.8
4.6
4.4
0.6
1.6
2.3
2.3
13.4
Day
Split
GP
MIN
FG
FG%
3PT
3P%
FT
FT%
OR
DR
REB
AST
BLK
STL
PF
TO
PTS
Monday
1
18.0
5.0-10.0
50.0
2.0-3.0
66.7
0.0-0.0
0.0
0.0
3.0
3.0
1.0
0.0
0.0
5.0
1.0
12.0
Wednesday
4
34.3
4.8-10.5
45.2
1.0-3.3
30.8
4.0-4.3
94.1
0.8
4.5
5.3
5.0
0.8
2.0
1.5
3.0
14.5
Friday
2
32.5
5.0-13.0
38.5
0.5-2.0
25.0
1.0-1.0
100.0
0.5
3.5
4.0
5.0
0.5
2.0
2.5
2.5
11.5
Saturday
1
35.0
9.0-18.0
50.0
1.0-6.0
16.7
3.0-4.0
75.0
1.0
5.0
6.0
6.0
1.0
2.0
2.0
2.0
22.0
Sunday
1
28.0
1.0-6.0
16.7
0.0-1.0
0.0
4.0-4.0
100.0
2.0
1.0
3.0
3.0
0.0
0.0
3.0
1.0
6.0
Opponent
Split
GP
MIN
FG
FG%
3PT
3P%
FT
FT%
OR
DR
REB
AST
BLK
STL
PF
TO
PTS
Brooklyn Nets
1
28.0
2.0-6.0
33.3
1.0-3.0
33.3
0.0-1.0
0.0
0.0
2.0
2.0
4.0
0.0
1.0
1.0
2.0
5.0
Denver Nuggets
2
32.5
6.5-14.5
44.8
0.5-4.0
12.5
2.5-3.0
83.3
1.0
6.0
7.0
5.5
0.5
1.5
1.5
2.0
16.0
Golden State Warriors
1
18.0
5.0-10.0
50.0
2.0-3.0
66.7
0.0-0.0
0.0
0.0
3.0
3.0
1.0
0.0
0.0
5.0
1.0
12.0
Indiana Pacers
1
34.0
9.0-18.0
50.0
2.0-5.0
40.0
3.0-3.0
100.0
2.0
1.0
3.0
7.0
3.0
2.0
2.0
4.0
23.0
Los Angeles Clippers
1
28.0
1.0-6.0
16.7
0.0-1.0
0.0
4.0-4.0
100.0
2.0
1.0
3.0
3.0
0.0
0.0
3.0
1.0
6.0
Minnesota Timberwolves
1
35.0
3.0-11.0
27.3
1.0-2.0
50.0
0.0-0.0
0.0
0.0
2.0
2.0
4.0
1.0
1.0
3.0
2.0
7.0
Utah Jazz
2
37.5
5.5-11.0
50.0
0.5-2.5
20.0
6.5-6.5
100.0
0.5
6.5
7.0
5.0
0.0
3.5
2.0
3.5
18.0
07 / SEASON-BY-SEASON HISTORY
Career statistics
Regular Season Averages
Season
Team
GP
GS
MIN
FG
FG%
3PT
3P%
FT
FT%
OR
DR
REB
AST
BLK
STL
PF
TO
PTS
2016-17
San Antonio Spurs
38
8
8.5
1.3-3.1
43.1
0.2-0.6
39.1
0.6-0.8
70.0
0.2
0.9
1.1
1.3
0.2
0.2
0.8
1.0
3.4
2017-18
San Antonio Spurs
81
48
21.5
3.3-7.5
44.3
0.1-0.4
26.5
1.3-1.8
70.9
1.4
4.3
5.7
2.9
0.4
1.2
1.9
1.7
8.1
2019-20
San Antonio Spurs
66
58
25.6
4.5-9.7
46.2
0.6-1.7
36.9
1.4-1.7
79.8
1.0
4.8
5.8
4.1
0.3
1.7
2.2
1.9
10.9
2020-21
San Antonio Spurs
67
67
31.9
6.6-14.5
45.3
0.9-3.0
31.7
1.6-2.0
79.1
0.9
6.2
7.1
5.4
0.1
1.5
2.0
1.7
15.7
2021-22
San Antonio Spurs
68
68
34.8
8.4-18.3
46.2
1.4-4.3
32.7
2.9-3.6
79.4
1.2
7.1
8.3
9.2
0.3
2.0
2.0
2.6
21.1
2022-23
Atlanta Hawks
74
74
36.4
8.3-17.8
46.4
1.8-5.2
34.4
2.1-2.6
83.2
0.7
4.5
5.3
6.1
0.3
1.5
1.4
2.2
20.5
2023-24
Atlanta Hawks
78
78
35.7
8.6-18.8
45.9
2.6-7.1
36.3
2.7-3.4
79.4
0.8
4.5
5.3
6.4
0.3
1.4
1.8
2.6
22.5
2024-25
New Orleans Pelicans
31
31
32.6
6.3-15.9
39.3
1.7-5.6
29.9
3.3-4.0
82.3
0.5
5.9
6.5
7.4
0.4
2.0
2.0
3.4
17.5
2025-26
New Orleans Pelicans
14
14
27.8
6.3-13.0
48.4
1.4-4.4
30.6
2.8-3.2
86.7
0.3
5.1
5.4
6.4
0.2
1.6
2.4
3.4
16.7
2026-27
New Orleans Pelicans
9
9
31.3
4.9-11.3
43.1
0.9-3.0
29.6
2.8-3.0
92.6
0.8
3.8
4.6
4.4
0.6
1.6
2.3
2.3
13.4
Career
—
526
455
29.3
6.2-13.6
45.4
1.2-3.5
33.8
2.0-2.5
79.6
0.9
4.9
5.8
5.4
0.3
1.5
1.8
2.1
15.5
Regular Season Totals
Season
Team
FG
FG%
3PT
3P%
FT
FT%
OR
DR
REB
AST
BLK
STL
PF
TO
PTS
2016-17
San Antonio Spurs
50-116
43.1
9-23
39.1
21-30
70.0
6
36
42
48
6
8
29
38
130
2017-18
San Antonio Spurs
270-609
44.3
9-34
26.5
105-148
70.9
110
349
459
231
31
97
151
134
654
2019-20
San Antonio Spurs
294-637
46.2
41-111
36.9
91-114
79.8
69
314
383
271
17
111
143
125
720
2020-21
San Antonio Spurs
441-974
45.3
63-199
31.7
106-134
79.1
58
415
473
363
7
101
135
117
1051
2021-22
San Antonio Spurs
573-1241
46.2
96-294
32.7
196-247
79.4
80
483
563
627
23
138
138
180
1438
2022-23
Atlanta Hawks
612-1319
46.4
133-387
34.4
158-190
83.2
53
336
389
448
19
112
106
160
1515
2023-24
Atlanta Hawks
672-1463
45.9
201-554
36.3
208-262
79.4
62
354
416
502
24
111
138
201
1753
2024-25
New Orleans Pelicans
194-494
39.3
52-174
29.9
102-124
82.3
17
183
200
228
12
63
61
106
542
2025-26
New Orleans Pelicans
88-182
48.4
19-62
30.6
39-45
86.7
4
71
75
89
3
23
33
47
234
2026-27
New Orleans Pelicans
44-102
43.1
8-27
29.6
25-27
92.6
7
34
41
40
5
14
21
21
121
Career
—
3238-7137
45.4
631-1865
33.8
1051-1321
79.6
466
2575
3041
2847
147
778
955
1129
8158
Regular Season Misc Totals
Season
Team
DD2
TD3
DQ
EJECT
TECH
FLAG
AST/TO
STL/TO
SC-EFF
SH-EFF
2016-17
San Antonio Spurs
0
0
0
0
0
0
1.3
0.2
1.121
0.47
2017-18
San Antonio Spurs
7
0
0
0
0
0
1.7
0.7
1.074
0.45
2019-20
San Antonio Spurs
6
0
1
0
2
0
2.2
0.9
1.130
0.49
2020-21
San Antonio Spurs
13
4
0
0
2
0
3.1
0.9
1.079
0.49
2021-22
San Antonio Spurs
39
13
0
1
3
0
3.5
0.8
1.159
0.50
2022-23
Atlanta Hawks
8
1
0
0
8
0
2.8
0.7
1.149
0.51
2023-24
Atlanta Hawks
20
1
0
0
4
2
2.5
0.6
1.198
0.53
2024-25
New Orleans Pelicans
8
1
0
0
0
0
2.2
0.6
1.097
0.45
2025-26
New Orleans Pelicans
1
0
0
0
2
0
1.9
0.5
1.286
0.54
2026-27
New Orleans Pelicans
0
0
0
0
1
0
1.9
0.7
1.186
0.47
Career
—
102
20
1
1
22
2
2.5
0.7
1.143
0.50
Scoring, rebounding and assist trend
08 / SHOT CHART AND ZONE SHOOTING
Shot profile
Shot-location data is not connected. Add a BALLDONTLIE GOAT-tier NBA API key in NBA Players → Settings to enable shot charts and zone shooting.
LATEST UPDATEMurray (ankle) is out for Friday's game against Memphis.
This was the expectation after Murray requested a trade from the Pelicans earlier Friday. Shams Charania of ESPN noted Friday that the star guard won't be available for New Orleans for the time being, so Murray can be considered out indefinitely while the team tries to find him another home.


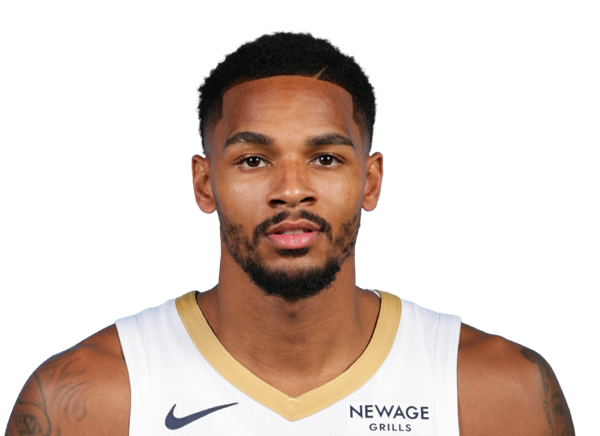

 AJ JohnsonG #14
 Bennedict MathurinG #24
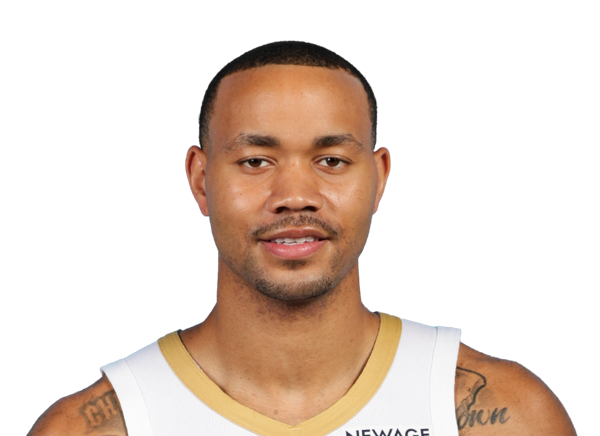 Bryce McGowensG #11
 Christian KolokoC #35
 DeAndre JordanC #6
 Derik QueenC #22
 Herbert JonesF #2
 Hunter DickinsonC #4
 Jalon MooreF
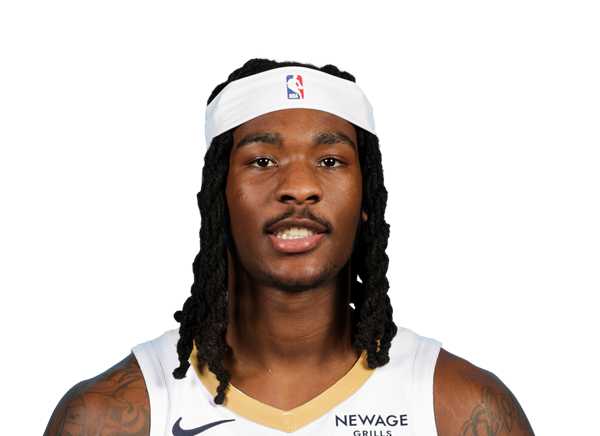 Jaron Pierre Jr.G #10
 Jeremiah FearsG
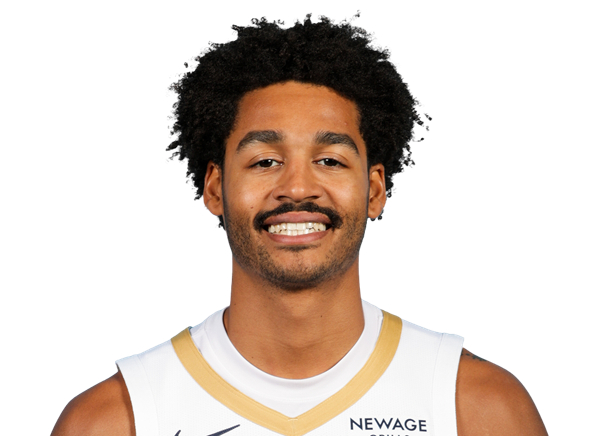 Jordan PooleG #3
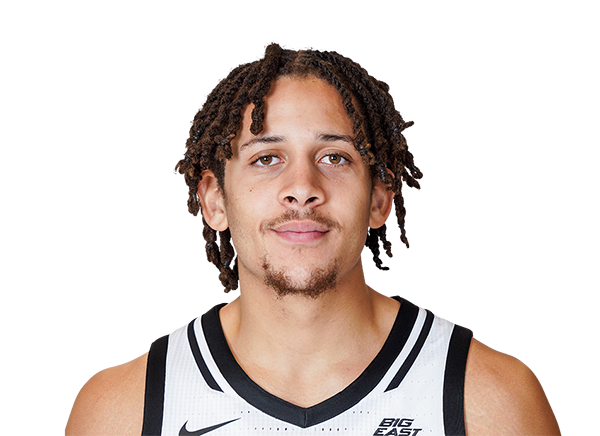 Josh OduroC #13
 Julian ReeseF #13
 Karlo MatkovicF #17
 Malik DiaF #8
 Saddiq BeyF #41
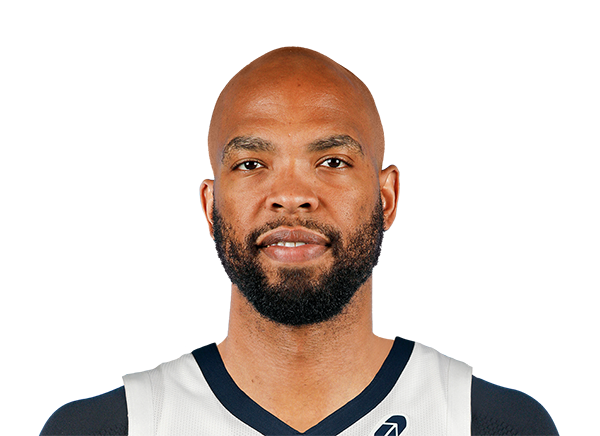 Taj GibsonF
 Trendon WatfordF #9
 Trey Murphy IIIF #25
 Yves MissiC #21
 Zion WilliamsonF #1