Click a season to open this player’s full game log, splits and advanced stats for that year; click a team to open its page. A dash means no NBA games were recorded.
03 / EVERY CATEGORY THE PROVIDER REPORTS
Full statistical breakdown
Regular season 2026-27
Defensive
Metric
Total
NBA rank
Blocks
11
Tied-40th
Defensive Rebounds
56
Tied-55th
Steals
18
Tied-17th
Defensive Rebound Rate
0.0
—
Defensive Rebounds Per Game
4.7
47th
Blocks Per Game
0.9
Tied-41st
Steals Per Game
1.5
19th
Defensive Rebounds Per 48
6.5
Tied-2,640th
Blocks Per 48
1.3
Tied-1,920th
Steals Per 48
2.1
Tied-816th
General
Metric
Total
NBA rank
Disqualifications
0
Tied-21st
Flagrant Fouls
0
Tied-22nd
Fouls
31
Tied-85th
Player Efficiency Rating
23.91
16th
Rebound Rate
0.0
—
Ejections
0
Tied-7th
Technical Fouls
0
Tied-101st
Rebounds
62
—
Value Over Replacement Player
0.0
—
Minutes
416
1st
Minutes Per Game
34.7
—
Rating
45.4
Tied-7th
Plus-Minus
+32
Tied-1st
Rebounds Per Game
5.2
Tied-91st
Fouls Per Game
2.6
Tied-75th
Flagrant Fouls Per Game
0.0
Tied-19th
Technical Fouls Per Game
0.0
Tied-82nd
Ejections Per Game
0.0
Tied-6th
Disqualifications Per Game
0.0
Tied-20th
Assist To Turnover Ratio
2.5
—
Steal To Foul Ratio
0.6
—
Block To Foul Ratio
0.4
—
Team Rebounds Per Game
0.0
—
Rebounds
62
—
Total Technical Fouls
0
—
Assist To Turnover Ratio
0.0
—
Steal To Turnover Ratio
0.5
—
Rebounds Per 48 Minutes
7.2
—
Fouls Per 48 Minutes
3.6
Tied-4,080th
Flagrant Fouls Per 48 Minutes
0.0
Tied-1,056th
Technical Fouls Per 48 Minutes
0.0
Tied-4,848th
Ejections Per 48 Minutes
0.0
Tied-336th
Disqualifications Per 48 Minutes
0.0
Tied-1,008th
R/40
6.0
—
Games Played
12
12th
Games Started
12
Tied-52nd
Double Double
2
Tied-39th
Triple Double
0
Tied-12th
Offensive
Metric
Total
NBA rank
Assists
95
6th
Effective Field Goal Percentage
53.4
—
Field Goals
104/218
—
Field Goals Attempted
218
Tied-14th
Field Goals Made
104
Tied-13th
Field Goal Percentage
47.7
58th
Free Throws
75/87
—
Free Throw Percentage
86.2
66th
Free Throws Attempted
87
Tied-12th
Free Throws Made
75
Tied-11th
Offensive Rebounds
6
Tied-255th
Points
308
9th
Turnovers
38
Tied-18th
3-Point Field Goal Percentage
32.1
174th
3-Point Field Goals Attempted
78
Tied-47th
3-Point Field Goals Made
25
Tied-64th
True Shooting Percentage
60.1
—
Total Turnovers
38
—
Assist Ratio
24.4
—
Points in the Paint
0
Tied-1st
Offensive Rebound Rate
0.0
—
Turnover Ratio
9.8
—
Brick Index
0.00
—
Usage Rate
0.0
—
Average Field Goals Made
8.7
15th
Average Field Goals Attempted
18.2
456th
Average 3-Point Field Goals Made
2.1
Tied-67th
Average 3-Point Field Goals Attempted
6.5
Tied-39th
Average Free Throws Made
6.3
Tied-9th
Average Free Throws Attempted
7.3
13th
Points Per Game
25.7
10th
Offensive Rebounds Per Game
0.5
Tied-225th
Assists Per Game
7.9
6th
Turnovers Per Game
3.2
12th
Offensive Rebound Percentage
0.1
—
Estimated Possessions
284.8
—
Estimated Possessions Per Game
23.7
—
Points Per Estimated Possession
1.1
—
Team Turnovers Per Game
0.0
—
Total Turnovers Per Game
3.2
—
3-Point Field Goal Percentage
32.1
146th
2-Point Field Goals Made
79.0
51st
2-Point Field Goals Attempted
140.0
33rd
2-Point Field Goals Made per Game
6.6
—
2-Point Field Goals Attempted per Game
11.7
—
2-Point Field Goal Percentage
56.4
58th
Shooting Efficiency
0.53
—
Scoring Efficiency
1.413
—
Fieldgoals Made Per 48
12.0
Tied-624th
Fieldgoals Attempted Per 48
25.2
Tied-672nd
3-Point Fieldgoals Made Per 48
2.9
Tied-3,072nd
3-Point Fieldgoals Attempted Per 48
9.0
Tied-2,256th
Freethrows Made Per 48
8.7
Tied-528th
Freethrows Attempted Per 48
10.0
Tied-576th
Points Scored Per 48
35.5
432nd
Offensive Rebounds Per 48
0.7
Tied-12,240th
Assists Per 48
11.0
288th
Turnovers
4.4
Tied-864th
P/40
29.6
—
A/40
9.1
—
04 / EFFICIENCY, SHOOTING PROFILE, PER-36
Advanced metrics
True shooting %60.0%
Effective FG %53.6%
2-point FG %56.4%
3-point attempt rate35.7%
Free throw rate40.1%
Points per shot attempt1.41
% of points from 3s24.5%
Assist-to-turnover2.47
Points per 36 min26.7
Rebounds per 36 min5.4
Assists per 36 min8.2
Steals per 36 min1.56
Blocks per 36 min0.93
Turnovers per 36 min3.32
Stocks (STL + BLK) per game2.40
Pts + Reb + Ast per game38.8
Efficiency (EFF) per game27.5
Game Score per game (Hollinger)21.2
Minutes per game34.7
Calculated by BallersCulture from the supplied 2026-27 box-score totals using standard formulas (hover a tile to see the formula). Tracking-based metrics such as BPM, VORP, on/off and RAPTOR are not available from this data source.
05 / 12 GAMES IN 2026-27
Game log: Regular season
Date
Opp
Result
MIN
FG
FG%
3PT
3P%
FT
FT%
REB
AST
BLK
STL
PF
TO
PTS
Nov 15
@ MIA
L 137-117
36
8-20
40.0
3-8
37.5
14-14
100.0
5
8
1
1
2
3
33
Nov 13
@ WSH
W 144-140 2OT
48
16-25
64.0
3-5
60.0
17-18
94.4
5
11
1
1
2
0
52
Nov 10
vs WSH
W 122-111
27
7-16
43.8
0-4
0.0
3-3
100.0
3
7
0
1
5
0
17
Nov 9
vs LAL
L 121-116
38
6-15
40.0
1-6
16.7
1-2
50.0
4
8
0
2
5
4
14
Nov 5
vs PHI
L 112-106
40
9-22
40.9
1-9
11.1
7-7
100.0
7
11
1
2
2
4
26
Nov 3
@ CHA
W 124-91
27
13-20
65.0
4-7
57.1
3-4
75.0
5
7
0
5
1
3
33
Oct 31
@ BKN
W 110-94
28
6-15
40.0
1-6
16.7
7-7
100.0
5
4
1
0
4
4
20
Oct 29
vs CHA
W 97-89
39
10-22
45.5
4-9
44.4
6-8
75.0
5
7
0
2
2
1
30
Oct 28
@ NY
L 111-97
36
7-18
38.9
2-7
28.6
3-5
60.0
9
8
1
0
0
3
19
Oct 26
@ PHI
W 106-93
33
9-19
47.4
3-8
37.5
5-8
62.5
8
8
2
2
3
4
26
Oct 24
@ MIA
W 128-111
30
5-8
62.5
2-3
66.7
4-6
66.7
2
8
3
1
5
7
16
Oct 21
vs BOS
W 121-113
35
8-18
44.4
1-6
16.7
5-5
100.0
4
8
1
1
0
5
22
06 / 2026-27 HOME / AWAY, RESULTS, MONTHS AND OPPONENTS
Splits
split
Split
GP
MIN
FG
FG%
3PT
3P%
FT
FT%
OR
DR
REB
AST
BLK
STL
PF
TO
PTS
All Splits
12
34.7
8.7-18.2
47.7
2.1-6.5
32.1
6.3-7.3
86.2
0.5
4.7
5.2
7.9
0.9
1.5
2.6
3.2
25.7
Home
5
35.6
8.0-18.6
43.0
1.4-6.8
20.6
4.4-5.0
88.0
0.2
4.4
4.6
8.2
0.4
1.6
2.8
2.8
21.8
Road
7
34.0
9.1-17.9
51.2
2.6-6.3
40.9
7.6-8.9
85.5
0.7
4.9
5.6
7.7
1.3
1.4
2.4
3.4
28.4
vs. Conference
11
34.4
8.9-18.5
48.3
2.2-6.5
33.3
6.7-7.7
87.1
0.5
4.8
5.3
7.9
1.0
1.5
2.4
3.1
26.7
3+ Days Rest
2
36.5
7.0-16.5
42.4
1.0-6.0
16.7
3.0-3.5
85.7
0.5
3.5
4.0
8.0
0.5
1.5
2.5
4.5
18.0
Month
Split
GP
MIN
FG
FG%
3PT
3P%
FT
FT%
OR
DR
REB
AST
BLK
STL
PF
TO
PTS
October
6
33.5
7.5-16.7
45.0
2.2-6.5
33.3
5.0-6.5
76.9
0.5
5.0
5.5
7.2
1.3
1.0
2.3
4.0
22.2
November
6
35.8
9.8-19.7
50.0
2.0-6.5
30.8
7.5-8.0
93.8
0.5
4.3
4.8
8.7
0.5
2.0
2.8
2.3
29.2
Pre All-Star
12
34.7
8.7-18.2
47.7
2.1-6.5
32.1
6.3-7.3
86.2
0.5
4.7
5.2
7.9
0.9
1.5
2.6
3.2
25.7
Result
Split
GP
MIN
FG
FG%
3PT
3P%
FT
FT%
OR
DR
REB
AST
BLK
STL
PF
TO
PTS
Wins
8
33.3
9.3-17.9
51.7
2.3-6.0
37.5
6.3-7.4
84.7
0.3
4.4
4.6
7.5
1.0
1.6
2.8
3.0
27.0
Losses
4
37.5
7.5-18.8
40.0
1.8-7.5
23.3
6.3-7.0
89.3
1.0
5.3
6.3
8.8
0.8
1.3
2.3
3.5
23.0
Position
Split
GP
MIN
FG
FG%
3PT
3P%
FT
FT%
OR
DR
REB
AST
BLK
STL
PF
TO
PTS
As Starter
12
34.7
8.7-18.2
47.7
2.1-6.5
32.1
6.3-7.3
86.2
0.5
4.7
5.2
7.9
0.9
1.5
2.6
3.2
25.7
Day
Split
GP
MIN
FG
FG%
3PT
3P%
FT
FT%
OR
DR
REB
AST
BLK
STL
PF
TO
PTS
Monday
2
26.5
10.0-18.0
55.6
2.0-5.5
36.4
3.0-3.5
85.7
0.0
4.0
4.0
7.0
0.0
3.0
3.0
1.5
25.0
Tuesday
2
35.5
7.5-18.0
41.7
1.5-6.5
23.1
4.0-5.0
80.0
0.5
6.0
6.5
8.0
1.0
0.5
0.0
4.0
20.5
Wednesday
2
39.5
9.5-22.0
43.2
2.5-9.0
27.8
6.5-7.5
86.7
0.0
6.0
6.0
9.0
0.5
2.0
2.0
2.5
28.0
Thursday
1
48.0
16.0-25.0
64.0
3.0-5.0
60.0
17.0-18.0
94.4
0.0
5.0
5.0
11.0
1.0
1.0
2.0
0.0
52.0
Friday
2
29.0
5.5-11.5
47.8
1.5-4.5
33.3
5.5-6.5
84.6
1.0
2.5
3.5
6.0
2.0
0.5
4.5
5.5
18.0
Saturday
1
36.0
8.0-20.0
40.0
3.0-8.0
37.5
14.0-14.0
100.0
2.0
3.0
5.0
8.0
1.0
1.0
2.0
3.0
33.0
Sunday
2
35.5
7.5-17.0
44.1
2.0-7.0
28.6
3.0-5.0
60.0
0.5
5.5
6.0
8.0
1.0
2.0
4.0
4.0
20.0
Opponent
Split
GP
MIN
FG
FG%
3PT
3P%
FT
FT%
OR
DR
REB
AST
BLK
STL
PF
TO
PTS
Brooklyn Nets
1
28.0
6.0-15.0
40.0
1.0-6.0
16.7
7.0-7.0
100.0
1.0
4.0
5.0
4.0
1.0
0.0
4.0
4.0
20.0
Boston Celtics
1
35.0
8.0-18.0
44.4
1.0-6.0
16.7
5.0-5.0
100.0
0.0
4.0
4.0
8.0
1.0
1.0
0.0
5.0
22.0
Charlotte Hornets
2
32.5
11.5-21.0
54.8
4.0-8.0
50.0
4.5-6.0
75.0
0.0
5.0
5.0
7.0
0.0
3.5
1.5
2.0
31.5
Los Angeles Lakers
1
38.0
6.0-15.0
40.0
1.0-6.0
16.7
1.0-2.0
50.0
1.0
3.0
4.0
8.0
0.0
2.0
5.0
4.0
14.0
Miami Heat
2
33.0
6.5-14.0
46.4
2.5-5.5
45.5
9.0-10.0
90.0
1.5
2.0
3.5
8.0
2.0
1.0
3.5
5.0
24.5
New York Knicks
1
36.0
7.0-18.0
38.9
2.0-7.0
28.6
3.0-5.0
60.0
1.0
8.0
9.0
8.0
1.0
0.0
0.0
3.0
19.0
Philadelphia 76ers
2
36.5
9.0-20.5
43.9
2.0-8.5
23.5
6.0-7.5
80.0
0.0
7.5
7.5
9.5
1.5
2.0
2.5
4.0
26.0
Washington Wizards
2
37.5
11.5-20.5
56.1
1.5-4.5
33.3
10.0-10.5
95.2
0.0
4.0
4.0
9.0
0.5
1.0
3.5
0.0
34.5
07 / SEASON-BY-SEASON HISTORY
Career statistics
Regular Season Averages
Season
Team
GP
GS
MIN
FG
FG%
3PT
3P%
FT
FT%
OR
DR
REB
AST
BLK
STL
PF
TO
PTS
2021-22
Detroit Pistons
64
64
32.6
6.7-16.1
41.6
1.8-5.7
31.4
2.2-2.6
84.5
0.9
4.6
5.5
5.6
0.7
1.2
3.1
3.7
17.4
2022-23
Detroit Pistons
12
12
33.3
7.8-18.7
41.5
1.4-5.1
27.9
3.0-3.6
83.7
1.0
5.2
6.2
6.0
0.6
0.8
2.8
3.3
19.9
2023-24
Detroit Pistons
62
62
33.5
8.5-18.8
44.9
1.9-5.4
35.5
3.8-4.4
86.9
0.5
3.8
4.3
7.5
0.4
0.9
2.5
3.4
22.7
2024-25
Detroit Pistons
70
70
35.0
9.8-20.8
46.9
2.1-6.0
35.6
4.5-5.3
84.6
0.8
5.3
6.1
9.1
0.8
1.0
2.8
4.4
26.1
2025-26
Detroit Pistons
64
64
33.9
8.6-18.6
46.1
2.0-5.7
34.2
4.8-6.0
81.2
0.9
4.7
5.5
9.9
0.8
1.4
3.1
3.7
23.9
2026-27
Detroit Pistons
12
12
34.7
8.7-18.2
47.7
2.1-6.5
32.1
6.3-7.3
86.2
0.5
4.7
5.2
7.9
0.9
1.5
2.6
3.2
25.7
Career
—
284
284
33.8
8.4-18.6
45.1
1.9-5.7
33.9
3.9-4.7
84.1
0.8
4.6
5.4
8.0
0.7
1.1
2.8
3.8
22.6
Regular Season Totals
Season
Team
FG
FG%
3PT
3P%
FT
FT%
OR
DR
REB
AST
BLK
STL
PF
TO
PTS
2021-22
Detroit Pistons
429-1031
41.6
114-363
31.4
142-168
84.5
58
296
354
356
43
78
200
234
1114
2022-23
Detroit Pistons
93-224
41.5
17-61
27.9
36-43
83.7
12
62
74
72
7
10
34
39
239
2023-24
Detroit Pistons
524-1167
44.9
119-335
35.5
238-274
86.9
33
235
268
464
22
56
153
212
1405
2024-25
Detroit Pistons
684-1457
46.9
149-418
35.6
313-370
84.6
56
369
425
638
53
71
195
309
1830
2025-26
Detroit Pistons
548-1189
46.1
125-366
34.2
310-382
81.2
56
299
355
634
54
92
196
236
1531
2026-27
Detroit Pistons
104-218
47.7
25-78
32.1
75-87
86.2
6
56
62
95
11
18
31
38
308
Career
—
2382-5286
45.1
549-1621
33.9
1114-1324
84.1
221
1317
1538
2259
190
325
809
1068
6427
Regular Season Misc Totals
Season
Team
DD2
TD3
DQ
EJECT
TECH
FLAG
AST/TO
STL/TO
SC-EFF
SH-EFF
2021-22
Detroit Pistons
10
2
1
1
7
0
1.5
0.3
1.081
0.47
2022-23
Detroit Pistons
3
0
0
0
0
0
1.8
0.3
1.067
0.45
2023-24
Detroit Pistons
14
0
1
0
3
0
2.2
0.3
1.204
0.50
2024-25
Detroit Pistons
31
9
0
1
10
1
2.1
0.2
1.256
0.52
2025-26
Detroit Pistons
38
3
1
0
8
0
2.7
0.4
1.288
0.51
2026-27
Detroit Pistons
2
0
0
0
0
0
2.5
0.5
1.413
0.53
Career
—
98
14
3
2
28
1
2.1
0.3
1.216
0.50
Scoring, rebounding and assist trend
08 / SHOT CHART AND ZONE SHOOTING
Shot profile
Shot-location data is not connected. Add a BALLDONTLIE GOAT-tier NBA API key in NBA Players → Settings to enable shot charts and zone shooting.
LATEST UPDATECunningham finished with 33 points (8-20 FG, 3-8 3Pt, 14-14 FT), five rebounds, eight assists, a steal and a block across 36 minutes in Saturday's 137-117 loss to the Heat.
Cunningham followed his career-high 52-point performance against Washington on Thursday with another strong scoring effort, giving him 85 points across his last two appearances. His perfect 14-for-14 showing at the charity stripe helped compensate for a less efficient night from the field, and he continues to shoulder Detroit's offensive responsibilities. Cunningham remains the Pistons' primary creator, and his combination of scoring volume and playmaking keeps his fantasy ceiling among the highest at his position. He's also in an impressive playmaking stretch, as this was his fifth straight game with at least seven assists.




 Ausar ThompsonG #9
 Brice WilliamsF #25
 Chaz LanierG #8
 Daniss JenkinsG #24
 Duncan RobinsonF #55
 Ebuka OkorieG #23
 Elijah HarklessG #94
 Gary HarrisG
 Isaac JonesC #13
 Isaiah JoeG #17
 Jalen DurenC
 Javonte GreenG #31
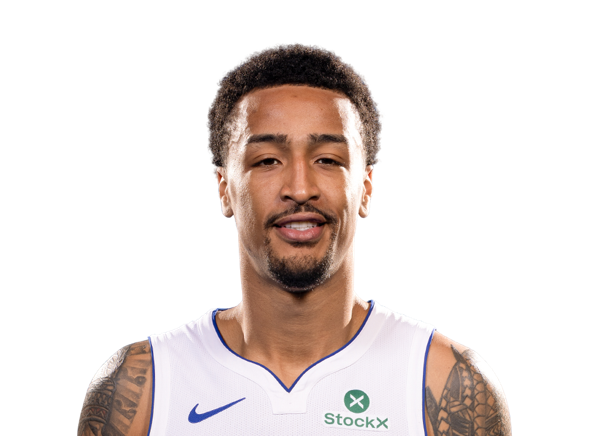 John CollinsF #20
 John UkomaduF #18
 Kevin HuerterG #27
 Paul ReedF #7
 Ronald Holland IIF #5
 Taurean PrinceF #12
 Tolu SmithF #35
 Ugonna OnyensoC #34
 Wendell Moore Jr.F #14