Click a season to open this player’s full game log, splits and advanced stats for that year; click a team to open its page. A dash means no NBA games were recorded.
03 / EVERY CATEGORY THE PROVIDER REPORTS
Full statistical breakdown
Regular season 2026-27
Defensive
Metric
Total
NBA rank
Blocks
0
Tied-370th
Defensive Rebounds
4
Tied-381st
Steals
0
Tied-402nd
Defensive Rebound Rate
0.0
—
Defensive Rebounds Per Game
0.8
—
Blocks Per Game
0.0
—
Steals Per Game
0.0
—
Defensive Rebounds Per 48
8.0
2,612th
Blocks Per 48
0.0
2,537th
Steals Per 48
0.0
2,756th
General
Metric
Total
NBA rank
Disqualifications
0
Tied-21st
Flagrant Fouls
0
Tied-22nd
Fouls
3
Tied-391st
Player Efficiency Rating
-6.81
—
Rebound Rate
0.0
—
Ejections
0
Tied-7th
Technical Fouls
0
Tied-101st
Rebounds
5
—
Value Over Replacement Player
-6.3
—
Minutes
24
Tied-7th
Minutes Per Game
4.8
—
Rating
0.5
Tied-489th
Plus-Minus
-16
Tied-1st
Rebounds Per Game
1.0
—
Fouls Per Game
0.6
—
Flagrant Fouls Per Game
0.0
—
Technical Fouls Per Game
0.0
—
Ejections Per Game
0.0
—
Disqualifications Per Game
0.0
—
Assist To Turnover Ratio
0.0
—
Steal To Foul Ratio
0.0
—
Block To Foul Ratio
0.0
—
Team Rebounds Per Game
0.0
—
Rebounds
5
—
Total Technical Fouls
0
—
Assist To Turnover Ratio
0.0
—
Steal To Turnover Ratio
0.0
—
Rebounds Per 48 Minutes
10.0
—
Fouls Per 48 Minutes
6.0
2,681st
Flagrant Fouls Per 48 Minutes
0.0
150th
Technical Fouls Per 48 Minutes
0.0
692nd
Ejections Per 48 Minutes
0.0
48th
Disqualifications Per 48 Minutes
0.0
144th
R/40
8.3
—
Games Played
5
5th
Games Started
0
Tied-257th
Double Double
0
Tied-119th
Triple Double
0
Tied-12th
Offensive
Metric
Total
NBA rank
Assists
0
Tied-431st
Effective Field Goal Percentage
16.7
—
Field Goals
1/6
—
Field Goals Attempted
6
Tied-413th
Field Goals Made
1
Tied-433rd
Field Goal Percentage
16.7
—
Free Throws
0/0
—
Free Throw Percentage
0.0
—
Free Throws Attempted
0
Tied-418th
Free Throws Made
0
Tied-413th
Offensive Rebounds
1
Tied-386th
Points
2
Tied-443rd
Turnovers
2
Tied-365th
3-Point Field Goal Percentage
0.0
—
3-Point Field Goals Attempted
5
Tied-345th
3-Point Field Goals Made
0
Tied-379th
True Shooting Percentage
16.7
—
Total Turnovers
2
—
Assist Ratio
0.0
—
Points in the Paint
0
Tied-1st
Offensive Rebound Rate
0.0
—
Turnover Ratio
25.0
—
Brick Index
0.00
—
Usage Rate
0.0
—
Average Field Goals Made
0.2
—
Average Field Goals Attempted
1.2
—
Average 3-Point Field Goals Made
0.0
—
Average 3-Point Field Goals Attempted
1.0
—
Average Free Throws Made
0.0
—
Average Free Throws Attempted
0.0
—
Points Per Game
0.4
—
Offensive Rebounds Per Game
0.2
—
Assists Per Game
0.0
—
Turnovers Per Game
0.4
—
Offensive Rebound Percentage
0.2
—
Estimated Possessions
7.0
—
Estimated Possessions Per Game
1.4
—
Points Per Estimated Possession
0.3
—
Team Turnovers Per Game
0.0
—
Total Turnovers Per Game
0.4
—
3-Point Field Goal Percentage
0.0
—
2-Point Field Goals Made
1.0
Tied-54th
2-Point Field Goals Attempted
1.0
Tied-68th
2-Point Field Goals Made per Game
0.2
—
2-Point Field Goals Attempted per Game
0.2
—
2-Point Field Goal Percentage
100.0
—
Shooting Efficiency
0.17
—
Scoring Efficiency
0.333
—
Fieldgoals Made Per 48
2.0
2,969th
Fieldgoals Attempted Per 48
12.0
2,832nd
3-Point Fieldgoals Made Per 48
0.0
2,598th
3-Point Fieldgoals Attempted Per 48
10.0
2,365th
Freethrows Made Per 48
0.0
2,832nd
Freethrows Attempted Per 48
0.0
2,866th
Points Scored Per 48
4.0
3,037th
Offensive Rebounds Per 48
2.0
2,646th
Assists Per 48
0.0
2,955th
Turnovers
4.0
2,502nd
P/40
3.3
—
A/40
0.0
—
04 / EFFICIENCY, SHOOTING PROFILE, PER-36
Advanced metrics
True shooting %16.7%
Effective FG %16.7%
2-point FG %100.0%
3-point attempt rate83.3%
Free throw rate0.0%
Points per shot attempt0.33
% of points from 3s0.0%
Assist-to-turnover0.00
Points per 36 min3.0
Rebounds per 36 min7.5
Assists per 36 min0.0
Steals per 36 min0.00
Blocks per 36 min0.00
Turnovers per 36 min3.00
Stocks (STL + BLK) per game0.00
Pts + Reb + Ast per game1.4
Efficiency (EFF) per game0.0
Game Score per game (Hollinger)-0.6
Minutes per game4.8
Calculated by BallersCulture from the supplied 2026-27 box-score totals using standard formulas (hover a tile to see the formula). Tracking-based metrics such as BPM, VORP, on/off and RAPTOR are not available from this data source.
05 / 5 GAMES IN 2026-27
Game log: Regular season
Date
Opp
Result
MIN
FG
FG%
3PT
3P%
FT
FT%
REB
AST
BLK
STL
PF
TO
PTS
Nov 12
@ MIL
W 123-112
13
0-3
0.0
0-3
0.0
0-0
0.0
2
0
0
0
1
2
0
Nov 10
@ ATL
W 124-114
7
1-2
50.0
0-1
0.0
0-0
0.0
3
0
0
0
2
0
2
Nov 5
@ SAC
W 116-103
1
0-1
0.0
0-1
0.0
0-0
0.0
0
0
0
0
0
0
0
Nov 3
vs MIA
W 138-117
1
0-0
0.0
0-0
0.0
0-0
0.0
0
0
0
0
0
0
0
Nov 2
vs TOR
W 131-125
1
0-0
0.0
0-0
0.0
0-0
0.0
0
0
0
0
0
0
0
06 / 2026-27 HOME / AWAY, RESULTS, MONTHS AND OPPONENTS
Splits
split
Split
GP
MIN
FG
FG%
3PT
3P%
FT
FT%
OR
DR
REB
AST
BLK
STL
PF
TO
PTS
All Splits
5
4.8
0.2-1.2
16.7
0.0-1.0
0.0
0.0-0.0
0.0
0.2
0.8
1.0
0.0
0.0
0.0
0.6
0.4
0.4
Home
2
1.0
0.0-0.0
0.0
0.0-0.0
0.0
0.0-0.0
0.0
0.0
0.0
0.0
0.0
0.0
0.0
0.0
0.0
0.0
Road
3
7.3
0.3-2.0
16.7
0.0-1.7
0.0
0.0-0.0
0.0
0.3
1.3
1.7
0.0
0.0
0.0
1.0
0.7
0.7
vs. Division
1
1.0
0.0-1.0
0.0
0.0-1.0
0.0
0.0-0.0
0.0
0.0
0.0
0.0
0.0
0.0
0.0
0.0
0.0
0.0
vs. Conference
1
1.0
0.0-1.0
0.0
0.0-1.0
0.0
0.0-0.0
0.0
0.0
0.0
0.0
0.0
0.0
0.0
0.0
0.0
0.0
3+ Days Rest
2
4.0
0.5-1.0
50.0
0.0-0.5
0.0
0.0-0.0
0.0
0.0
1.5
1.5
0.0
0.0
0.0
1.0
0.0
1.0
Month
Split
GP
MIN
FG
FG%
3PT
3P%
FT
FT%
OR
DR
REB
AST
BLK
STL
PF
TO
PTS
November
5
4.8
0.2-1.2
16.7
0.0-1.0
0.0
0.0-0.0
0.0
0.2
0.8
1.0
0.0
0.0
0.0
0.6
0.4
0.4
Pre All-Star
5
4.8
0.2-1.2
16.7
0.0-1.0
0.0
0.0-0.0
0.0
0.2
0.8
1.0
0.0
0.0
0.0
0.6
0.4
0.4
Result
Split
GP
MIN
FG
FG%
3PT
3P%
FT
FT%
OR
DR
REB
AST
BLK
STL
PF
TO
PTS
Wins
5
4.8
0.2-1.2
16.7
0.0-1.0
0.0
0.0-0.0
0.0
0.2
0.8
1.0
0.0
0.0
0.0
0.6
0.4
0.4
Day
Split
GP
MIN
FG
FG%
3PT
3P%
FT
FT%
OR
DR
REB
AST
BLK
STL
PF
TO
PTS
Monday
2
4.5
0.5-1.0
50.0
0.0-0.5
0.0
0.0-0.0
0.0
0.0
1.5
1.5
0.0
0.0
0.0
1.0
0.0
1.0
Wednesday
2
7.0
0.0-2.0
0.0
0.0-2.0
0.0
0.0-0.0
0.0
0.5
0.5
1.0
0.0
0.0
0.0
0.5
1.0
0.0
Sunday
1
1.0
0.0-0.0
0.0
0.0-0.0
0.0
0.0-0.0
0.0
0.0
0.0
0.0
0.0
0.0
0.0
0.0
0.0
0.0
Opponent
Split
GP
MIN
FG
FG%
3PT
3P%
FT
FT%
OR
DR
REB
AST
BLK
STL
PF
TO
PTS
Atlanta Hawks
1
7.0
1.0-2.0
50.0
0.0-1.0
0.0
0.0-0.0
0.0
0.0
3.0
3.0
0.0
0.0
0.0
2.0
0.0
2.0
Miami Heat
1
1.0
0.0-0.0
0.0
0.0-0.0
0.0
0.0-0.0
0.0
0.0
0.0
0.0
0.0
0.0
0.0
0.0
0.0
0.0
Milwaukee Bucks
1
13.0
0.0-3.0
0.0
0.0-3.0
0.0
0.0-0.0
0.0
1.0
1.0
2.0
0.0
0.0
0.0
1.0
2.0
0.0
Sacramento Kings
1
1.0
0.0-1.0
0.0
0.0-1.0
0.0
0.0-0.0
0.0
0.0
0.0
0.0
0.0
0.0
0.0
0.0
0.0
0.0
Toronto Raptors
1
1.0
0.0-0.0
0.0
0.0-0.0
0.0
0.0-0.0
0.0
0.0
0.0
0.0
0.0
0.0
0.0
0.0
0.0
0.0
07 / SEASON-BY-SEASON HISTORY
Career statistics
Regular Season Averages
Season
Team
GP
GS
MIN
FG
FG%
3PT
3P%
FT
FT%
OR
DR
REB
AST
BLK
STL
PF
TO
PTS
2026-27
Los Angeles Lakers
5
0
4.8
0.2-1.2
16.7
0.0-1.0
0.0
0.0-0.0
0.0
0.2
0.8
1.0
0.0
0.0
0.0
0.6
0.4
0.4
Career
—
5
0
4.8
0.2-1.2
16.7
0.0-1.0
0.0
0.0-0.0
0.0
0.2
0.8
1.0
0.0
0.0
0.0
0.6
0.4
0.4
Regular Season Totals
Season
Team
FG
FG%
3PT
3P%
FT
FT%
OR
DR
REB
AST
BLK
STL
PF
TO
PTS
2026-27
Los Angeles Lakers
1-6
16.7
0-5
0.0
0-0
0.0
1
4
5
0
0
0
3
2
2
Career
—
1-6
16.7
0-5
0.0
0-0
0.0
1
4
5
0
0
0
3
2
2
Regular Season Misc Totals
Season
Team
DD2
TD3
DQ
EJECT
TECH
FLAG
AST/TO
STL/TO
SC-EFF
SH-EFF
2026-27
Los Angeles Lakers
0
0
0
0
0
0
0.0
0.0
0.333
0.17
Career
—
0
0
0
0
0
0
0.0
0.0
0.333
0.17
08 / SHOT CHART AND ZONE SHOOTING
Shot profile
Shot-location data is not connected. Add a BALLDONTLIE GOAT-tier NBA API key in NBA Players → Settings to enable shot charts and zone shooting.
LATEST UPDATECarr (illness) has been ruled out for Sunday's game against Phoenix.
Bronny James is also questionable due to an illness, but Carr has already been deemed unable to play. He's played a total of 20 minutes over his last two outings, and with Austin Reaves (heel) sidelined as well, the Lakers will likely funnel more minutes to Quentin Grimes and Collin Sexton (eye).


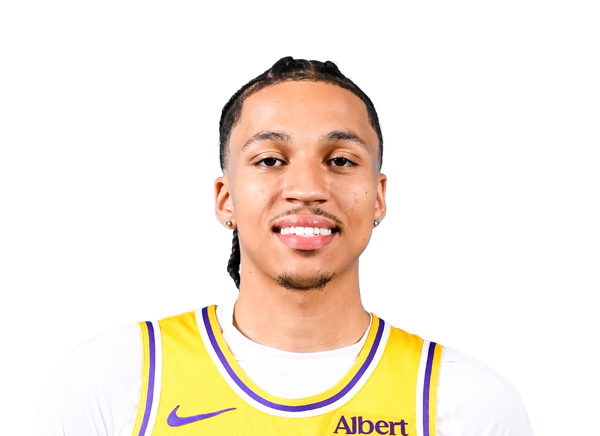

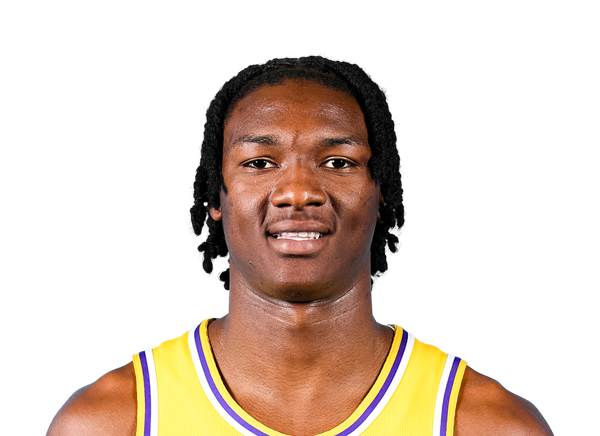 Adou ThieroF #1
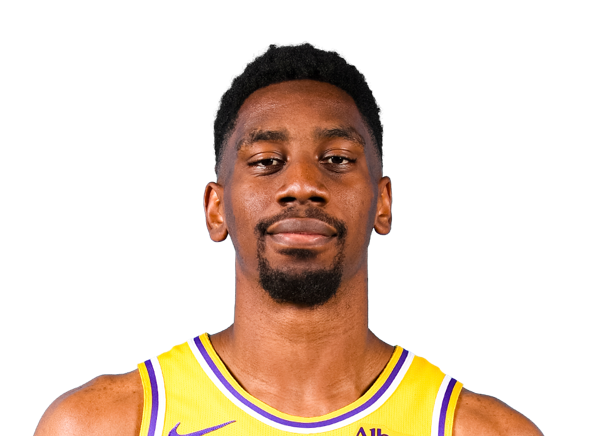 AK OkerekeF #31
 Aniwaniwa Tait-JonesG
 Anton WatsonF
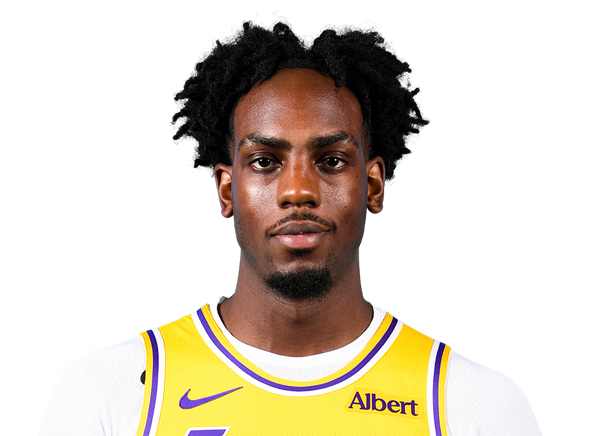 Arthur KalumaF #47
 Austin ReavesG #15
 Bronny JamesG #9
 Carson CooperC
 Chase RossG #29
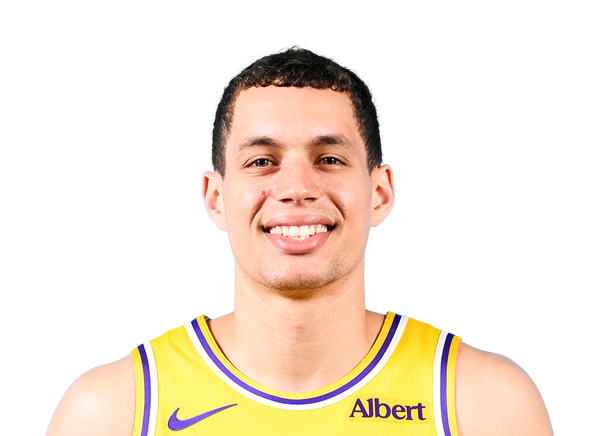 Chris ManonG #30
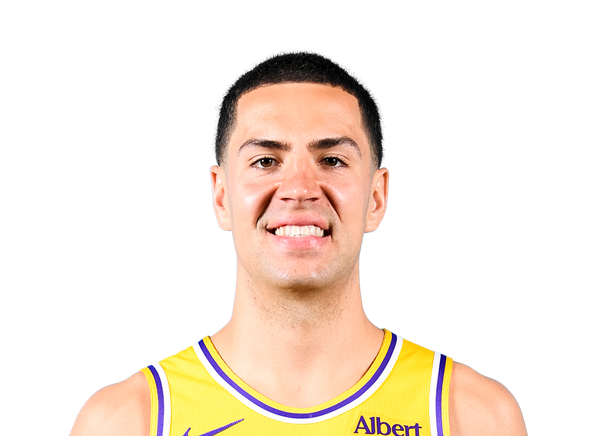 Cole SwiderF #41
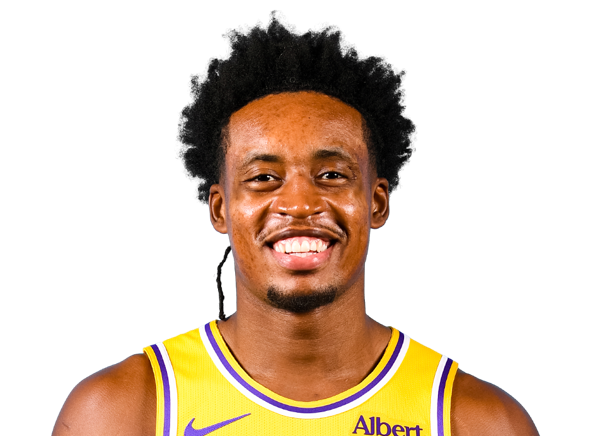 Collin SextonG #10
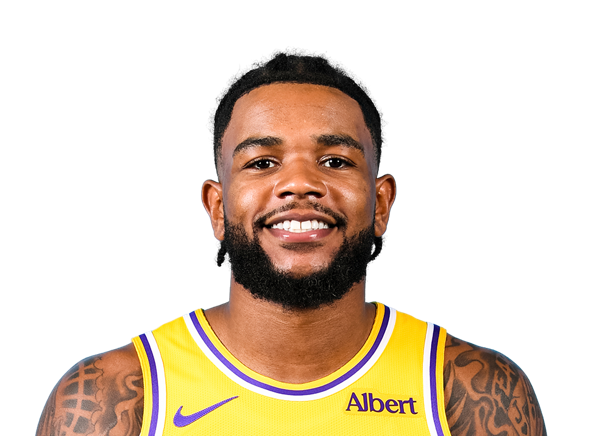 Jaden HardyG #7
 Jake LaRaviaF #12
 Jarred VanderbiltF #2
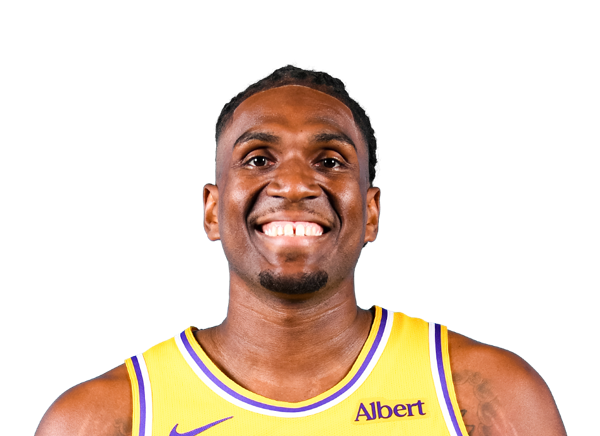 Kevon LooneyF #55
 Lawson LoveringC
 Luka DoncicG #77
 Matisse ThybulleG #4
 Maxi KleberF #14
 Meechie JohnsonG
 Nick Smith Jr.G #20
 Quentin GrimesG #5
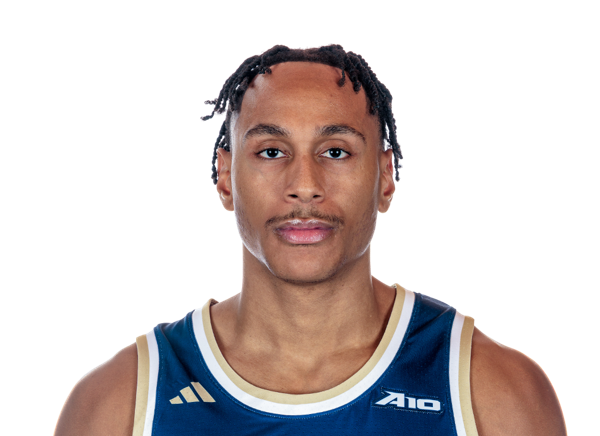 Rafael CastroF
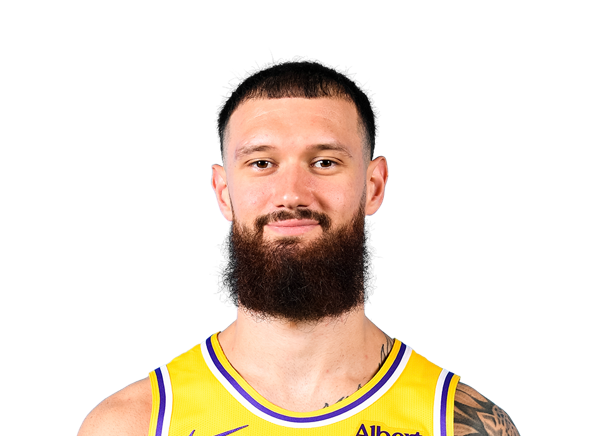 Sandro MamukelashviliF #54
 Walker KesslerC #14
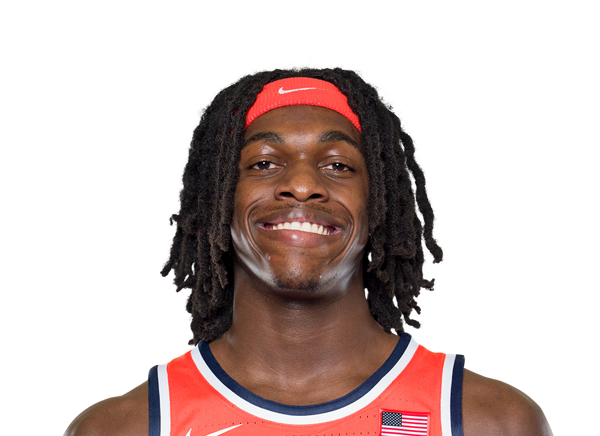 William Kyle IIIF #45
 Ziaire WilliamsF #11