Click a season to open this player’s full game log, splits and advanced stats for that year; click a team to open its page. A dash means no NBA games were recorded.
03 / EVERY CATEGORY THE PROVIDER REPORTS
Full statistical breakdown
Regular season 2026-27
Defensive
Metric
Total
NBA rank
Blocks
13
Tied-26th
Defensive Rebounds
24
Tied-219th
Steals
31
2nd
Defensive Rebound Rate
0.0
—
Defensive Rebounds Per Game
1.7
224th
Blocks Per Game
0.9
Tied-36th
Steals Per Game
2.2
2nd
Defensive Rebounds Per 48
3.3
Tied-5,256th
Blocks Per 48
1.8
Tied-624th
Steals Per 48
4.3
48th
General
Metric
Total
NBA rank
Disqualifications
0
Tied-22nd
Flagrant Fouls
0
Tied-24th
Fouls
28
Tied-130th
Player Efficiency Rating
11.82
207th
Rebound Rate
0.0
—
Ejections
0
Tied-7th
Technical Fouls
2
Tied-12th
Rebounds
32
—
Value Over Replacement Player
0.0
—
Minutes
344
2nd
Minutes Per Game
24.6
—
Rating
14.6
Tied-53rd
Plus-Minus
+66
Tied-1st
Rebounds Per Game
2.3
Tied-230th
Fouls Per Game
2.0
Tied-160th
Flagrant Fouls Per Game
0.0
Tied-21st
Technical Fouls Per Game
0.1
Tied-25th
Ejections Per Game
0.0
Tied-6th
Disqualifications Per Game
0.0
Tied-21st
Assist To Turnover Ratio
0.8
—
Steal To Foul Ratio
1.1
—
Block To Foul Ratio
0.5
—
Team Rebounds Per Game
0.0
—
Rebounds
32
—
Total Technical Fouls
2
—
Assist To Turnover Ratio
0.0
—
Steal To Turnover Ratio
1.7
—
Rebounds Per 48 Minutes
4.5
—
Fouls Per 48 Minutes
3.9
Tied-3,120th
Flagrant Fouls Per 48 Minutes
0.0
Tied-576th
Technical Fouls Per 48 Minutes
0.3
Tied-288th
Ejections Per 48 Minutes
0.0
Tied-168th
Disqualifications Per 48 Minutes
0.0
Tied-528th
R/40
3.7
—
Games Played
14
14th
Games Started
14
Tied-7th
Double Double
0
Tied-121st
Triple Double
0
Tied-13th
Offensive
Metric
Total
NBA rank
Assists
14
Tied-245th
Effective Field Goal Percentage
58.8
—
Field Goals
35/80
—
Field Goals Attempted
80
Tied-182nd
Field Goals Made
35
Tied-194th
Field Goal Percentage
43.8
—
Free Throws
10/11
—
Free Throw Percentage
90.9
Tied-29th
Free Throws Attempted
11
Tied-250th
Free Throws Made
10
Tied-228th
Offensive Rebounds
8
Tied-218th
Points
104
Tied-179th
Turnovers
18
Tied-119th
3-Point Field Goal Percentage
39.3
86th
3-Point Field Goals Attempted
61
Tied-89th
3-Point Field Goals Made
24
Tied-79th
True Shooting Percentage
61.3
—
Total Turnovers
18
—
Assist Ratio
12.0
—
Points in the Paint
0
Tied-1st
Offensive Rebound Rate
0.0
—
Turnover Ratio
15.4
—
Brick Index
0.00
—
Usage Rate
0.0
—
Average Field Goals Made
2.5
—
Average Field Goals Attempted
5.7
Tied-236th
Average 3-Point Field Goals Made
1.7
Tied-101st
Average 3-Point Field Goals Attempted
4.4
105th
Average Free Throws Made
0.7
—
Average Free Throws Attempted
0.8
Tied-232nd
Points Per Game
7.4
191st
Offensive Rebounds Per Game
0.6
Tied-216th
Assists Per Game
1.0
Tied-232nd
Turnovers Per Game
1.3
140th
Offensive Rebound Percentage
0.2
—
Estimated Possessions
94.4
—
Estimated Possessions Per Game
6.7
—
Points Per Estimated Possession
1.1
—
Team Turnovers Per Game
0.0
—
Total Turnovers Per Game
1.3
—
3-Point Field Goal Percentage
39.3
70th
2-Point Field Goals Made
11.0
Tied-115th
2-Point Field Goals Attempted
19.0
Tied-93rd
2-Point Field Goals Made per Game
0.8
—
2-Point Field Goals Attempted per Game
1.4
—
2-Point Field Goal Percentage
57.9
—
Shooting Efficiency
0.59
—
Scoring Efficiency
1.300
—
Fieldgoals Made Per 48
4.9
Tied-4,656th
Fieldgoals Attempted Per 48
11.2
Tied-4,368th
3-Point Fieldgoals Made Per 48
3.3
Tied-1,896th
3-Point Fieldgoals Attempted Per 48
8.5
Tied-2,136th
Freethrows Made Per 48
1.4
Tied-5,472nd
Freethrows Attempted Per 48
1.5
Tied-6,000th
Points Scored Per 48
14.5
Tied-4,296th
Offensive Rebounds Per 48
1.1
Tied-5,232nd
Assists Per 48
2.0
Tied-5,880th
Turnovers
2.5
Tied-2,856th
P/40
12.1
—
A/40
1.6
—
04 / EFFICIENCY, SHOOTING PROFILE, PER-36
Advanced metrics
True shooting %61.1%
Effective FG %58.8%
2-point FG %61.5%
3-point attempt rate77.2%
Free throw rate14.0%
Points per shot attempt1.30
% of points from 3s68.9%
Assist-to-turnover0.77
Points per 36 min10.8
Rebounds per 36 min3.4
Assists per 36 min1.5
Steals per 36 min3.22
Blocks per 36 min1.32
Turnovers per 36 min1.90
Stocks (STL + BLK) per game3.10
Pts + Reb + Ast per game10.7
Efficiency (EFF) per game9.2
Game Score per game (Hollinger)6.7
Minutes per game24.6
Calculated by BallersCulture from the supplied 2026-27 box-score totals using standard formulas (hover a tile to see the formula). Tracking-based metrics such as BPM, VORP, on/off and RAPTOR are not available from this data source.
05 / 14 GAMES IN 2026-27
Game log: Regular season
Date
Opp
Result
MIN
FG
FG%
3PT
3P%
FT
FT%
REB
AST
BLK
STL
PF
TO
PTS
Nov 16
@ PHX
W 131-123
26
4-9
44.4
2-6
33.3
2-2
100.0
8
0
2
3
3
4
12
Nov 12
@ MIL
W 123-112
23
3-6
50.0
2-4
50.0
0-0
0.0
5
1
1
3
1
2
8
Nov 10
@ ATL
W 124-114
23
2-5
40.0
2-5
40.0
0-0
0.0
0
1
1
3
0
1
6
Nov 9
@ DET
W 121-116
28
2-5
40.0
0-3
0.0
0-0
0.0
2
0
0
4
3
0
4
Nov 7
vs POR
W 124-118
24
0-1
0.0
0-1
0.0
2-2
100.0
2
0
0
3
2
2
2
Nov 5
@ SAC
W 116-103
23
1-5
20.0
1-5
20.0
0-0
0.0
1
2
2
2
0
0
3
Nov 3
vs MIA
W 138-117
19
2-6
33.3
2-6
33.3
0-0
0.0
1
2
1
0
3
1
6
Nov 2
vs TOR
W 131-125
25
2-6
33.3
2-4
50.0
0-0
0.0
2
3
2
2
1
1
6
Oct 31
@ GS
L 112-95
28
2-6
33.3
1-3
33.3
5-5
100.0
3
0
0
3
4
1
10
Oct 29
@ LAC
W 103-87
28
5-6
83.3
4-5
80.0
1-2
50.0
1
0
1
2
2
2
15
Oct 28
vs POR
L 136-129
22
2-5
40.0
1-4
25.0
0-0
0.0
2
1
0
0
3
3
5
Oct 26
@ UTAH
W 132-123
26
4-8
50.0
3-7
42.9
0-0
0.0
1
1
1
3
1
0
11
Oct 24
vs LAC
W 125-117
24
5-8
62.5
3-6
50.0
0-0
0.0
1
2
1
2
2
0
13
Oct 22
vs GS
W 127-105
23
1-4
25.0
1-2
50.0
0-0
0.0
3
1
1
1
3
1
3
06 / 2026-27 HOME / AWAY, RESULTS, MONTHS AND OPPONENTS
Splits
split
Split
GP
MIN
FG
FG%
3PT
3P%
FT
FT%
OR
DR
REB
AST
BLK
STL
PF
TO
PTS
All Splits
14
24.6
2.5-5.7
43.8
1.7-4.4
39.3
0.7-0.8
90.9
0.6
1.7
2.3
1.0
0.9
2.2
2.0
1.3
7.4
Home
6
22.8
2.0-5.0
40.0
1.5-3.8
39.1
0.3-0.3
100.0
0.3
1.5
1.8
1.5
0.8
1.3
2.3
1.3
5.8
Road
8
25.8
2.9-6.3
46.0
1.9-4.8
39.5
1.0-1.1
88.9
0.8
1.9
2.6
0.6
1.0
2.9
1.8
1.3
8.6
vs. Division
6
25.5
3.0-6.3
47.4
2.0-4.5
44.4
1.3-1.5
88.9
1.0
1.8
2.8
0.8
1.2
2.2
2.3
1.3
9.3
vs. Conference
9
25.0
2.7-5.8
46.2
1.8-4.3
41.0
1.1-1.2
90.9
0.8
1.7
2.4
0.8
0.9
2.1
2.2
1.4
8.2
3+ Days Rest
2
24.5
2.5-6.5
38.5
1.5-4.0
37.5
1.0-1.0
100.0
1.5
4.0
5.5
0.5
1.5
2.0
3.0
2.5
7.5
Month
Split
GP
MIN
FG
FG%
3PT
3P%
FT
FT%
OR
DR
REB
AST
BLK
STL
PF
TO
PTS
October
6
25.2
3.2-6.2
51.4
2.2-4.5
48.1
1.0-1.2
85.7
0.5
1.3
1.8
0.8
0.7
1.8
2.5
1.2
9.5
November
8
24.0
2.0-5.4
37.2
1.4-4.3
32.4
0.5-0.5
100.0
0.6
2.0
2.6
1.1
1.1
2.5
1.6
1.4
5.9
Pre All-Star
14
24.6
2.5-5.7
43.8
1.7-4.4
39.3
0.7-0.8
90.9
0.6
1.7
2.3
1.0
0.9
2.2
2.0
1.3
7.4
Result
Split
GP
MIN
FG
FG%
3PT
3P%
FT
FT%
OR
DR
REB
AST
BLK
STL
PF
TO
PTS
Wins
12
24.5
2.6-5.8
44.9
1.8-4.5
40.7
0.4-0.5
83.3
0.5
1.8
2.3
1.1
1.1
2.3
1.8
1.2
7.4
Losses
2
25.0
2.0-5.5
36.4
1.0-3.5
28.6
2.5-2.5
100.0
1.0
1.5
2.5
0.5
0.0
1.5
3.5
2.0
7.5
Position
Split
GP
MIN
FG
FG%
3PT
3P%
FT
FT%
OR
DR
REB
AST
BLK
STL
PF
TO
PTS
As Starter
14
24.6
2.5-5.7
43.8
1.7-4.4
39.3
0.7-0.8
90.9
0.6
1.7
2.3
1.0
0.9
2.2
2.0
1.3
7.4
Day
Split
GP
MIN
FG
FG%
3PT
3P%
FT
FT%
OR
DR
REB
AST
BLK
STL
PF
TO
PTS
Monday
2
21.0
2.0-5.5
36.4
2.0-5.5
36.4
0.0-0.0
0.0
0.0
0.5
0.5
1.5
1.0
1.5
1.5
1.0
6.0
Tuesday
1
22.0
2.0-5.0
40.0
1.0-4.0
25.0
0.0-0.0
0.0
0.0
2.0
2.0
1.0
0.0
0.0
3.0
3.0
5.0
Wednesday
4
24.5
2.5-5.3
47.6
2.0-4.0
50.0
0.3-0.5
50.0
0.8
1.8
2.5
1.0
1.3
2.0
1.5
1.3
7.3
Friday
3
25.3
2.3-5.0
46.7
1.3-3.3
40.0
2.3-2.3
100.0
1.0
1.0
2.0
0.7
0.3
2.7
2.7
1.0
8.3
Sunday
4
26.3
3.0-7.0
42.9
1.8-5.0
35.0
0.5-0.5
100.0
0.5
2.8
3.3
1.0
1.3
3.0
2.0
1.3
8.3
Opponent
Split
GP
MIN
FG
FG%
3PT
3P%
FT
FT%
OR
DR
REB
AST
BLK
STL
PF
TO
PTS
Atlanta Hawks
1
23.0
2.0-5.0
40.0
2.0-5.0
40.0
0.0-0.0
0.0
0.0
0.0
0.0
1.0
1.0
3.0
0.0
1.0
6.0
Detroit Pistons
1
28.0
2.0-5.0
40.0
0.0-3.0
0.0
0.0-0.0
0.0
0.0
2.0
2.0
0.0
0.0
4.0
3.0
0.0
4.0
Golden State Warriors
2
25.5
1.5-5.0
30.0
1.0-2.5
40.0
2.5-2.5
100.0
1.5
1.5
3.0
0.5
0.5
2.0
3.5
1.0
6.5
Los Angeles Clippers
2
26.0
5.0-7.0
71.4
3.5-5.5
63.6
0.5-1.0
50.0
0.0
1.0
1.0
1.0
1.0
2.0
2.0
1.0
14.0
Miami Heat
1
19.0
2.0-6.0
33.3
2.0-6.0
33.3
0.0-0.0
0.0
0.0
1.0
1.0
2.0
1.0
0.0
3.0
1.0
6.0
Milwaukee Bucks
1
23.0
3.0-6.0
50.0
2.0-4.0
50.0
0.0-0.0
0.0
1.0
4.0
5.0
1.0
1.0
3.0
1.0
2.0
8.0
Phoenix Suns
1
26.0
4.0-9.0
44.4
2.0-6.0
33.3
2.0-2.0
100.0
2.0
6.0
8.0
0.0
2.0
3.0
3.0
4.0
12.0
Portland Trail Blazers
2
23.0
1.0-3.0
33.3
0.5-2.5
20.0
1.0-1.0
100.0
0.5
1.5
2.0
0.5
0.0
1.5
2.5
2.5
3.5
Sacramento Kings
1
23.0
1.0-5.0
20.0
1.0-5.0
20.0
0.0-0.0
0.0
1.0
0.0
1.0
2.0
2.0
2.0
0.0
0.0
3.0
Toronto Raptors
1
25.0
2.0-6.0
33.3
2.0-4.0
50.0
0.0-0.0
0.0
0.0
2.0
2.0
3.0
2.0
2.0
1.0
1.0
6.0
Utah Jazz
1
26.0
4.0-8.0
50.0
3.0-7.0
42.9
0.0-0.0
0.0
0.0
1.0
1.0
1.0
1.0
3.0
1.0
0.0
11.0
07 / SEASON-BY-SEASON HISTORY
Career statistics
Regular Season Averages
Season
Team
GP
GS
MIN
FG
FG%
3PT
3P%
FT
FT%
OR
DR
REB
AST
BLK
STL
PF
TO
PTS
2019-20
Philadelphia 76ers
65
14
19.8
1.7-4.1
42.3
0.9-2.4
35.7
0.4-0.6
61.0
0.7
1.0
1.6
1.2
0.7
1.4
2.2
0.8
4.7
2020-21
Philadelphia 76ers
65
8
20.0
1.6-3.7
42.0
0.7-2.2
30.1
0.1-0.3
44.4
0.5
1.4
1.9
1.0
1.1
1.6
2.0
0.5
3.9
2021-22
Philadelphia 76ers
66
50
25.5
2.3-4.5
50.0
0.7-2.2
31.3
0.5-0.7
79.1
0.6
1.7
2.3
1.1
1.1
1.7
2.4
0.6
5.7
2022-23
Philadelphia 76ers
49
6
12.1
1.0-2.4
43.1
0.4-1.3
33.3
0.2-0.2
75.0
0.4
0.9
1.3
0.5
0.3
0.9
1.3
0.2
2.7
2022-23
Portland Trail Blazers
22
22
27.7
2.7-6.2
43.8
1.5-3.9
38.8
0.5-0.7
62.5
0.9
2.6
3.5
1.4
0.8
1.7
2.2
0.7
7.4
2022-23
2022 23 Totals
71
28
16.9
1.5-3.6
43.5
0.8-2.1
36.5
0.3-0.4
67.9
0.6
1.4
2.0
0.7
0.5
1.2
1.6
0.3
4.1
2023-24
Portland Trail Blazers
65
19
22.9
1.9-4.9
39.7
1.2-3.6
34.6
0.3-0.4
75.9
0.5
1.6
2.1
1.4
0.8
1.7
1.4
0.6
5.4
2024-25
Portland Trail Blazers
15
5
20.8
2.8-5.9
47.7
1.4-3.2
43.8
0.5-1.0
46.7
0.9
2.5
3.5
1.9
0.6
2.2
0.9
0.9
7.5
2025-26
Portland Trail Blazers
30
0
16.0
1.9-4.5
43.3
1.2-3.1
39.8
0.7-0.8
84.0
0.6
1.4
2.0
0.9
0.5
2.0
1.4
0.9
5.8
2026-27
Los Angeles Lakers
14
14
24.6
2.5-5.7
43.8
1.7-4.4
39.3
0.7-0.8
90.9
0.6
1.7
2.3
1.0
0.9
2.2
2.0
1.3
7.4
Career
—
391
138
20.7
1.9-4.3
43.8
0.9-2.6
35.1
0.4-0.5
69.5
0.6
1.5
2.0
1.1
0.8
1.6
1.8
0.6
5.1
Regular Season Totals
Season
Team
FG
FG%
3PT
3P%
FT
FT%
OR
DR
REB
AST
BLK
STL
PF
TO
PTS
2019-20
Philadelphia 76ers
112-265
42.3
56-157
35.7
25-41
61.0
44
63
107
79
47
93
141
51
305
2020-21
Philadelphia 76ers
102-243
42.0
43-143
30.1
8-18
44.4
30
94
124
63
71
105
127
32
255
2021-22
Philadelphia 76ers
150-300
50.0
45-144
31.3
34-43
79.1
42
109
151
75
71
115
158
39
379
2022-23
Philadelphia 76ers
50-116
43.1
21-63
33.3
9-12
75.0
20
43
63
23
14
45
65
8
130
2022-23
Portland Trail Blazers
60-137
43.8
33-85
38.8
10-16
62.5
20
57
77
30
18
38
48
16
163
2022-23
2022 23 Totals
110-253
43.5
54-148
36.5
19-28
67.9
40
100
140
53
32
83
113
24
293
2023-24
Portland Trail Blazers
126-317
39.7
80-231
34.6
22-29
75.9
30
106
136
90
49
113
93
40
354
2024-25
Portland Trail Blazers
42-88
47.7
21-48
43.8
7-15
46.7
14
38
52
28
9
33
14
13
112
2025-26
Portland Trail Blazers
58-134
43.3
37-93
39.8
21-25
84.0
17
42
59
27
16
60
43
28
174
2026-27
Los Angeles Lakers
35-80
43.8
24-61
39.3
10-11
90.9
8
24
32
14
13
31
28
18
104
Career
—
735-1680
43.8
360-1025
35.1
146-210
69.5
225
576
801
429
308
633
717
245
1976
Regular Season Misc Totals
Season
Team
DD2
TD3
DQ
EJECT
TECH
FLAG
AST/TO
STL/TO
SC-EFF
SH-EFF
2019-20
Philadelphia 76ers
0
0
0
0
1
0
1.5
1.8
1.151
0.53
2020-21
Philadelphia 76ers
0
0
0
0
1
0
2.0
3.3
1.049
0.51
2021-22
Philadelphia 76ers
0
0
1
0
2
0
1.9
2.9
1.263
0.58
2022-23
Philadelphia 76ers
0
0
0
0
0
0
2.9
5.6
1.121
0.52
2022-23
Portland Trail Blazers
0
0
1
0
1
0
1.9
2.4
1.190
0.56
2022-23
2022 23 Totals
0
0
1
0
1
0
2.2
3.5
1.158
0.54
2023-24
Portland Trail Blazers
0
0
0
0
1
0
2.3
2.8
1.117
0.52
2024-25
Portland Trail Blazers
0
0
0
0
0
0
2.2
2.5
1.273
0.60
2025-26
Portland Trail Blazers
0
0
0
0
2
0
1.0
2.1
1.299
0.57
2026-27
Los Angeles Lakers
0
0
0
0
2
0
0.8
1.7
1.300
0.59
Career
—
0
0
2
0
10
0
1.8
2.6
1.176
0.54
Scoring, rebounding and assist trend
08 / SHOT CHART AND ZONE SHOOTING
Shot profile
Shot-location data is not connected. Add a BALLDONTLIE GOAT-tier NBA API key in NBA Players → Settings to enable shot charts and zone shooting.
LATEST UPDATEThybulle notched 12 points (4-9 FG, 2-6 3Pt, 2-2 FT), eight rebounds, three steals and two blocks across 26 minutes during Sunday's 131-123 victory over Phoenix.
With Austin Reaves (heel) sidelined, Thybulle attempted a few more shots than normal and scored in double figures for the first time this month. The veteran forward was also productive on the defensive end, as he led all players in steals. He has recorded multiple swipes in six straight games, averaging 5.8 points, 3.0 rebounds, 3.0 steals, 1.0 blocks and 0.7 assists across 24.5 minutes per contest during that span.




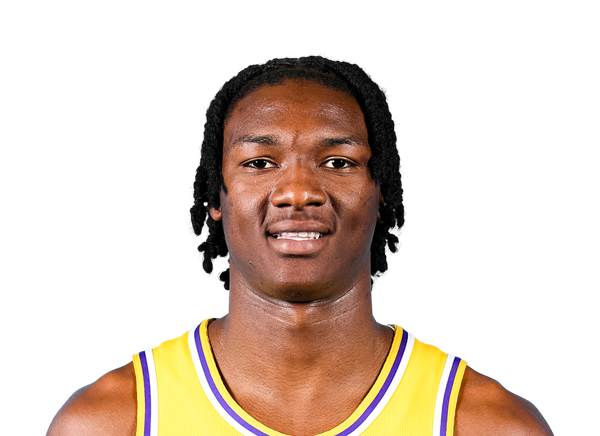 Adou ThieroF #1
 AK OkerekeF #31
 Aniwaniwa Tait-JonesG
 Anton WatsonF
 Arthur KalumaF #47
 Austin ReavesG #15
 Bronny JamesG #9
 Cameron CarrG #43
 Carson CooperC
 Chase RossG #29
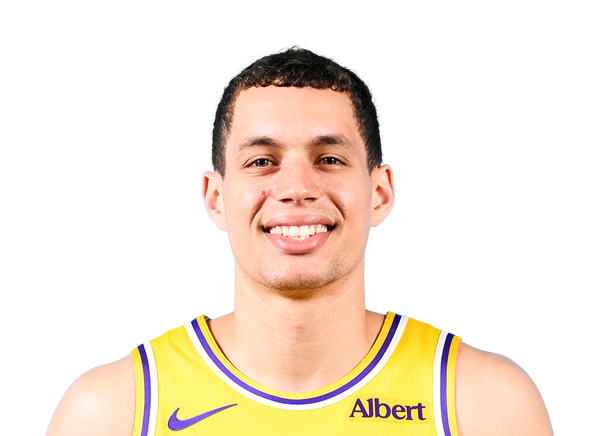 Chris ManonG #30
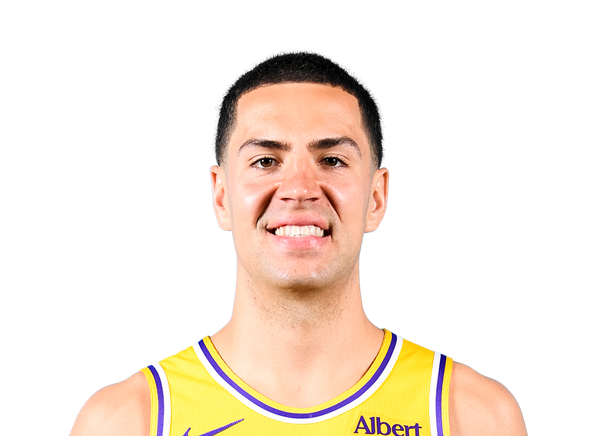 Cole SwiderF #41
 Collin SextonG #10
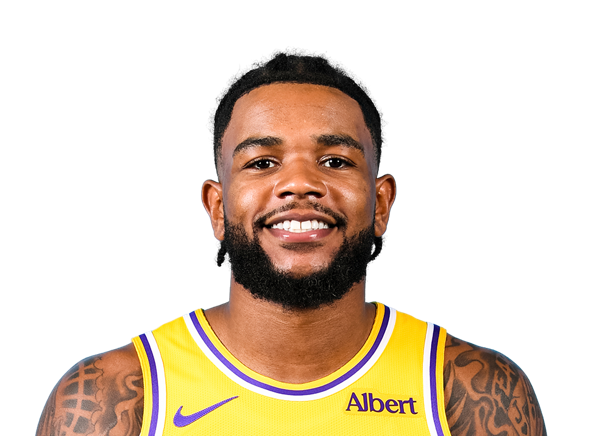 Jaden HardyG #7
 Jake LaRaviaF #12
 Jarred VanderbiltF #2
 Kevon LooneyF #55
 Lawson LoveringC
 Luka DoncicG #77
 Maxi KleberF #14
 Meechie JohnsonG
 Nick Smith Jr.G #20
 Quentin GrimesG #5
 Rafael CastroF
 Sandro MamukelashviliF #54
 Walker KesslerC #14
 William Kyle IIIF #45
 Ziaire WilliamsF #11