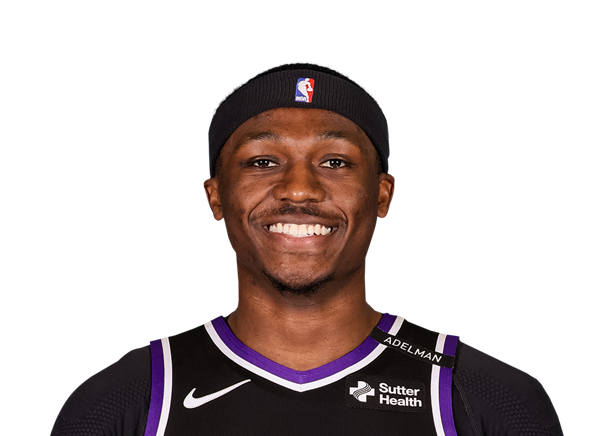
Click a season to open this player’s full game log, splits and advanced stats for that year; click a team to open its page. A dash means no NBA games were recorded.
03 / EVERY CATEGORY THE PROVIDER REPORTS
Full statistical breakdown
Regular season 2024-25
Defensive
Metric
Total
NBA rank
Blocks
0
Tied-519th
Defensive Rebounds
7
Tied-514th
Steals
0
Tied-541st
Defensive Rebound Rate
0.0
—
Defensive Rebounds Per Game
1.2
—
Blocks Per Game
0.0
—
Steals Per Game
0.0
—
Defensive Rebounds Per 48
4.7
Tied-3,084th
Blocks Per 48
0.0
Tied-3,114th
Steals Per 48
0.0
Tied-3,246th
General
Metric
Total
NBA rank
Disqualifications
0
Tied-1st
Flagrant Fouls
0
Tied-88th
Fouls
10
Tied-488th
Player Efficiency Rating
16.21
—
Rebound Rate
0.0
—
Ejections
0
Tied-66th
Technical Fouls
0
Tied-245th
Rebounds
11
—
Value Over Replacement Player
5.8
—
Minutes
72
8th
Minutes Per Game
12.0
—
Rating
11.3
Tied-621st
Plus-Minus
+29
Tied-1st
Rebounds Per Game
1.8
—
Fouls Per Game
1.7
—
Flagrant Fouls Per Game
0.0
—
Technical Fouls Per Game
0.0
—
Ejections Per Game
0.0
—
Disqualifications Per Game
0.0
—
Assist To Turnover Ratio
0.5
—
Steal To Foul Ratio
0.0
—
Block To Foul Ratio
0.0
—
Team Rebounds Per Game
0.0
—
Rebounds
11
—
Total Technical Fouls
0
—
Assist To Turnover Ratio
0.0
—
Steal To Turnover Ratio
0.0
—
Rebounds Per 48 Minutes
7.3
—
Fouls Per 48 Minutes
6.7
Tied-2,928th
Flagrant Fouls Per 48 Minutes
0.0
Tied-528th
Technical Fouls Per 48 Minutes
0.0
Tied-1,470th
Ejections Per 48 Minutes
0.0
Tied-396th
Disqualifications Per 48 Minutes
0.0
Tied-6th
R/40
6.1
—
Games Played
6
6th
Games Started
0
Tied-434th
Double Double
0
Tied-281st
Triple Double
0
Tied-44th
Offensive
Metric
Total
NBA rank
Assists
2
Tied-530th
Effective Field Goal Percentage
82.0
—
Field Goals
16/25
—
Field Goals Attempted
25
505th
Field Goals Made
16
Tied-481st
Field Goal Percentage
64.0
—
Free Throws
2/2
—
Free Throw Percentage
100.0
—
Free Throws Attempted
2
Tied-519th
Free Throws Made
2
Tied-508th
Offensive Rebounds
4
Tied-491st
Points
43
Tied-481st
Turnovers
4
Tied-497th
3-Point Field Goal Percentage
52.9
—
3-Point Field Goals Attempted
17
Tied-443rd
3-Point Field Goals Made
9
Tied-401st
True Shooting Percentage
83.1
—
Total Turnovers
4
—
Assist Ratio
6.3
—
Points in the Paint
0
Tied-1st
Offensive Rebound Rate
0.0
—
Turnover Ratio
12.5
—
Brick Index
0.00
—
Usage Rate
0.0
—
Average Field Goals Made
2.7
—
Average Field Goals Attempted
4.2
—
Average 3-Point Field Goals Made
1.5
—
Average 3-Point Field Goals Attempted
2.8
—
Average Free Throws Made
0.3
—
Average Free Throws Attempted
0.3
—
Points Per Game
7.2
—
Offensive Rebounds Per Game
0.7
—
Assists Per Game
0.3
—
Turnovers Per Game
0.7
—
Offensive Rebound Percentage
0.4
—
Estimated Possessions
25.8
—
Estimated Possessions Per Game
4.3
—
Points Per Estimated Possession
1.7
—
Team Turnovers Per Game
0.0
—
Total Turnovers Per Game
0.7
—
3-Point Field Goal Percentage
52.9
—
2-Point Field Goals Made
7.0
Tied-80th
2-Point Field Goals Attempted
8.0
948th
2-Point Field Goals Made per Game
1.2
—
2-Point Field Goals Attempted per Game
1.3
—
2-Point Field Goal Percentage
87.5
—
Shooting Efficiency
0.82
—
Scoring Efficiency
1.720
—
Fieldgoals Made Per 48
10.7
Tied-2,886th
Fieldgoals Attempted Per 48
16.7
3,030th
3-Point Fieldgoals Made Per 48
6.0
Tied-2,406th
3-Point Fieldgoals Attempted Per 48
11.3
Tied-2,658th
Freethrows Made Per 48
1.3
Tied-3,048th
Freethrows Attempted Per 48
1.3
Tied-3,114th
Points Scored Per 48
28.7
Tied-2,886th
Offensive Rebounds Per 48
2.7
Tied-2,946th
Assists Per 48
1.3
Tied-3,180th
Turnovers
2.7
Tied-2,982nd
P/40
23.9
—
A/40
1.1
—
04 / EFFICIENCY, SHOOTING PROFILE, PER-36
Advanced metrics
True shooting %83.1%
Effective FG %82.1%
2-point FG %85.7%
3-point attempt rate66.7%
Free throw rate7.1%
Points per shot attempt1.71
% of points from 3s62.5%
Assist-to-turnover0.43
Points per 36 min21.6
Rebounds per 36 min5.4
Assists per 36 min0.9
Steals per 36 min0.00
Blocks per 36 min0.00
Turnovers per 36 min2.10
Stocks (STL + BLK) per game0.00
Pts + Reb + Ast per game9.3
Efficiency (EFF) per game7.1
Game Score per game (Hollinger)5.0
Minutes per game12.0
Calculated by BallersCulture from the supplied 2024-25 box-score totals using standard formulas (hover a tile to see the formula). Tracking-based metrics such as BPM, VORP, on/off and RAPTOR are not available from this data source.
05 / 6 GAMES IN 2024-25
Game log: Regular season
Date
Opp
Result
MIN
FG
FG%
3PT
3P%
FT
FT%
REB
AST
BLK
STL
PF
TO
PTS
Apr 14
vs ORL
W 117-105
31
7-12
58.3
3-7
42.9
0-0
0.0
4
2
0
0
4
3
17
Apr 11
@ BKN
W 133-109
1
1-2
50.0
0-1
0.0
0-0
0.0
0
0
0
0
0
0
2
Apr 6
vs NY
L 121-105
5
0-1
0.0
0-1
0.0
0-0
0.0
2
0
0
0
1
0
0
Apr 2
vs POR
L 127-113
1
0-0
0.0
0-0
0.0
0-0
0.0
0
0
0
0
0
0
0
Jan 26
vs TOR
L 117-94
7
1-2
50.0
1-2
50.0
2-2
100.0
1
0
0
0
1
0
5
Jan 16
@ CHI
W 110-94
25
7-8
87.5
5-6
83.3
0-0
0.0
4
0
0
0
4
1
19
06 / 2024-25 HOME / AWAY, RESULTS, MONTHS AND OPPONENTS
4th in Eastern Conference Division · State Farm Arena
Overall40-42
Home21-19
Road19-22
DIV10-6
CONF30-22
Last Ten Games5-5
Team records for 2024-25 (regular season).
Team statistics 2024-25
Defensive
Metric
Total
Per game
NBA rank
Blocks
419
5.11
6th
Defensive Rebounds
2675
32.622
10th
Steals
798
9.732
1st
Points Conceded Off Turnovers
0
19
—
Defensive Rebound Rate
0.0
—
—
Defensive Rebounds Per Game
32.6
—
—
Blocks Per Game
5.1
—
—
Steals Per Game
9.7
—
—
Defensive Rebounds Per 48
0.0
—
—
Blocks Per 48
0.0
—
—
Steals Per 48
0.0
—
—
General
Metric
Total
Per game
NBA rank
Disqualifications
0
—
—
Flagrant Fouls
3
0.037
Tied-10th
Fouls
1564
19.073
6th
Rebound Rate
50.5
—
4th
Ejections
1
0.012
Tied-9th
Technical Fouls
106
0.659
4th
Rebounds
3649
44.5
—
Minutes
0
—
—
Minutes Per Game
0.0
—
—
Fantasy Rating
0.0
—
—
Rating
222.4
—
—
Plus-Minus
-1
-1
Tied-1st
Game Day of Year
0
—
—
Rebounds Per Game
44.5
—
—
Fouls Per Game
19.1
—
—
Flagrant Fouls Per Game
0.0
—
—
Technical Fouls Per Game
1.3
—
—
Ejections Per Game
0.0
—
—
Disqualifications Per Game
0.0
—
—
Assist To Turnover Ratio
2.0
2.013
—
Steal To Foul Ratio
0.5
0.51
—
Block To Foul Ratio
0.3
0.268
—
Team Rebounds Per Game
0.0
—
—
Rebounds
3649
44.5
—
Total Technical Fouls
106
0.659
—
Assist To Turnover Ratio
35.7
—
—
Team Rebounds
0
—
—
Steal To Turnover Ratio
0.7
0.662
—
Rebounds Per 48 Minutes
0.0
—
—
Fouls Per 48 Minutes
0.0
—
—
Flagrant Fouls Per 48 Minutes
0.0
—
—
Technical Fouls Per 48 Minutes
0.0
—
—
Ejections Per 48 Minutes
0.0
—
—
Disqualifications Per 48 Minutes
0.0
—
—
Games Played
82
—
Tied-1st
Games Started
0
—
—
Double Double
0
—
—
Triple Double
0
—
—
Offensive
Metric
Total
Per game
NBA rank
Assists
2426
29.585
1st
Effective Field Goal Percentage
54.6
—
8th
Field Goals
3556/7528
0.472
—
Field Goals Attempted
7528
91.805
2nd
Field Goals Made
3556
43.366
3rd
Field Goal Percentage
47.2
0.472
6th
Free Throws
1472/1900
0.775
—
Free Throw Percentage
77.5
0.775
11th
Free Throws Attempted
1900
23.171
1st
Free Throws Made
1472
17.951
1st
Offensive Rebounds
974
11.878
3rd
Points
9691
118.183
2nd
Turnovers
1205
14.695
3rd
3-Point Field Goal Percentage
35.8
0.358
9th
3-Point Field Goals Attempted
3089
37.671
7th
3-Point Field Goals Made
1107
13.5
7th
True Shooting Percentage
57.9
—
8th
Team Turnovers
68
—
6th
Total Turnovers
1273
14.695
—
Assist Ratio
20.1
—
3rd
Points in the Paint
4520
55
1st
Offensive Rebound Rate
26.3
—
3rd
Turnover Ratio
13.2
—
5th
Fast Break Points
1407
—
—
Possessions
8663
—
1st
Pace Factor
105.2
—
2nd
Average Field Goals Made
43.4
—
—
Average Field Goals Attempted
91.8
—
—
Average 3-Point Field Goals Made
13.5
—
—
Average 3-Point Field Goals Attempted
37.7
—
—
Average Free Throws Made
18.0
—
—
Average Free Throws Attempted
23.2
—
—
Points Per Game
118.2
—
—
Offensive Rebounds Per Game
11.9
—
—
Assists Per Game
29.6
—
—
Turnovers Per Game
14.7
—
—
Offensive Rebound Percentage
0.2
0.245
—
Estimated Possessions
8587.0
103.89
—
Estimated Possessions Per Game
104.7
—
—
Points Per Estimated Possession
1.1
1.138
—
Team Turnovers Per Game
0.8
—
—
Total Turnovers Per Game
15.5
—
—
3-Point Field Goal Percentage
35.8
0.358
1st
2-Point Field Goals Made
2449.0
29.866
Tied-4th
2-Point Field Goals Attempted
4439.0
54.134
Tied-5th
2-Point Field Goals Made per Game
29.9
—
—
2-Point Field Goals Attempted per Game
54.1
—
—
2-Point Field Goal Percentage
55.2
0.552
—
Shooting Efficiency
0.55
0.546
—
Scoring Efficiency
1.287
1.287
—
Fieldgoals Made Per 48
0.0
—
—
Fieldgoals Attempted Per 48
0.0
—
—
3-Point Fieldgoals Made Per 48
0.0
—
—
3-Point Fieldgoals Attempted Per 48
0.0
—
—
Freethrows Made Per 48
0.0
—
—
Freethrows Attempted Per 48
0.0
—
—
Points Scored Per 48
0.0
—
—
Offensive Rebounds Per 48
0.0
—
—
Assists Per 48
0.0
—
—
Turnovers
0.0
—
—
09 / SALARY BY SEASON
Contract
No contract is on file for this player yet.
10 / LATEST REPORT
Injury status
No current injury report entry for this player.
11 / SIGNINGS, TRADES AND ROSTER MOVES
Transactions
No recorded transactions for this player.
12 / LATEST COVERAGE
Player news
LATEST UPDATEPlowden (illness) isn't listed on the injury report for Friday's game against the Spurs.
Plowden was held out of Wednesday's loss to the Lakers due to an illness, though he'll be available to play Friday. Although he's averaged 12.2 minutes per game through six regular-season outings, the 28-year-old wing has totaled just seven minutes across his last two appearances. He isn't guaranteed to see meaningful burn against San Antonio.