Click a season to open this player’s full game log, splits and advanced stats for that year; click a team to open its page. A dash means no NBA games were recorded.
03 / EVERY CATEGORY THE PROVIDER REPORTS
Full statistical breakdown
Regular season 2026-27
Defensive
Metric
Total
NBA rank
Blocks
1
Tied-292nd
Defensive Rebounds
6
Tied-360th
Steals
3
Tied-300th
Defensive Rebound Rate
0.0
—
Defensive Rebounds Per Game
0.6
279th
Blocks Per Game
0.1
Tied-237th
Steals Per Game
0.3
256th
Defensive Rebounds Per 48
2.5
Tied-3,456th
Blocks Per 48
0.4
Tied-2,803rd
Steals Per 48
1.3
Tied-2,880th
General
Metric
Total
NBA rank
Disqualifications
0
Tied-22nd
Flagrant Fouls
0
Tied-24th
Fouls
9
Tied-323rd
Player Efficiency Rating
8.43
260th
Rebound Rate
0.0
—
Ejections
0
Tied-7th
Technical Fouls
0
Tied-104th
Rebounds
10
—
Value Over Replacement Player
-4.0
—
Minutes
114
5th
Minutes Per Game
11.4
—
Rating
5.5
Tied-184th
Plus-Minus
-55
Tied-1st
Rebounds Per Game
1.0
278th
Fouls Per Game
0.9
Tied-274th
Flagrant Fouls Per Game
0.0
Tied-21st
Technical Fouls Per Game
0.0
Tied-84th
Ejections Per Game
0.0
Tied-6th
Disqualifications Per Game
0.0
Tied-21st
Assist To Turnover Ratio
0.8
—
Steal To Foul Ratio
0.3
—
Block To Foul Ratio
0.1
—
Team Rebounds Per Game
0.0
—
Rebounds
10
—
Total Technical Fouls
0
—
Assist To Turnover Ratio
0.0
—
Steal To Turnover Ratio
0.8
—
Rebounds Per 48 Minutes
4.2
—
Fouls Per 48 Minutes
3.8
Tied-3,100th
Flagrant Fouls Per 48 Minutes
0.0
Tied-230th
Technical Fouls Per 48 Minutes
0.0
Tied-998th
Ejections Per 48 Minutes
0.0
Tied-67th
Disqualifications Per 48 Minutes
0.0
Tied-211th
R/40
3.5
—
Games Played
10
10th
Games Started
0
Tied-258th
Double Double
0
Tied-121st
Triple Double
0
Tied-13th
Offensive
Metric
Total
NBA rank
Assists
3
Tied-370th
Effective Field Goal Percentage
62.0
—
Field Goals
12/25
—
Field Goals Attempted
25
Tied-328th
Field Goals Made
12
Tied-321st
Field Goal Percentage
48.0
—
Free Throws
3/4
—
Free Throw Percentage
75.0
Tied-165th
Free Throws Attempted
4
Tied-338th
Free Throws Made
3
Tied-337th
Offensive Rebounds
4
Tied-305th
Points
34
Tied-320th
Turnovers
4
Tied-315th
3-Point Field Goal Percentage
36.8
Tied-112th
3-Point Field Goals Attempted
19
Tied-264th
3-Point Field Goals Made
7
Tied-242nd
True Shooting Percentage
63.5
—
Total Turnovers
4
—
Assist Ratio
8.9
—
Points in the Paint
0
Tied-1st
Offensive Rebound Rate
0.0
—
Turnover Ratio
11.8
—
Brick Index
0.00
—
Usage Rate
0.0
—
Average Field Goals Made
1.2
—
Average Field Goals Attempted
2.5
Tied-101st
Average 3-Point Field Goals Made
0.7
—
Average 3-Point Field Goals Attempted
1.9
227th
Average Free Throws Made
0.3
—
Average Free Throws Attempted
0.4
Tied-266th
Points Per Game
3.4
275th
Offensive Rebounds Per Game
0.4
Tied-245th
Assists Per Game
0.3
280th
Turnovers Per Game
0.4
262nd
Offensive Rebound Percentage
0.3
—
Estimated Possessions
26.6
—
Estimated Possessions Per Game
2.7
—
Points Per Estimated Possession
1.3
—
Team Turnovers Per Game
0.0
—
Total Turnovers Per Game
0.4
—
3-Point Field Goal Percentage
36.8
—
2-Point Field Goals Made
5.0
Tied-79th
2-Point Field Goals Attempted
6.0
Tied-64th
2-Point Field Goals Made per Game
0.5
—
2-Point Field Goals Attempted per Game
0.6
—
2-Point Field Goal Percentage
83.3
—
Shooting Efficiency
0.62
—
Scoring Efficiency
1.360
—
Fieldgoals Made Per 48
5.1
Tied-3,081st
Fieldgoals Attempted Per 48
10.5
Tied-3,148th
3-Point Fieldgoals Made Per 48
2.9
Tied-2,323rd
3-Point Fieldgoals Attempted Per 48
8.0
Tied-2,534th
Freethrows Made Per 48
1.3
Tied-3,235th
Freethrows Attempted Per 48
1.7
Tied-3,244th
Points Scored Per 48
14.3
Tied-3,072nd
Offensive Rebounds Per 48
1.7
Tied-2,928th
Assists Per 48
1.3
Tied-3,552nd
Turnovers
1.7
Tied-3,024th
P/40
11.9
—
A/40
1.1
—
04 / EFFICIENCY, SHOOTING PROFILE, PER-36
Advanced metrics
True shooting %63.5%
Effective FG %62.0%
2-point FG %83.3%
3-point attempt rate76.0%
Free throw rate16.0%
Points per shot attempt1.36
% of points from 3s61.8%
Assist-to-turnover0.75
Points per 36 min10.7
Rebounds per 36 min3.2
Assists per 36 min0.9
Steals per 36 min0.95
Blocks per 36 min0.32
Turnovers per 36 min1.26
Stocks (STL + BLK) per game0.40
Pts + Reb + Ast per game4.7
Efficiency (EFF) per game3.3
Game Score per game (Hollinger)2.4
Minutes per game11.4
Calculated by BallersCulture from the supplied 2026-27 box-score totals using standard formulas (hover a tile to see the formula). Tracking-based metrics such as BPM, VORP, on/off and RAPTOR are not available from this data source.
05 / 10 GAMES IN 2026-27
Game log: Regular season
Date
Opp
Result
MIN
FG
FG%
3PT
3P%
FT
FT%
REB
AST
BLK
STL
PF
TO
PTS
Nov 16
vs OKC
L 125-103
24
4-6
66.7
3-5
60.0
2-2
100.0
2
1
0
1
2
2
13
Nov 14
vs POR
L 120-107
2
0-1
0.0
0-1
0.0
0-0
0.0
0
0
0
0
0
0
0
Nov 11
vs ORL
L 107-100
2
0-0
0.0
0-0
0.0
0-0
0.0
0
0
0
0
0
1
0
Nov 9
vs MIA
L 114-108
12
2-4
50.0
2-4
50.0
0-0
0.0
0
0
0
0
0
0
6
Nov 3
@ DAL
W 115-100
3
0-2
0.0
0-2
0.0
1-2
50.0
1
0
0
0
0
0
1
Nov 1
@ MEM
L 136-105
4
2-3
66.7
0-1
0.0
0-0
0.0
0
0
0
0
2
0
4
Oct 28
@ SA
L 130-103
17
0-1
0.0
0-1
0.0
0-0
0.0
2
0
0
1
0
1
0
Oct 26
vs MEM
L 123-112
16
1-3
33.3
1-3
33.3
0-0
0.0
3
1
0
0
2
0
3
Oct 24
vs POR
L 128-120
20
1-2
50.0
1-2
50.0
0-0
0.0
0
0
1
0
2
0
3
Oct 22
@ LAC
L 121-96
13
2-3
66.7
0-0
0.0
0-0
0.0
2
1
0
1
1
0
4
06 / 2026-27 HOME / AWAY, RESULTS, MONTHS AND OPPONENTS
Splits
split
Split
GP
MIN
FG
FG%
3PT
3P%
FT
FT%
OR
DR
REB
AST
BLK
STL
PF
TO
PTS
All Splits
10
11.4
1.2-2.5
48.0
0.7-1.9
36.8
0.3-0.4
75.0
0.4
0.6
1.0
0.3
0.1
0.3
0.9
0.4
3.4
Home
6
12.8
1.3-2.7
50.0
1.2-2.5
46.7
0.3-0.3
100.0
0.3
0.5
0.8
0.3
0.2
0.2
1.0
0.5
4.2
Road
4
9.3
1.0-2.3
44.4
0.0-1.0
0.0
0.3-0.5
50.0
0.5
0.8
1.3
0.3
0.0
0.5
0.8
0.3
2.3
vs. Division
1
13.0
2.0-3.0
66.7
0.0-0.0
0.0
0.0-0.0
0.0
0.0
2.0
2.0
1.0
0.0
1.0
1.0
0.0
4.0
vs. Conference
8
12.5
1.3-2.6
47.6
0.6-1.9
33.3
0.4-0.5
75.0
0.5
0.8
1.3
0.4
0.1
0.4
1.1
0.4
3.5
3+ Days Rest
3
9.7
2.0-3.3
60.0
0.7-1.7
40.0
0.0-0.0
0.0
0.0
0.7
0.7
0.3
0.0
0.3
1.0
0.0
4.7
Month
Split
GP
MIN
FG
FG%
3PT
3P%
FT
FT%
OR
DR
REB
AST
BLK
STL
PF
TO
PTS
October
5
14.0
1.2-2.4
50.0
0.4-1.4
28.6
0.0-0.0
0.0
0.8
0.6
1.4
0.4
0.2
0.4
1.4
0.2
2.8
November
5
8.6
1.2-2.6
46.2
1.0-2.4
41.7
0.6-0.8
75.0
0.0
0.6
0.6
0.2
0.0
0.2
0.4
0.6
4.0
Pre All-Star
10
11.4
1.2-2.5
48.0
0.7-1.9
36.8
0.3-0.4
75.0
0.4
0.6
1.0
0.3
0.1
0.3
0.9
0.4
3.4
Result
Split
GP
MIN
FG
FG%
3PT
3P%
FT
FT%
OR
DR
REB
AST
BLK
STL
PF
TO
PTS
Wins
1
3.0
0.0-2.0
0.0
0.0-2.0
0.0
1.0-2.0
50.0
0.0
1.0
1.0
0.0
0.0
0.0
0.0
0.0
1.0
Losses
9
12.3
1.3-2.6
52.2
0.8-1.9
41.2
0.2-0.2
100.0
0.4
0.6
1.0
0.3
0.1
0.3
1.0
0.4
3.7
Day
Split
GP
MIN
FG
FG%
3PT
3P%
FT
FT%
OR
DR
REB
AST
BLK
STL
PF
TO
PTS
Monday
1
3.0
0.0-2.0
0.0
0.0-2.0
0.0
1.0-2.0
50.0
0.0
1.0
1.0
0.0
0.0
0.0
0.0
0.0
1.0
Tuesday
2
9.5
0.0-0.5
0.0
0.0-0.5
0.0
0.0-0.0
0.0
1.0
0.0
1.0
0.0
0.0
0.5
0.0
1.0
0.0
Wednesday
1
13.0
2.0-3.0
66.7
0.0-0.0
0.0
0.0-0.0
0.0
0.0
2.0
2.0
1.0
0.0
1.0
1.0
0.0
4.0
Friday
2
11.5
0.5-1.5
33.3
0.5-1.5
33.3
0.0-0.0
0.0
0.0
0.0
0.0
0.0
0.5
0.0
1.0
0.0
1.5
Saturday
1
4.0
2.0-3.0
66.7
0.0-1.0
0.0
0.0-0.0
0.0
0.0
0.0
0.0
0.0
0.0
0.0
2.0
0.0
4.0
Sunday
3
17.3
2.3-4.3
53.8
2.0-4.0
50.0
0.7-0.7
100.0
0.7
1.0
1.7
0.7
0.0
0.3
1.3
0.7
7.3
Opponent
Split
GP
MIN
FG
FG%
3PT
3P%
FT
FT%
OR
DR
REB
AST
BLK
STL
PF
TO
PTS
Dallas Mavericks
1
3.0
0.0-2.0
0.0
0.0-2.0
0.0
1.0-2.0
50.0
0.0
1.0
1.0
0.0
0.0
0.0
0.0
0.0
1.0
Los Angeles Clippers
1
13.0
2.0-3.0
66.7
0.0-0.0
0.0
0.0-0.0
0.0
0.0
2.0
2.0
1.0
0.0
1.0
1.0
0.0
4.0
Memphis Grizzlies
2
10.0
1.5-3.0
50.0
0.5-2.0
25.0
0.0-0.0
0.0
1.0
0.5
1.5
0.5
0.0
0.0
2.0
0.0
3.5
Miami Heat
1
12.0
2.0-4.0
50.0
2.0-4.0
50.0
0.0-0.0
0.0
0.0
0.0
0.0
0.0
0.0
0.0
0.0
0.0
6.0
Orlando Magic
1
2.0
0.0-0.0
0.0
0.0-0.0
0.0
0.0-0.0
0.0
0.0
0.0
0.0
0.0
0.0
0.0
0.0
1.0
0.0
Portland Trail Blazers
2
11.5
0.5-1.5
33.3
0.5-1.5
33.3
0.0-0.0
0.0
0.0
0.0
0.0
0.0
0.5
0.0
1.0
0.0
1.5
San Antonio Spurs
1
17.0
0.0-1.0
0.0
0.0-1.0
0.0
0.0-0.0
0.0
2.0
0.0
2.0
0.0
0.0
1.0
0.0
1.0
0.0
Oklahoma City Thunder
1
24.0
4.0-6.0
66.7
3.0-5.0
60.0
2.0-2.0
100.0
0.0
2.0
2.0
1.0
0.0
1.0
2.0
2.0
13.0
07 / SEASON-BY-SEASON HISTORY
Career statistics
Regular Season Averages
Season
Team
GP
GS
MIN
FG
FG%
3PT
3P%
FT
FT%
OR
DR
REB
AST
BLK
STL
PF
TO
PTS
2024-25
Atlanta Hawks
6
0
12.0
2.7-4.2
64.0
1.5-2.8
52.9
0.3-0.3
100.0
0.7
1.2
1.8
0.3
0.0
0.0
1.7
0.7
7.2
2025-26
Sacramento Kings
32
7
26.4
3.8-8.7
43.0
1.9-5.8
33.3
1.3-1.5
85.7
1.0
2.0
3.0
1.3
0.2
0.7
2.4
0.8
10.8
2026-27
Sacramento Kings
10
0
11.4
1.2-2.5
48.0
0.7-1.9
36.8
0.3-0.4
75.0
0.4
0.6
1.0
0.3
0.1
0.3
0.9
0.4
3.4
Career
—
48
7
21.5
3.1-6.9
45.0
1.6-4.6
35.1
1.0-1.1
85.5
0.9
1.6
2.5
1.0
0.2
0.5
2.0
0.7
8.8
Regular Season Totals
Season
Team
FG
FG%
3PT
3P%
FT
FT%
OR
DR
REB
AST
BLK
STL
PF
TO
PTS
2024-25
Atlanta Hawks
16-25
64.0
9-17
52.9
2-2
100.0
4
7
11
2
0
0
10
4
43
2025-26
Sacramento Kings
120-279
43.0
62-186
33.3
42-49
85.7
33
64
97
41
7
23
78
26
344
2026-27
Sacramento Kings
12-25
48.0
7-19
36.8
3-4
75.0
4
6
10
3
1
3
9
4
34
Career
—
148-329
45.0
78-222
35.1
47-55
85.5
41
77
118
46
8
26
97
34
421
Regular Season Misc Totals
Season
Team
DD2
TD3
DQ
EJECT
TECH
FLAG
AST/TO
STL/TO
SC-EFF
SH-EFF
2024-25
Atlanta Hawks
0
0
0
0
0
0
0.5
0.0
1.720
0.82
2025-26
Sacramento Kings
0
0
0
0
0
0
1.6
0.9
1.233
0.54
2026-27
Sacramento Kings
0
0
0
0
0
0
0.8
0.8
1.360
0.62
Career
—
0
0
0
0
0
0
1.4
0.8
1.280
0.57
Scoring, rebounding and assist trend
08 / SHOT CHART AND ZONE SHOOTING
Shot profile
Shot-location data is not connected. Add a BALLDONTLIE GOAT-tier NBA API key in NBA Players → Settings to enable shot charts and zone shooting.
LATEST UPDATEPlowden (illness) isn't listed on the injury report for Friday's game against the Spurs.
Plowden was held out of Wednesday's loss to the Lakers due to an illness, though he'll be available to play Friday. Although he's averaged 12.2 minutes per game through six regular-season outings, the 28-year-old wing has totaled just seven minutes across his last two appearances. He isn't guaranteed to see meaningful burn against San Antonio.



 Aaron NkrumahG
 Adam FlaglerG #20
 Alex KarabanF #33
 Ben SimmonsG #25
 Damari MonsantoG
 Darius Acuff Jr.G #5
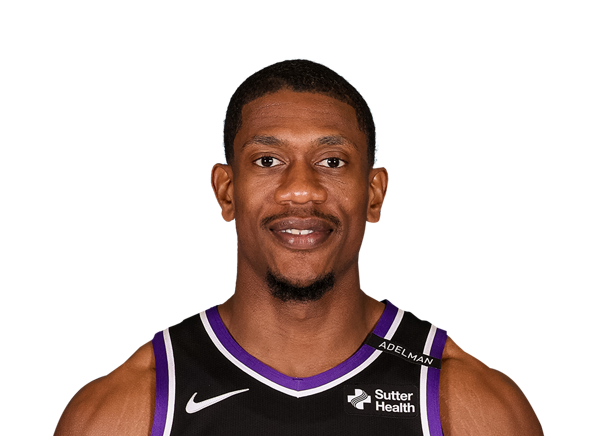 De’Andre HunterF #15
 Domantas SabonisF #11
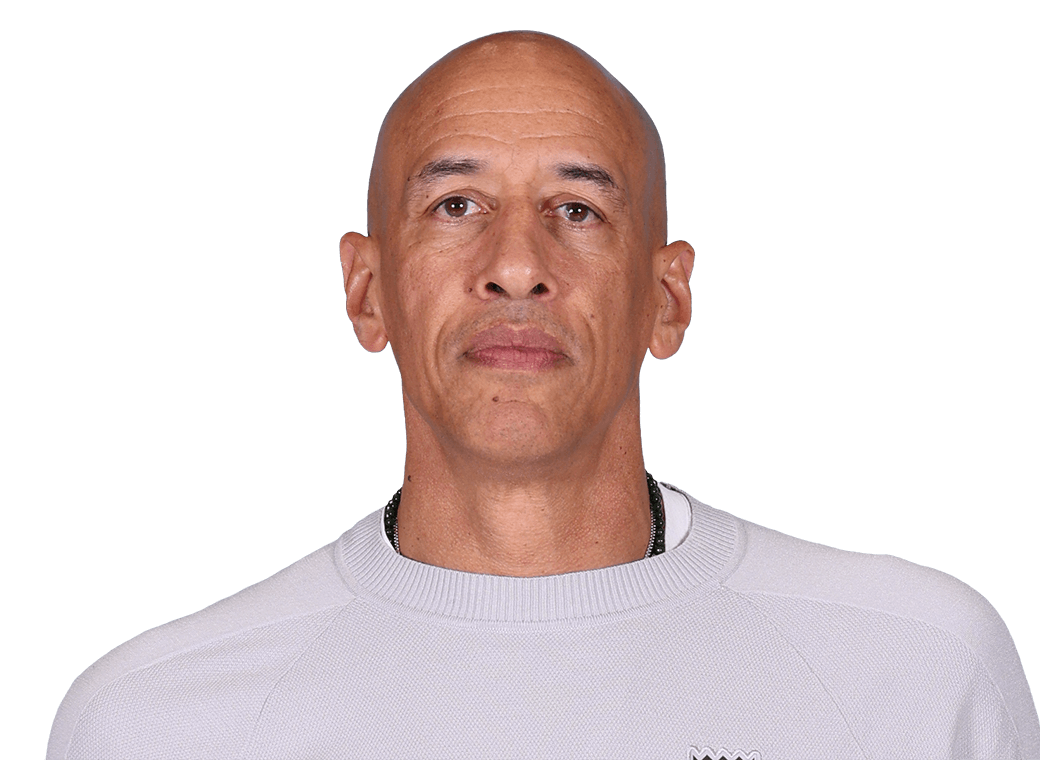 Doug ChristieG
 Doug McDermottF #7
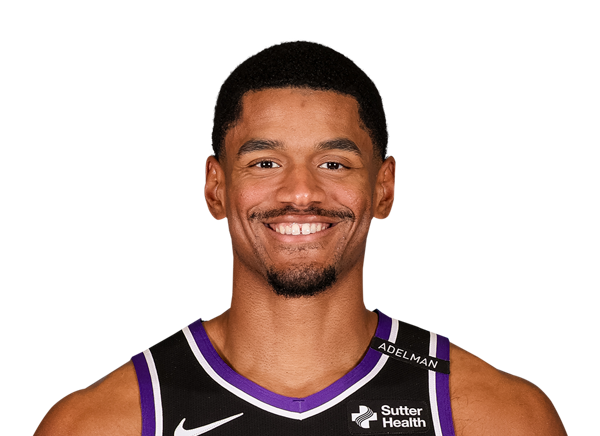 Dylan CardwellC #32
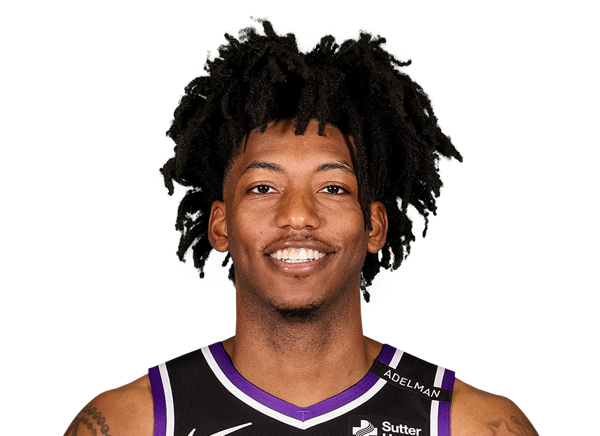 Elfrid PaytonG #3
 Emanuel SharpG #34
 Jonathan MogboF #22
 Keegan MurrayF #13
 Killian HayesG #3
 Leaky BlackF #19
 Malik MonkG
 Mason PlumleeC
 Maxime RaynaudC #42
 Patrick Baldwin Jr.G #23
 Precious AchiuwaF #9
 Russell WestbrookG #18
 Sean PedullaG #3
 Tristen NewtonG #00
 Viktor LakhinF
 Zach LaVineG #8