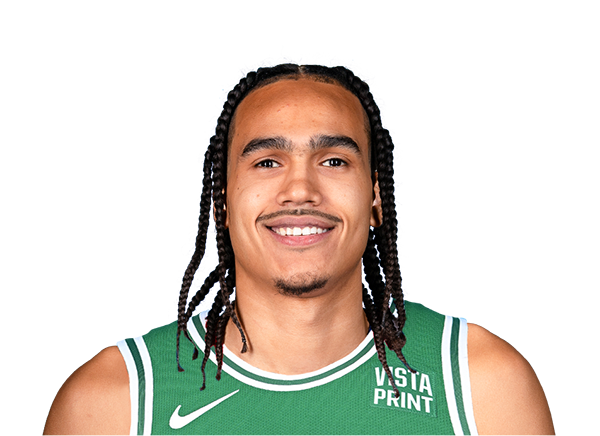
Click a season to open this player’s full game log, splits and advanced stats for that year; click a team to open its page. A dash means no NBA games were recorded.
03 / EVERY CATEGORY THE PROVIDER REPORTS
Full statistical breakdown
Regular season 2025-26
Defensive
Metric
Total
NBA rank
Blocks
5
Tied-397th
Defensive Rebounds
3
Tied-547th
Steals
2
Tied-516th
Defensive Rebound Rate
0.0
—
Defensive Rebounds Per Game
0.5
—
Blocks Per Game
0.8
—
Steals Per Game
0.3
—
Defensive Rebounds Per 48
2.3
Tied-2,917th
Blocks Per 48
3.9
Tied-2,117th
Steals Per 48
1.5
Tied-2,752nd
General
Metric
Total
NBA rank
Disqualifications
0
Tied-41st
Flagrant Fouls
0
Tied-116th
Fouls
3
Tied-548th
Player Efficiency Rating
7.05
—
Rebound Rate
4.5
—
Ejections
0
Tied-51st
Technical Fouls
0
Tied-269th
Rebounds
5
—
Value Over Replacement Player
0.0
—
Minutes
62
9th
Minutes Per Game
10.3
—
Rating
5.7
Tied-479th
Plus-Minus
-9
Tied-1st
Rebounds Per Game
0.8
—
Fouls Per Game
0.5
—
Flagrant Fouls Per Game
0.0
—
Technical Fouls Per Game
0.0
—
Ejections Per Game
0.0
—
Disqualifications Per Game
0.0
—
Assist To Turnover Ratio
1.4
—
Steal To Foul Ratio
0.7
—
Block To Foul Ratio
1.7
—
Team Rebounds Per Game
0.0
—
Rebounds
5
—
Total Technical Fouls
0
—
Assist To Turnover Ratio
0.0
—
Steal To Turnover Ratio
0.3
—
Rebounds Per 48 Minutes
3.9
—
Fouls Per 48 Minutes
2.3
Tied-2,922nd
Flagrant Fouls Per 48 Minutes
0.0
Tied-618th
Technical Fouls Per 48 Minutes
0.0
Tied-1,434th
Ejections Per 48 Minutes
0.0
Tied-272nd
Disqualifications Per 48 Minutes
0.0
Tied-218th
R/40
3.2
—
Games Played
6
6th
Games Started
0
Tied-450th
Double Double
0
Tied-284th
Triple Double
0
Tied-38th
Offensive
Metric
Total
NBA rank
Assists
11
Tied-478th
Effective Field Goal Percentage
33.3
—
Field Goals
4/12
—
Field Goals Attempted
12
Tied-536th
Field Goals Made
4
Tied-544th
Field Goal Percentage
33.3
—
Free Throws
4/4
—
Free Throw Percentage
100.0
—
Free Throws Attempted
4
Tied-515th
Free Throws Made
4
Tied-501st
Offensive Rebounds
2
Tied-521st
Points
12
Tied-545th
Turnovers
8
Tied-474th
3-Point Field Goal Percentage
0.0
—
3-Point Field Goals Attempted
1
Tied-534th
3-Point Field Goals Made
0
Tied-517th
True Shooting Percentage
43.6
—
Total Turnovers
8
—
Assist Ratio
33.6
—
Points in the Paint
0
Tied-1st
Offensive Rebound Rate
3.7
—
Turnover Ratio
24.4
—
Brick Index
0.00
—
Usage Rate
0.0
—
Average Field Goals Made
0.7
—
Average Field Goals Attempted
2.0
—
Average 3-Point Field Goals Made
0.0
—
Average 3-Point Field Goals Attempted
0.2
—
Average Free Throws Made
0.7
—
Average Free Throws Attempted
0.7
—
Points Per Game
2.0
—
Offensive Rebounds Per Game
0.3
—
Assists Per Game
1.8
—
Turnovers Per Game
1.3
—
Offensive Rebound Percentage
0.3
—
Estimated Possessions
19.6
—
Estimated Possessions Per Game
3.3
—
Points Per Estimated Possession
0.6
—
Team Turnovers Per Game
0.0
—
Total Turnovers Per Game
1.3
—
3-Point Field Goal Percentage
0.0
—
2-Point Field Goals Made
4.0
Tied-27th
2-Point Field Goals Attempted
11.0
Tied-2nd
2-Point Field Goals Made per Game
0.7
—
2-Point Field Goals Attempted per Game
1.8
—
2-Point Field Goal Percentage
36.4
—
Shooting Efficiency
0.33
—
Scoring Efficiency
1.000
—
Fieldgoals Made Per 48
3.1
Tied-2,901st
Fieldgoals Attempted Per 48
9.3
Tied-2,858th
3-Point Fieldgoals Made Per 48
0.0
Tied-2,757th
3-Point Fieldgoals Attempted Per 48
0.8
Tied-2,848th
Freethrows Made Per 48
3.1
Tied-2,672nd
Freethrows Attempted Per 48
3.1
Tied-2,746th
Points Scored Per 48
9.3
Tied-2,906th
Offensive Rebounds Per 48
1.5
Tied-2,778th
Assists Per 48
8.5
Tied-2,549th
Turnovers
6.2
Tied-2,528th
P/40
7.7
—
A/40
7.1
—
Playoffs 2025-26
Defensive
Metric
Total
NBA rank
Blocks
0
Tied-154th
Defensive Rebounds
0
Tied-210th
Steals
0
Tied-182nd
Defensive Rebound Rate
0.0
—
Defensive Rebounds Per Game
0.0
—
Blocks Per Game
0.0
—
Steals Per Game
0.0
—
Defensive Rebounds Per 48
0.0
2,520th
Blocks Per 48
0.0
1,848th
Steals Per 48
0.0
2,184th
General
Metric
Total
NBA rank
Disqualifications
0
Tied-9th
Flagrant Fouls
0
Tied-18th
Fouls
0
Tied-206th
Player Efficiency Rating
0.00
—
Rebound Rate
0.0
—
Ejections
0
Tied-7th
Technical Fouls
0
Tied-63rd
Rebounds
0
—
Value Over Replacement Player
0.0
—
Minutes
4
Tied-4th
Minutes Per Game
2.0
—
Rating
1.5
Tied-529th
Plus-Minus
+10
Tied-1st
Rebounds Per Game
0.0
—
Fouls Per Game
0.0
—
Flagrant Fouls Per Game
0.0
—
Technical Fouls Per Game
0.0
—
Ejections Per Game
0.0
—
Disqualifications Per Game
0.0
—
Assist To Turnover Ratio
0.0
—
Steal To Foul Ratio
0.0
—
Block To Foul Ratio
0.0
—
Team Rebounds Per Game
0.0
—
Rebounds
0
—
Total Technical Fouls
0
—
Assist To Turnover Ratio
0.0
—
Steal To Turnover Ratio
0.0
—
Rebounds Per 48 Minutes
0.0
—
Fouls Per 48 Minutes
0.0
2,472nd
Flagrant Fouls Per 48 Minutes
0.0
216th
Technical Fouls Per 48 Minutes
0.0
756th
Ejections Per 48 Minutes
0.0
84th
Disqualifications Per 48 Minutes
0.0
108th
R/40
0.0
—
Games Played
2
2nd
Games Started
0
Tied-104th
Double Double
0
Tied-49th
Triple Double
0
Tied-5th
Offensive
Metric
Total
NBA rank
Assists
0
Tied-200th
Effective Field Goal Percentage
100.0
—
Field Goals
1/1
—
Field Goals Attempted
1
Tied-217th
Field Goals Made
1
Tied-201st
Field Goal Percentage
100.0
—
Free Throws
0/0
—
Free Throw Percentage
0.0
—
Free Throws Attempted
0
Tied-187th
Free Throws Made
0
Tied-184th
Offensive Rebounds
0
Tied-191st
Points
2
Tied-204th
Turnovers
0
Tied-200th
3-Point Field Goal Percentage
0.0
—
3-Point Field Goals Attempted
0
Tied-198th
3-Point Field Goals Made
0
Tied-170th
True Shooting Percentage
100.0
—
Total Turnovers
0
—
Assist Ratio
0.0
—
Points in the Paint
0
Tied-1st
Offensive Rebound Rate
0.0
—
Turnover Ratio
0.0
—
Brick Index
0.00
—
Usage Rate
0.0
—
Average Field Goals Made
0.5
—
Average Field Goals Attempted
0.5
—
Average 3-Point Field Goals Made
0.0
—
Average 3-Point Field Goals Attempted
0.0
—
Average Free Throws Made
0.0
—
Average Free Throws Attempted
0.0
—
Points Per Game
1.0
—
Offensive Rebounds Per Game
0.0
—
Assists Per Game
0.0
—
Turnovers Per Game
0.0
—
Offensive Rebound Percentage
0.0
—
Estimated Possessions
1.0
—
Estimated Possessions Per Game
0.5
—
Points Per Estimated Possession
2.0
—
Team Turnovers Per Game
0.0
—
Total Turnovers Per Game
0.0
—
3-Point Field Goal Percentage
0.0
—
2-Point Field Goals Made
1.0
Tied-31st
2-Point Field Goals Attempted
1.0
Tied-19th
2-Point Field Goals Made per Game
0.5
—
2-Point Field Goals Attempted per Game
0.5
—
2-Point Field Goal Percentage
100.0
—
Shooting Efficiency
1.00
—
Scoring Efficiency
2.000
—
Fieldgoals Made Per 48
12.0
2,412th
Fieldgoals Attempted Per 48
12.0
2,604th
3-Point Fieldgoals Made Per 48
0.0
2,040th
3-Point Fieldgoals Attempted Per 48
0.0
2,376th
Freethrows Made Per 48
0.0
2,208th
Freethrows Attempted Per 48
0.0
2,244th
Points Scored Per 48
24.0
2,448th
Offensive Rebounds Per 48
0.0
2,292nd
Assists Per 48
0.0
2,400th
Turnovers
0.0
2,400th
P/40
20.0
—
A/40
0.0
—
04 / EFFICIENCY, SHOOTING PROFILE, PER-36
Advanced metrics
True shooting %43.3%
Effective FG %35.0%
2-point FG %38.9%
3-point attempt rate10.0%
Free throw rate35.0%
Points per shot attempt1.00
% of points from 3s0.0%
Assist-to-turnover1.38
Points per 36 min7.0
Rebounds per 36 min2.8
Assists per 36 min6.3
Steals per 36 min1.05
Blocks per 36 min2.80
Turnovers per 36 min4.54
Stocks (STL + BLK) per game1.10
Pts + Reb + Ast per game4.6
Efficiency (EFF) per game3.1
Game Score per game (Hollinger)1.9
Minutes per game10.3
Calculated by BallersCulture from the supplied 2025-26 box-score totals using standard formulas (hover a tile to see the formula). Tracking-based metrics such as BPM, VORP, on/off and RAPTOR are not available from this data source.
05 / 6 GAMES IN 2025-26
Game log: Regular season
Date
Opp
Result
MIN
FG
FG%
3PT
3P%
FT
FT%
REB
AST
BLK
STL
PF
TO
PTS
Apr 13
vs ORL
W 113-108
37
0-3
0.0
0-1
0.0
2-2
100.0
4
7
4
1
2
6
2
Feb 28
vs BKN
W 148-111
6
1-4
25.0
0-0
0.0
2-2
100.0
0
1
0
0
1
1
4
Feb 26
@ DEN
L 103-84
6
0-1
0.0
0-0
0.0
0-0
0.0
0
1
1
0
0
0
0
Feb 25
@ PHX
W 97-81
4
0-0
0.0
0-0
0.0
0-0
0.0
0
0
0
0
0
0
0
Feb 11
@ HOU
L 102-95
5
2-2
100.0
0-0
0.0
0-0
0.0
1
2
0
1
0
0
4
Feb 9
@ MIN
W 115-96
4
1-2
50.0
0-0
0.0
0-0
0.0
0
0
0
0
0
1
2
06 / 2 GAMES IN 2025-26
Game log: Playoffs
Date
Opp
Result
MIN
FG
FG%
3PT
3P%
FT
FT%
REB
AST
BLK
STL
PF
TO
PTS
May 1
@ PHI
L 106-93
1
1-1
100.0
0-0
0.0
0-0
0.0
0
0
0
0
0
0
2
Apr 27
@ PHI
W 128-96
3
0-0
0.0
0-0
0.0
0-0
0.0
0
0
0
0
0
0
0
07 / 2025-26 HOME / AWAY, RESULTS, MONTHS AND OPPONENTS
Splits
split
Split
GP
MIN
FG
FG%
3PT
3P%
FT
FT%
OR
DR
REB
AST
BLK
STL
PF
TO
PTS
All Splits
6
10.3
0.7-2.0
33.3
0.0-0.2
0.0
0.7-0.7
100.0
0.3
0.5
0.8
1.8
0.8
0.3
0.5
1.3
2.0
Home
2
21.0
0.5-3.5
14.3
0.0-0.5
0.0
2.0-2.0
100.0
0.5
1.5
2.0
4.0
2.0
0.5
1.5
3.5
3.0
Road
4
4.8
0.8-1.3
60.0
0.0-0.0
0.0
0.0-0.0
0.0
0.3
0.0
0.3
0.8
0.3
0.3
0.0
0.3
1.5
vs. Division
1
6.0
1.0-4.0
25.0
0.0-0.0
0.0
2.0-2.0
100.0
0.0
0.0
0.0
1.0
0.0
0.0
1.0
1.0
4.0
vs. Conference
4
13.0
1.0-2.8
36.4
0.0-0.3
0.0
1.0-1.0
100.0
0.5
0.8
1.3
2.5
1.0
0.5
0.8
2.0
3.0
3+ Days Rest
2
4.0
0.5-1.0
50.0
0.0-0.0
0.0
0.0-0.0
0.0
0.0
0.0
0.0
0.0
0.0
0.0
0.0
0.5
1.0
Month
Split
GP
MIN
FG
FG%
3PT
3P%
FT
FT%
OR
DR
REB
AST
BLK
STL
PF
TO
PTS
February
5
5.0
0.8-1.8
44.4
0.0-0.0
0.0
0.4-0.4
100.0
0.2
0.0
0.2
0.8
0.2
0.2
0.2
0.4
2.0
April
1
37.0
0.0-3.0
0.0
0.0-1.0
0.0
2.0-2.0
100.0
1.0
3.0
4.0
7.0
4.0
1.0
2.0
6.0
2.0
Pre All-Star
2
5.0
1.5-2.0
75.0
0.0-0.0
0.0
0.0-0.0
0.0
0.5
0.0
0.5
1.0
0.0
0.5
0.0
0.5
3.0
Post All-Star
4
13.0
0.3-2.0
12.5
0.0-0.3
0.0
1.0-1.0
100.0
0.3
0.8
1.0
2.3
1.3
0.3
0.8
1.8
1.5
Result
Split
GP
MIN
FG
FG%
3PT
3P%
FT
FT%
OR
DR
REB
AST
BLK
STL
PF
TO
PTS
Wins
4
12.8
0.5-2.3
22.2
0.0-0.3
0.0
1.0-1.0
100.0
0.3
0.8
1.0
2.0
1.0
0.3
0.8
2.0
2.0
Losses
2
5.5
1.0-1.5
66.7
0.0-0.0
0.0
0.0-0.0
0.0
0.5
0.0
0.5
1.5
0.5
0.5
0.0
0.0
2.0
Day
Split
GP
MIN
FG
FG%
3PT
3P%
FT
FT%
OR
DR
REB
AST
BLK
STL
PF
TO
PTS
Tuesday
2
4.5
1.0-1.0
100.0
0.0-0.0
0.0
0.0-0.0
0.0
0.5
0.0
0.5
1.0
0.0
0.5
0.0
0.0
2.0
Wednesday
1
6.0
0.0-1.0
0.0
0.0-0.0
0.0
0.0-0.0
0.0
0.0
0.0
0.0
1.0
1.0
0.0
0.0
0.0
0.0
Friday
1
6.0
1.0-4.0
25.0
0.0-0.0
0.0
2.0-2.0
100.0
0.0
0.0
0.0
1.0
0.0
0.0
1.0
1.0
4.0
Sunday
2
20.5
0.5-2.5
20.0
0.0-0.5
0.0
1.0-1.0
100.0
0.5
1.5
2.0
3.5
2.0
0.5
1.0
3.5
2.0
Opponent
Split
GP
MIN
FG
FG%
3PT
3P%
FT
FT%
OR
DR
REB
AST
BLK
STL
PF
TO
PTS
Brooklyn Nets
1
6.0
1.0-4.0
25.0
0.0-0.0
0.0
2.0-2.0
100.0
0.0
0.0
0.0
1.0
0.0
0.0
1.0
1.0
4.0
Denver Nuggets
1
6.0
0.0-1.0
0.0
0.0-0.0
0.0
0.0-0.0
0.0
0.0
0.0
0.0
1.0
1.0
0.0
0.0
0.0
0.0
Houston Rockets
1
5.0
2.0-2.0
100.0
0.0-0.0
0.0
0.0-0.0
0.0
1.0
0.0
1.0
2.0
0.0
1.0
0.0
0.0
4.0
Minnesota Timberwolves
1
4.0
1.0-2.0
50.0
0.0-0.0
0.0
0.0-0.0
0.0
0.0
0.0
0.0
0.0
0.0
0.0
0.0
1.0
2.0
Orlando Magic
1
37.0
0.0-3.0
0.0
0.0-1.0
0.0
2.0-2.0
100.0
1.0
3.0
4.0
7.0
4.0
1.0
2.0
6.0
2.0
Phoenix Suns
1
4.0
0.0-0.0
0.0
0.0-0.0
0.0
0.0-0.0
0.0
0.0
0.0
0.0
0.0
0.0
0.0
0.0
0.0
0.0
08 / SEASON-BY-SEASON HISTORY
Career statistics
Regular Season Averages
Season
Team
GP
GS
MIN
FG
FG%
3PT
3P%
FT
FT%
OR
DR
REB
AST
BLK
STL
PF
TO
PTS
2021-22
Toronto Raptors
64
1
10.9
1.3-3.2
41.1
0.2-0.8
25.5
0.4-0.7
59.1
0.6
1.3
1.9
1.5
0.2
0.4
1.1
0.8
3.2
2022-23
Toronto Raptors
31
2
9.0
1.8-4.2
42.3
0.5-1.6
29.4
0.5-0.8
70.8
0.4
1.1
1.5
1.2
0.4
0.4
1.1
0.6
4.6
2023-24
Boston Celtics
24
1
7.1
0.8-2.1
37.3
0.1-0.7
12.5
0.7-0.8
80.0
0.5
1.0
1.5
0.8
0.1
0.2
0.8
0.4
2.3
2023-24
Portland Trail Blazers
30
8
29.2
6.1-15.0
40.8
1.9-6.1
31.1
2.6-3.3
78.0
1.0
3.8
4.8
3.6
0.6
0.9
1.5
2.2
16.7
2023-24
2023 24 Totals
54
9
19.4
3.7-9.3
40.4
1.1-3.7
29.6
1.7-2.2
78.3
0.8
2.5
3.3
2.4
0.4
0.6
1.2
1.4
10.3
2024-25
Portland Trail Blazers
67
7
16.7
3.0-7.6
39.1
1.1-3.3
32.4
1.4-1.9
72.8
0.4
1.6
2.0
2.4
0.5
0.6
0.9
1.3
8.3
2025-26
La Clippers
2
0
5.0
1.5-2.0
75.0
0.0-0.0
0.0
0.0-0.0
0.0
0.5
0.0
0.5
1.0
0.0
0.5
0.0
0.5
3.0
2025-26
Boston Celtics
4
0
13.0
0.3-2.0
12.5
0.0-0.3
0.0
1.0-1.0
100.0
0.3
0.8
1.0
2.3
1.3
0.3
0.8
1.8
1.5
2025-26
2025 26 Totals
6
0
10.3
0.7-2.0
33.3
0.0-0.2
0.0
0.7-0.7
100.0
0.3
0.5
0.8
1.8
0.8
0.3
0.5
1.3
2.0
Career
—
222
19
14.4
2.4-6.1
40.1
0.7-2.4
30.3
1.0-1.4
73.2
0.5
1.6
2.2
2.0
0.4
0.5
1.0
1.1
6.6
Regular Season Totals
Season
Team
FG
FG%
3PT
3P%
FT
FT%
OR
DR
REB
AST
BLK
STL
PF
TO
PTS
2021-22
Toronto Raptors
83-202
41.1
13-51
25.5
26-44
59.1
38
86
124
99
10
28
68
53
205
2022-23
Toronto Raptors
55-130
42.3
15-51
29.4
17-24
70.8
11
34
45
36
13
13
34
18
142
2023-24
Boston Celtics
19-51
37.3
2-16
12.5
16-20
80.0
12
23
35
19
3
5
20
10
56
2023-24
Portland Trail Blazers
183-449
40.8
57-183
31.1
78-100
78.0
29
114
143
108
17
28
44
67
501
2023-24
2023 24 Totals
202-500
40.4
59-199
29.6
94-120
78.3
41
137
178
127
20
33
64
77
557
2024-25
Portland Trail Blazers
198-507
39.1
72-222
32.4
91-125
72.8
30
105
135
160
34
43
58
86
559
2025-26
La Clippers
3-4
75.0
0-0
0.0
0-0
0.0
1
0
1
2
0
1
0
1
6
2025-26
Boston Celtics
1-8
12.5
0-1
0.0
4-4
100.0
1
3
4
9
5
1
3
7
6
2025-26
2025 26 Totals
4-12
33.3
0-1
0.0
4-4
100.0
2
3
5
11
5
2
3
8
12
Career
—
542-1351
40.1
159-524
30.3
232-317
73.2
122
365
487
433
82
119
227
242
1475
Regular Season Misc Totals
Season
Team
DD2
TD3
DQ
EJECT
TECH
FLAG
AST/TO
STL/TO
SC-EFF
SH-EFF
2021-22
Toronto Raptors
0
0
0
0
0
0
1.9
0.5
1.015
0.44
2022-23
Toronto Raptors
0
0
0
0
0
0
2.0
0.7
1.092
0.48
2023-24
Boston Celtics
0
0
0
0
0
0
1.9
0.5
1.098
0.39
2023-24
Portland Trail Blazers
2
0
0
1
2
1
1.6
0.4
1.116
0.47
2023-24
2023 24 Totals
2
0
0
1
2
1
1.6
0.4
1.114
0.46
2024-25
Portland Trail Blazers
0
0
0
0
1
0
1.9
0.5
1.103
0.46
2025-26
La Clippers
0
0
0
0
0
0
2.0
1.0
1.500
0.75
2025-26
Boston Celtics
0
0
0
0
0
0
1.3
0.1
0.750
0.13
2025-26
2025 26 Totals
0
0
0
0
0
0
1.4
0.3
1.000
0.33
Career
—
2
0
0
1
3
1
1.8
0.5
1.092
0.46
Scoring, rebounding and assist trend
09 / RECORD, TEAM STATS AND TEAMMATES
Team
TEAM \u00b7 2025-26
2025 26 Totals
10 / SALARY BY SEASON
Contract
Season
Salary
2021-22
$925,258
2022-23
$1.56M
2023-24
$2.02M
2024-25
$2.2M
Total listed: $6.71M · source: espn.
11 / LATEST REPORT
Injury status
No current injury report entry for this player.
12 / SIGNINGS, TRADES AND ROSTER MOVES
Transactions
No recorded transactions for this player.
13 / LATEST COVERAGE
Player news
LATEST UPDATEBanton was waived by the Celtics on Thursday, Adam Himmelsbach of The Boston Globe reports.
The Celtics had previously exercised their team option on Banton's contract, though he was on a non-guaranteed deal and will now have to explore other opportunities. The 26-year-old guard appeared in six regular-season games between the Celtics and Clippers last season, averaging 2.0 points and 1.8 assists in 10.3 minutes per showing.