


Portland Trail Blazers
2026-27: 42-40 (#8 Western) · 4th in Western Conference Division · Moda Center
Record since 2022-23
| Season | W | L | PCT | Seed | Home | Away | Div | Conf | PPG | OPP | DIFF | Streak |
|---|---|---|---|---|---|---|---|---|---|---|---|---|
| 2022-23 | 27 | 55 | .329 | #13 Western | 17-24 | 10-31 | 1-15 | 11-41 | 106.2 | 115.1 | -8.9 | L11 |
| 2023-24 | 33 | 49 | .402 | #13 Western | 17-24 | 16-25 | 7-9 | 23-29 | 113.4 | 117.4 | -4.0 | L4 |
| 2024-25 | 21 | 61 | .256 | #15 Western | 11-30 | 10-31 | 1-15 | 8-44 | 106.4 | 115.4 | -9.0 | L5 |
| 2025-26 | 36 | 46 | .439 | #12 Western | 22-19 | 14-27 | 6-10 | 19-33 | 110.9 | 113.9 | -3.0 | W1 |
| 2026-27 | 42 | 40 | .512 | #8 Western | 24-17 | 18-23 | 7-9 | 29-23 | 115.5 | 115.8 | -0.3 | W2 |
Combined record since 2022-23: 159-251 (38.8%). Click a season to load that year’s stats, roster and results below. 2026-27 is still in progress.
Team statistics 2024-25
Defensive
| Metric | Total | Per game | NBA rank |
|---|---|---|---|
| Blocks | 433 | 5.268 | 5th |
| Defensive Rebounds | 2576 | 31.354 | 15th |
| Steals | 678 | 8.268 | 7th |
| Points Conceded Off Turnovers | 0 | 19 | — |
| Defensive Rebound Rate | 0.0 | — | — |
| Defensive Rebounds Per Game | 31.4 | — | — |
| Blocks Per Game | 5.3 | — | — |
| Steals Per Game | 8.3 | — | — |
| Defensive Rebounds Per 48 | 0.0 | — | — |
| Blocks Per 48 | 0.0 | — | — |
| Steals Per 48 | 0.0 | — | — |
General
| Metric | Total | Per game | NBA rank |
|---|---|---|---|
| Disqualifications | 0 | — | — |
| Flagrant Fouls | 3 | 0.037 | Tied-13th |
| Fouls | 1558 | 19 | 4th |
| Rebound Rate | 50.3 | — | 9th |
| Ejections | 0 | — | — |
| Technical Fouls | 52 | 0.305 | 14th |
| Rebounds | 3671 | 44.683 | — |
| Minutes | 0 | — | — |
| Minutes Per Game | 0.0 | — | — |
| Fantasy Rating | 0.0 | — | — |
| Rating | 201.3 | — | — |
| Plus-Minus | -1 | -1 | Tied-1st |
| Game Day of Year | 0 | — | — |
| Rebounds Per Game | 44.8 | — | — |
| Fouls Per Game | 19.0 | — | — |
| Flagrant Fouls Per Game | 0.0 | — | — |
| Technical Fouls Per Game | 0.6 | — | — |
| Ejections Per Game | 0.0 | — | — |
| Disqualifications Per Game | 0.0 | — | — |
| Assist To Turnover Ratio | 1.6 | 1.575 | — |
| Steal To Foul Ratio | 0.4 | 0.435 | — |
| Block To Foul Ratio | 0.3 | 0.277 | — |
| Team Rebounds Per Game | 0.0 | — | — |
| Rebounds | 3671 | 44.683 | — |
| Total Technical Fouls | 52 | 0.305 | — |
| Assist To Turnover Ratio | 28.3 | — | — |
| Team Rebounds | 0 | — | — |
| Steal To Turnover Ratio | 0.5 | 0.547 | — |
| Rebounds Per 48 Minutes | 0.0 | — | — |
| Fouls Per 48 Minutes | 0.0 | — | — |
| Flagrant Fouls Per 48 Minutes | 0.0 | — | — |
| Technical Fouls Per 48 Minutes | 0.0 | — | — |
| Ejections Per 48 Minutes | 0.0 | — | — |
| Disqualifications Per 48 Minutes | 0.0 | — | — |
| Games Played | 82 | — | Tied-1st |
| Games Started | 0 | — | — |
| Double Double | 0 | — | — |
| Triple Double | 0 | — | — |
Offensive
| Metric | Total | Per game | NBA rank |
|---|---|---|---|
| Assists | 1952 | 23.793 | 14th |
| Effective Field Goal Percentage | 52.1 | — | 14th |
| Field Goals | 3325/7396 | 0.45 | — |
| Field Goals Attempted | 7396 | 90.049 | 5th |
| Field Goals Made | 3325 | 40.5 | 14th |
| Field Goal Percentage | 45.0 | 0.45 | 15th |
| Free Throws | 1386/1820 | 0.761 | — |
| Free Throw Percentage | 76.2 | 0.761 | 13th |
| Free Throws Attempted | 1820 | 22.134 | 7th |
| Free Throws Made | 1386 | 16.854 | 9th |
| Offensive Rebounds | 1095 | 13.329 | 2nd |
| Points | 9093 | 110.744 | 14th |
| Turnovers | 1240 | 15.11 | 2nd |
| 3-Point Field Goal Percentage | 34.2 | 0.342 | 15th |
| 3-Point Field Goals Attempted | 3095 | 37.72 | 8th |
| 3-Point Field Goals Made | 1057 | 12.89 | 9th |
| True Shooting Percentage | 55.5 | — | 13th |
| Team Turnovers | 69 | — | Tied-4th |
| Total Turnovers | 1309 | 15.11 | — |
| Assist Ratio | 17.0 | — | 14th |
| Points in the Paint | 4004 | 48 | 8th |
| Offensive Rebound Rate | 29.2 | — | 2nd |
| Turnover Ratio | 13.8 | — | 2nd |
| Fast Break Points | 1293 | — | — |
| Possessions | 8411 | — | 6th |
| Pace Factor | 101.6 | — | 8th |
| Average Field Goals Made | 40.5 | — | — |
| Average Field Goals Attempted | 90.2 | — | — |
| Average 3-Point Field Goals Made | 12.9 | — | — |
| Average 3-Point Field Goals Attempted | 37.7 | — | — |
| Average Free Throws Made | 16.9 | — | — |
| Average Free Throws Attempted | 22.2 | — | — |
| Points Per Game | 110.9 | — | — |
| Offensive Rebounds Per Game | 13.4 | — | — |
| Assists Per Game | 23.8 | — | — |
| Turnovers Per Game | 15.1 | — | — |
| Offensive Rebound Percentage | 0.3 | 0.269 | — |
| Estimated Possessions | 8338.0 | 100.684 | — |
| Estimated Possessions Per Game | 101.7 | — | — |
| Points Per Estimated Possession | 1.1 | 1.1 | — |
| Team Turnovers Per Game | 0.8 | — | — |
| Total Turnovers Per Game | 16.0 | — | — |
| 3-Point Field Goal Percentage | 34.2 | 0.342 | 1st |
| 2-Point Field Goals Made | 2268.0 | 27.61 | 5th |
| 2-Point Field Goals Attempted | 4301.0 | 52.329 | Tied-3rd |
| 2-Point Field Goals Made per Game | 27.7 | — | — |
| 2-Point Field Goals Attempted per Game | 52.5 | — | — |
| 2-Point Field Goal Percentage | 52.7 | 0.528 | — |
| Shooting Efficiency | 0.52 | 0.521 | — |
| Scoring Efficiency | 1.229 | 1.23 | — |
| Fieldgoals Made Per 48 | 0.0 | — | — |
| Fieldgoals Attempted Per 48 | 0.0 | — | — |
| 3-Point Fieldgoals Made Per 48 | 0.0 | — | — |
| 3-Point Fieldgoals Attempted Per 48 | 0.0 | — | — |
| Freethrows Made Per 48 | 0.0 | — | — |
| Freethrows Attempted Per 48 | 0.0 | — | — |
| Points Scored Per 48 | 0.0 | — | — |
| Offensive Rebounds Per 48 | 0.0 | — | — |
| Assists Per 48 | 0.0 | — | — |
| Turnovers | 0.0 | — | — |
Roster 2024-25
Results 2024-25
| Date | Opponent | Result | Score |
|---|---|---|---|
| Apr 14, 2025 | vs Los Angeles Lakers | W | 109-81 |
| Apr 12, 2025 | vs Golden State Warriors | L | 86-103 |
| Apr 10, 2025 | at Utah Jazz | L | 126-133 |
| Apr 7, 2025 | vs San Antonio Spurs | W | 120-109 |
| Apr 5, 2025 | at Chicago Bulls | L | 113-118 |
| Apr 4, 2025 | at Toronto Raptors | W | 112-103 |
| Apr 2, 2025 | at Atlanta Hawks | W | 127-113 |
| Mar 31, 2025 | at New York Knicks | L | 93-110 |
| Mar 28, 2025 | at Sacramento Kings | L | 107-128 |
| Mar 26, 2025 | vs Cleveland Cavaliers | L | 111-122 |
| Mar 24, 2025 | vs Boston Celtics | L | 116-129 |
| Mar 22, 2025 | vs Denver Nuggets | W | 128-109 |
| Mar 20, 2025 | vs Memphis Grizzlies | W | 115-99 |
| Mar 18, 2025 | vs Washington Wizards | W | 112-97 |
| Mar 17, 2025 | vs Toronto Raptors | W | 105-102 |
| Mar 13, 2025 | vs New York Knicks | L | 113-114 |
| Mar 11, 2025 | at Golden State Warriors | L | 120-130 |
| Mar 10, 2025 | vs Detroit Pistons | L | 112-119 |
| Mar 8, 2025 | at Oklahoma City Thunder | L | 89-107 |
| Mar 6, 2025 | at Boston Celtics | L | 118-128 |
| Mar 4, 2025 | at Philadelphia 76ers | W | 119-102 |
| Mar 3, 2025 | at Cleveland Cavaliers | L | 129-133 |
| Mar 1, 2025 | at Brooklyn Nets | W | 121-102 |
| Feb 27, 2025 | at Washington Wizards | W | 129-121 |
| Feb 25, 2025 | at Utah Jazz | W | 114-112 |
| Feb 23, 2025 | vs Charlotte Hornets | W | 141-88 |
| Feb 21, 2025 | vs Los Angeles Lakers | L | 102-110 |
| Feb 13, 2025 | at Denver Nuggets | L | 121-132 |
| Feb 11, 2025 | at Denver Nuggets | L | 117-146 |
| Feb 9, 2025 | at Minnesota Timberwolves | L | 98-114 |
| Feb 7, 2025 | vs Sacramento Kings | W | 108-102 |
| Feb 5, 2025 | vs Indiana Pacers | W | 112-89 |
| Feb 4, 2025 | vs Phoenix Suns | W | 121-119 |
| Feb 2, 2025 | vs Phoenix Suns | W | 127-108 |
| Jan 31, 2025 | vs Orlando Magic | W | 119-90 |
| Jan 29, 2025 | vs Milwaukee Bucks | W | 125-112 |
| Jan 27, 2025 | vs Oklahoma City Thunder | L | 108-118 |
| Jan 25, 2025 | at Charlotte Hornets | W | 102-97 |
| Jan 24, 2025 | at Orlando Magic | W | 101-79 |
| Jan 22, 2025 | at Miami Heat | W | 116-107 |
Most recent 40 completed games, 2024-25.
Contracts
2026-27 payroll on file: $175.38M across 12 players.
| Player | 2026-27 | Total | Type / notes |
|---|---|---|---|
 Ja Morant | $42.17M | $189.45M | |
 Jrue Holiday | $34.8M | $326.15M | |
 Shaedon Sharpe | $20.09M | $47.43M | |
 Toumani Camara | $18.08M | $23.31M | |
 Scoot Henderson | $13.59M | $44.36M | |
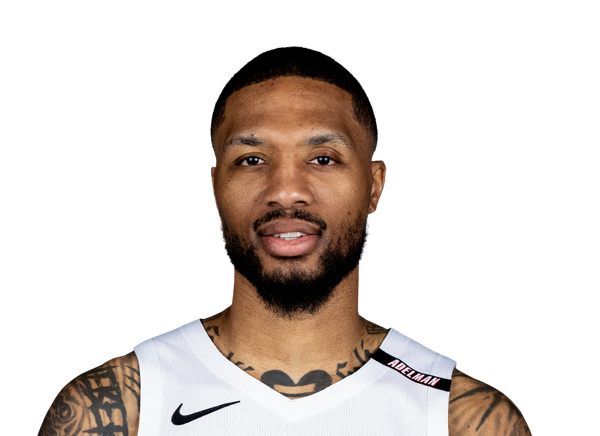 Damian Lillard | $13.4M | $347.89M | |
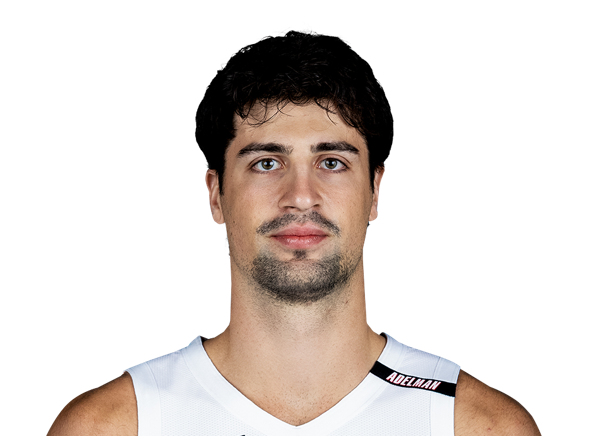 Deni Avdija | $13.13M | $63.47M | |
 Donovan Clingan | $7.52M | $21.28M | |
 Yang Hansen | $4.64M | $9.07M | |
 Micah Potter | $2.8M | $4.33M | |
 Vit Krejci | $2.67M | $9.67M | |
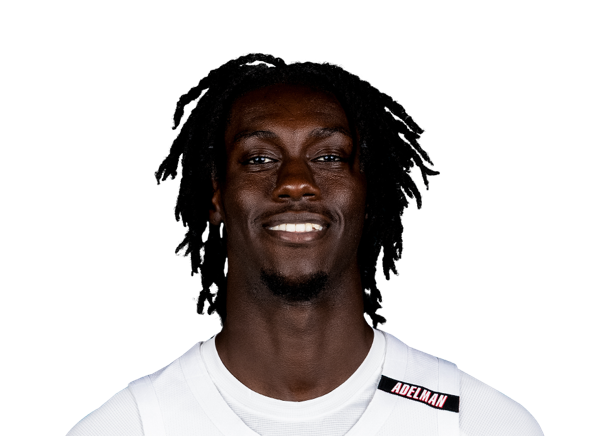 Sidy Cissoko | $2.5M | $6.2M |
Injuries
Portland Trail Blazers · Foot / Leg / Bruise · est. return Nov 17
Youngblood (foot) is out for Monday's game against the Timberwolves.
Portland Trail Blazers · Ankle / Leg · est. return Jan 12
Krejci underwent surgery on his fractured left ankle Wednesday and will be re-evaluated in eight weeks, Brett Siegel of ClutchPoints.com reports.
Portland Trail Blazers · Hamstring / Leg / Not Specified · est. return Dec 1
Head coach Micah Nori said Morant met with a doctor in Los Angeles, who gave him a positive outlook on his recovery from the hamstring injury. While Nori declined to update Morant's timetable, he added Morant "may not be out for as long as we thought," Trail Blazers Insider Sean Highkin reports.
Portland Trail Blazers · Knee / Leg / Surgery · est. return Mar 2
Sharpe suffered a torn meniscus in his knee and is expected to miss six months, per Shams Charania of ESPN.
Adjustments & transactions
- Waived F Jeremy Sochan.
- Waived G Caleb Houstan.
- Waived F Keylan Boone and Gs Barry Dunning and Mark Sears.
- Waived G Mark Armstrong and C Samson Johnson.