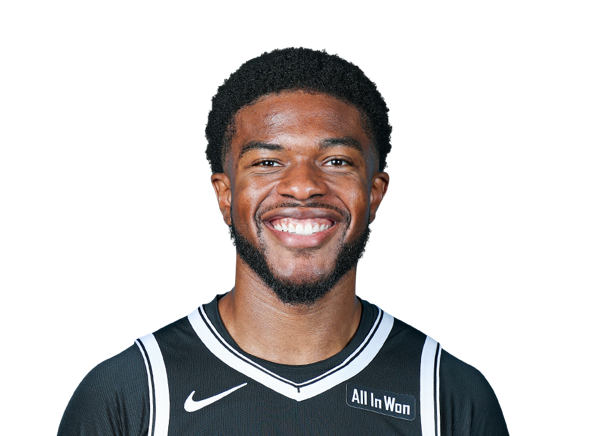
Click a season to open this player’s full game log, splits and advanced stats for that year; click a team to open its page. A dash means no NBA games were recorded.
03 / EVERY CATEGORY THE PROVIDER REPORTS
Full statistical breakdown
Regular season 2023-24
Defensive
Metric
Total
NBA rank
Blocks
2
Tied-451st
Defensive Rebounds
5
Tied-517th
Steals
2
Tied-488th
Defensive Rebound Rate
0.0
—
Defensive Rebounds Per Game
0.6
—
Blocks Per Game
0.3
—
Steals Per Game
0.3
—
Defensive Rebounds Per 48
10.4
2,757th
Blocks Per 48
4.2
2,405th
Steals Per 48
4.2
2,602nd
General
Metric
Total
NBA rank
Disqualifications
0
Tied-102nd
Flagrant Fouls
0
Tied-76th
Fouls
2
Tied-533rd
Player Efficiency Rating
4.26
—
Rebound Rate
0.0
—
Ejections
0
Tied-61st
Technical Fouls
0
Tied-256th
Rebounds
5
—
Value Over Replacement Player
-2.2
—
Minutes
23
Tied-9th
Minutes Per Game
2.9
—
Rating
1.4
Tied-374th
Plus-Minus
-4
Tied-1st
Rebounds Per Game
0.6
—
Fouls Per Game
0.3
—
Flagrant Fouls Per Game
0.0
—
Technical Fouls Per Game
0.0
—
Ejections Per Game
0.0
—
Disqualifications Per Game
0.0
—
Assist To Turnover Ratio
0.5
—
Steal To Foul Ratio
1.0
—
Block To Foul Ratio
1.0
—
Team Rebounds Per Game
0.0
—
Rebounds
5
—
Total Technical Fouls
0
—
Assist To Turnover Ratio
0.0
—
Steal To Turnover Ratio
1.0
—
Rebounds Per 48 Minutes
10.4
—
Fouls Per 48 Minutes
4.2
2,842nd
Flagrant Fouls Per 48 Minutes
0.0
405th
Technical Fouls Per 48 Minutes
0.0
1,365th
Ejections Per 48 Minutes
0.0
325th
Disqualifications Per 48 Minutes
0.0
544th
R/40
8.7
—
Games Played
8
8th
Games Started
0
Tied-393rd
Double Double
0
Tied-257th
Triple Double
0
Tied-38th
Offensive
Metric
Total
NBA rank
Assists
1
Tied-544th
Effective Field Goal Percentage
16.7
—
Field Goals
1/6
—
Field Goals Attempted
6
Tied-543rd
Field Goals Made
1
Tied-550th
Field Goal Percentage
16.7
—
Free Throws
2/2
—
Free Throw Percentage
100.0
—
Free Throws Attempted
2
Tied-493rd
Free Throws Made
2
Tied-487th
Offensive Rebounds
0
Tied-545th
Points
4
Tied-547th
Turnovers
2
Tied-502nd
3-Point Field Goal Percentage
0.0
—
3-Point Field Goals Attempted
5
Tied-478th
3-Point Field Goals Made
0
Tied-498th
True Shooting Percentage
29.1
—
Total Turnovers
2
—
Assist Ratio
10.1
—
Points in the Paint
0
Tied-1st
Offensive Rebound Rate
0.0
—
Turnover Ratio
20.2
—
Brick Index
0.00
—
Usage Rate
0.0
—
Average Field Goals Made
0.1
—
Average Field Goals Attempted
0.8
—
Average 3-Point Field Goals Made
0.0
—
Average 3-Point Field Goals Attempted
0.6
—
Average Free Throws Made
0.3
—
Average Free Throws Attempted
0.3
—
Points Per Game
0.5
—
Offensive Rebounds Per Game
0.0
—
Assists Per Game
0.1
—
Turnovers Per Game
0.3
—
Offensive Rebound Percentage
0.0
—
Estimated Possessions
8.8
—
Estimated Possessions Per Game
1.1
—
Points Per Estimated Possession
0.5
—
Team Turnovers Per Game
0.0
—
Total Turnovers Per Game
0.3
—
3-Point Field Goal Percentage
0.0
—
2-Point Field Goals Made
1.0
Tied-52nd
2-Point Field Goals Attempted
1.0
Tied-65th
2-Point Field Goals Made per Game
0.1
—
2-Point Field Goals Attempted per Game
0.1
—
2-Point Field Goal Percentage
100.0
—
Shooting Efficiency
0.17
—
Scoring Efficiency
0.667
—
Fieldgoals Made Per 48
2.1
2,933rd
Fieldgoals Attempted Per 48
12.5
2,896th
3-Point Fieldgoals Made Per 48
0.0
2,656th
3-Point Fieldgoals Attempted Per 48
10.4
2,549th
Freethrows Made Per 48
4.2
2,597th
Freethrows Attempted Per 48
4.2
2,629th
Points Scored Per 48
8.3
2,917th
Offensive Rebounds Per 48
0.0
2,906th
Assists Per 48
2.1
2,901st
Turnovers
4.2
2,677th
P/40
7.0
—
A/40
1.7
—
Playoffs 2023-24
Defensive
Metric
Total
NBA rank
Blocks
0
Tied-142nd
Defensive Rebounds
1
Tied-185th
Steals
0
Tied-162nd
Defensive Rebound Rate
0.0
—
Defensive Rebounds Per Game
1.0
—
Blocks Per Game
0.0
—
Steals Per Game
0.0
—
Defensive Rebounds Per 48
16.0
2,220th
Blocks Per 48
0.0
1,704th
Steals Per 48
0.0
1,944th
General
Metric
Total
NBA rank
Disqualifications
0
Tied-9th
Flagrant Fouls
0
Tied-10th
Fouls
0
Tied-188th
Player Efficiency Rating
0.00
—
Rebound Rate
0.0
—
Ejections
0
Tied-5th
Technical Fouls
0
Tied-47th
Rebounds
1
—
Value Over Replacement Player
-0.5
—
Minutes
3
Tied-4th
Minutes Per Game
3.0
—
Rating
1.0
Tied-992nd
Plus-Minus
+2
Tied-1st
Rebounds Per Game
1.0
—
Fouls Per Game
0.0
—
Flagrant Fouls Per Game
0.0
—
Technical Fouls Per Game
0.0
—
Ejections Per Game
0.0
—
Disqualifications Per Game
0.0
—
Assist To Turnover Ratio
0.0
—
Steal To Foul Ratio
0.0
—
Block To Foul Ratio
0.0
—
Team Rebounds Per Game
0.0
—
Rebounds
1
—
Total Technical Fouls
0
—
Assist To Turnover Ratio
0.0
—
Steal To Turnover Ratio
0.0
—
Rebounds Per 48 Minutes
16.0
—
Fouls Per 48 Minutes
0.0
2,256th
Flagrant Fouls Per 48 Minutes
0.0
120th
Technical Fouls Per 48 Minutes
0.0
564th
Ejections Per 48 Minutes
0.0
60th
Disqualifications Per 48 Minutes
0.0
108th
R/40
13.3
—
Games Played
1
1st
Games Started
0
Tied-98th
Double Double
0
Tied-46th
Triple Double
0
Tied-6th
Offensive
Metric
Total
NBA rank
Assists
0
Tied-186th
Effective Field Goal Percentage
0.0
—
Field Goals
0/0
—
Field Goals Attempted
0
Tied-208th
Field Goals Made
0
Tied-193rd
Field Goal Percentage
0.0
—
Free Throws
0/0
—
Free Throw Percentage
0.0
—
Free Throws Attempted
0
Tied-165th
Free Throws Made
0
Tied-162nd
Offensive Rebounds
0
Tied-176th
Points
0
Tied-198th
Turnovers
0
Tied-176th
3-Point Field Goal Percentage
0.0
—
3-Point Field Goals Attempted
0
Tied-182nd
3-Point Field Goals Made
0
Tied-154th
True Shooting Percentage
0.0
—
Total Turnovers
0
—
Assist Ratio
0.0
—
Points in the Paint
0
Tied-1st
Offensive Rebound Rate
0.0
—
Turnover Ratio
0.0
—
Brick Index
0.00
—
Usage Rate
0.0
—
Average Field Goals Made
0.0
—
Average Field Goals Attempted
0.0
—
Average 3-Point Field Goals Made
0.0
—
Average 3-Point Field Goals Attempted
0.0
—
Average Free Throws Made
0.0
—
Average Free Throws Attempted
0.0
—
Points Per Game
0.0
—
Offensive Rebounds Per Game
0.0
—
Assists Per Game
0.0
—
Turnovers Per Game
0.0
—
Offensive Rebound Percentage
0.0
—
Estimated Possessions
0.0
—
Estimated Possessions Per Game
0.0
—
Points Per Estimated Possession
0.0
—
Team Turnovers Per Game
0.0
—
Total Turnovers Per Game
0.0
—
3-Point Field Goal Percentage
0.0
—
2-Point Field Goals Made
0.0
Tied-39th
2-Point Field Goals Attempted
0.0
Tied-26th
2-Point Field Goals Made per Game
0.0
—
2-Point Field Goals Attempted per Game
0.0
—
2-Point Field Goal Percentage
0.0
—
Shooting Efficiency
0.00
—
Scoring Efficiency
0.000
—
Fieldgoals Made Per 48
0.0
2,316th
Fieldgoals Attempted Per 48
0.0
2,496th
3-Point Fieldgoals Made Per 48
0.0
1,848th
3-Point Fieldgoals Attempted Per 48
0.0
2,184th
Freethrows Made Per 48
0.0
1,944th
Freethrows Attempted Per 48
0.0
1,980th
Points Scored Per 48
0.0
2,376th
Offensive Rebounds Per 48
0.0
2,112th
Assists Per 48
0.0
2,232nd
Turnovers
0.0
2,112th
P/40
0.0
—
A/40
0.0
—
04 / EFFICIENCY, SHOOTING PROFILE, PER-36
Advanced metrics
True shooting %26.8%
Effective FG %12.5%
2-point FG %50.0%
3-point attempt rate75.0%
Free throw rate37.5%
Points per shot attempt0.63
% of points from 3s0.0%
Assist-to-turnover0.33
Points per 36 min6.2
Rebounds per 36 min7.4
Assists per 36 min1.2
Steals per 36 min3.72
Blocks per 36 min3.72
Turnovers per 36 min3.72
Stocks (STL + BLK) per game0.60
Pts + Reb + Ast per game1.2
Efficiency (EFF) per game0.8
Game Score per game (Hollinger)0.3
Minutes per game2.9
Calculated by BallersCulture from the supplied 2023-24 box-score totals using standard formulas (hover a tile to see the formula). Tracking-based metrics such as BPM, VORP, on/off and RAPTOR are not available from this data source.
05 / 8 GAMES IN 2023-24
Game log: Regular season
Date
Opp
Result
MIN
FG
FG%
3PT
3P%
FT
FT%
REB
AST
BLK
STL
PF
TO
PTS
Jan 28
@ MIL
L 141-117
3
0-0
0.0
0-0
0.0
0-0
0.0
2
0
0
0
0
0
0
Jan 27
vs OKC
L 107-83
3
0-1
0.0
0-1
0.0
0-0
0.0
0
0
0
2
0
0
0
Jan 13
@ DEN
L 125-113
2
0-0
0.0
0-0
0.0
0-0
0.0
1
1
0
0
0
0
0
Jan 11
@ GS
W 141-105
3
0-1
0.0
0-1
0.0
0-0
0.0
0
0
0
0
0
0
0
Jan 8
@ SAC
W 133-100
4
0-0
0.0
0-0
0.0
0-0
0.0
0
0
1
0
1
1
0
Nov 9
@ MIN
L 122-101
5
1-3
33.3
0-2
0.0
2-2
100.0
0
0
1
0
1
1
4
Nov 5
vs ATL
L 123-105
1
0-0
0.0
0-0
0.0
0-0
0.0
0
0
0
0
0
0
0
Oct 29
vs NY
W 96-87
2
0-1
0.0
0-1
0.0
0-0
0.0
2
0
0
0
0
0
0
06 / 1 GAMES IN 2023-24
Game log: Playoffs
Date
Opp
Result
MIN
FG
FG%
3PT
3P%
FT
FT%
REB
AST
BLK
STL
PF
TO
PTS
Apr 28
vs OKC
L 106-85
3
0-0
0.0
0-0
0.0
0-0
0.0
1
0
0
0
0
0
0
07 / 2023-24 HOME / AWAY, RESULTS, MONTHS AND OPPONENTS
12th in Western Conference Division · Smoothie King Center
Overall49-33
Home21-19
Road28-14
DIV9-7
CONF30-22
Last Ten Games5-5
Team records for 2023-24 (regular season).
Team statistics 2023-24
Defensive
Metric
Total
NBA rank
Blocks
378
Tied-15th
Defensive Rebounds
2753
Tied-3rd
Steals
684
Tied-12th
Points Conceded Off Turnovers
0
—
Defensive Rebound Rate
0.0
—
Defensive Rebounds Per Game
33.6
—
Blocks Per Game
4.6
—
Steals Per Game
8.3
—
Defensive Rebounds Per 48
0.0
—
Blocks Per 48
0.0
—
Steals Per 48
0.0
—
General
Metric
Total
NBA rank
Disqualifications
7
Tied-18th
Flagrant Fouls
2
—
Fouls
1508
Tied-11th
Rebound Rate
51.2
51st
Ejections
5
—
Technical Fouls
102
—
Rebounds
3605
—
Minutes
0
—
Minutes Per Game
0.0
—
Fantasy Rating
0.0
—
Rating
215.9
—
Plus-Minus
-1
Tied-1st
Game Day of Year
0
—
Rebounds Per Game
44.0
—
Fouls Per Game
18.4
—
Flagrant Fouls Per Game
0.0
—
Technical Fouls Per Game
1.2
—
Ejections Per Game
0.1
—
Disqualifications Per Game
0.1
—
Assist To Turnover Ratio
2.2
—
Steal To Foul Ratio
0.5
—
Block To Foul Ratio
0.3
—
Team Rebounds Per Game
0.0
—
Rebounds
3605
—
Total Technical Fouls
102
—
Assist To Turnover Ratio
45.1
—
Team Rebounds
0
—
Steal To Turnover Ratio
0.7
—
Rebounds Per 48 Minutes
0.0
—
Fouls Per 48 Minutes
0.0
—
Flagrant Fouls Per 48 Minutes
0.0
—
Technical Fouls Per 48 Minutes
0.0
—
Ejections Per 48 Minutes
0.0
—
Disqualifications Per 48 Minutes
0.0
—
Games Played
82
Tied-1st
Games Started
0
—
Double Double
0
—
Triple Double
0
—
Offensive
Metric
Total
NBA rank
Assists
2210
Tied-20th
Effective Field Goal Percentage
55.8
—
Field Goals
3484/7165
—
Field Goals Attempted
7165
24th
Field Goals Made
3484
18th
Field Goal Percentage
48.6
12th
Free Throws
1445/1873
—
Free Throw Percentage
77.1
15th
Free Throws Attempted
1873
Tied-12th
Free Throws Made
1445
Tied-11th
Offensive Rebounds
852
Tied-18th
Points
9436
Tied-14th
Turnovers
1018
1st
3-Point Field Goal Percentage
38.3
5th
3-Point Field Goals Attempted
2673
Tied-19th
3-Point Field Goals Made
1023
Tied-8th
True Shooting Percentage
59.1
—
Team Turnovers
49
—
Total Turnovers
1067
—
Assist Ratio
19.6
—
Points in the Paint
4204
—
Offensive Rebound Rate
24.6
24th
Turnover Ratio
11.8
—
Fast Break Points
1240
—
Possessions
8204
—
Pace Factor
99.5
99th
Average Field Goals Made
42.5
—
Average Field Goals Attempted
87.4
—
Average 3-Point Field Goals Made
12.5
—
Average 3-Point Field Goals Attempted
32.6
—
Average Free Throws Made
17.6
—
Average Free Throws Attempted
22.8
—
Points Per Game
115.1
—
Offensive Rebounds Per Game
10.4
—
Assists Per Game
27.0
—
Turnovers Per Game
12.4
—
Offensive Rebound Percentage
0.2
—
Estimated Possessions
8129.2
—
Estimated Possessions Per Game
99.1
—
Points Per Estimated Possession
1.2
—
Team Turnovers Per Game
0.6
—
Total Turnovers Per Game
13.0
—
3-Point Field Goal Percentage
38.3
—
2-Point Field Goals Made
2461.0
26th
2-Point Field Goals Attempted
4492.0
43rd
2-Point Field Goals Made per Game
30.0
—
2-Point Field Goals Attempted per Game
54.8
—
2-Point Field Goal Percentage
54.8
—
Shooting Efficiency
0.56
—
Scoring Efficiency
1.317
—
Fieldgoals Made Per 48
0.0
—
Fieldgoals Attempted Per 48
0.0
—
3-Point Fieldgoals Made Per 48
0.0
—
3-Point Fieldgoals Attempted Per 48
0.0
—
Freethrows Made Per 48
0.0
—
Freethrows Attempted Per 48
0.0
—
Points Scored Per 48
0.0
—
Offensive Rebounds Per 48
0.0
—
Assists Per 48
0.0
—
Turnovers
0.0
—
10 / SALARY BY SEASON
Contract
Season
Salary
2023-24
$1.8M
2024-25
$2.12M
Total listed: $3.92M · source: espn.
11 / LATEST REPORT
Injury status
No current injury report entry for this player.
12 / SIGNINGS, TRADES AND ROSTER MOVES
Transactions
No recorded transactions for this player.
13 / LATEST COVERAGE
Player news
LATEST UPDATELiddell reached agreement June 6 with Aris B.C. of the Greek Basketball League on a two-year contract, Johnny Askounis of Eurohoops.net reports.
The 25-year-old big man will head overseas after he spent his fourth season in the professional ranks as a two-way player with the Nets in 2025-26. He appeared in a career-high 26 games at the NBA level, averaging 5.7 points, 2.7 rebounds and 0.9 assists in 13.4 minutes per contest. Liddell is scheduled to become a restricted free agent when the new league year begins July 1, but the Nets will presumably decline his qualifying offer to allow him to continue his career in Greece.