


BALLERSCULTURE TEAM PAGE · 2024-25
Chicago Bulls
2026-27: 31-51 (#12 Eastern) · 4th in Central Division · United Center
01 / SEASON BY SEASON
Record since 2022-23
| Season | W | L | PCT | Seed | Home | Away | Div | Conf | PPG | OPP | DIFF | Streak |
|---|---|---|---|---|---|---|---|---|---|---|---|---|
| 2022-23 | 46 | 36 | .561 | #6 Eastern | 27-14 | 19-22 | 10-6 | 29-23 | 111.6 | 112.0 | -0.4 | W1 |
| 2023-24 | 40 | 42 | .488 | #10 Eastern | 22-19 | 18-23 | 7-9 | 27-25 | 113.1 | 111.8 | +1.3 | W2 |
| 2024-25 | 39 | 43 | .476 | #9 Eastern | 20-21 | 19-22 | 7-9 | 22-29 | 112.3 | 113.7 | -1.4 | L1 |
| 2025-26 | 39 | 43 | .476 | #9 Eastern | 18-23 | 21-20 | 4-12 | 28-24 | 117.8 | 119.4 | -1.6 | W3 |
| 2026-27 | 31 | 51 | .378 | #12 Eastern | 18-23 | 13-28 | 4-12 | 19-32 | 116.3 | 121.5 | -5.2 | L2 |
Combined record since 2022-23: 195-215 (47.6%). Click a season to load that year’s stats, roster and results below. 2026-27 is still in progress.
02 / EVERY CATEGORY THE PROVIDER REPORTS
Team statistics 2024-25
Defensive
| Metric | Total | Per game | NBA rank |
|---|---|---|---|
| Blocks | 386 | 4.707 | 3rd |
| Defensive Rebounds | 2935 | 35.793 | 1st |
| Steals | 621 | 7.573 | 4th |
| Points Conceded Off Turnovers | 0 | 18 | — |
| Defensive Rebound Rate | 0.0 | — | — |
| Defensive Rebounds Per Game | 35.8 | — | — |
| Blocks Per Game | 4.7 | — | — |
| Steals Per Game | 7.6 | — | — |
| Defensive Rebounds Per 48 | 0.0 | — | — |
| Blocks Per 48 | 0.0 | — | — |
| Steals Per 48 | 0.0 | — | — |
General
| Metric | Total | Per game | NBA rank |
|---|---|---|---|
| Disqualifications | 0 | — | — |
| Flagrant Fouls | 7 | 0.085 | 3rd |
| Fouls | 1444 | 17.61 | 5th |
| Rebound Rate | 49.9 | — | 3rd |
| Ejections | 1 | 0.012 | 5th |
| Technical Fouls | 50 | 0.317 | 5th |
| Rebounds | 3760 | 45.854 | — |
| Minutes | 0 | — | — |
| Minutes Per Game | 0.0 | — | — |
| Fantasy Rating | 0.0 | — | — |
| Rating | 221.6 | — | — |
| Plus-Minus | -1 | -1 | Tied-1st |
| Game Day of Year | 0 | — | — |
| Rebounds Per Game | 45.9 | — | — |
| Fouls Per Game | 17.6 | — | — |
| Flagrant Fouls Per Game | 0.1 | — | — |
| Technical Fouls Per Game | 0.6 | — | — |
| Ejections Per Game | 0.0 | — | — |
| Disqualifications Per Game | 0.0 | — | — |
| Assist To Turnover Ratio | 2.1 | 2.085 | — |
| Steal To Foul Ratio | 0.4 | 0.43 | — |
| Block To Foul Ratio | 0.3 | 0.267 | — |
| Team Rebounds Per Game | 0.0 | — | — |
| Rebounds | 3760 | 45.854 | — |
| Total Technical Fouls | 50 | 0.317 | — |
| Assist To Turnover Ratio | 39.7 | — | — |
| Team Rebounds | 0 | — | — |
| Steal To Turnover Ratio | 0.5 | 0.543 | — |
| Rebounds Per 48 Minutes | 0.0 | — | — |
| Fouls Per 48 Minutes | 0.0 | — | — |
| Flagrant Fouls Per 48 Minutes | 0.0 | — | — |
| Technical Fouls Per 48 Minutes | 0.0 | — | — |
| Ejections Per 48 Minutes | 0.0 | — | — |
| Disqualifications Per 48 Minutes | 0.0 | — | — |
| Games Played | 82 | — | Tied-1st |
| Games Started | 0 | — | — |
| Double Double | 0 | — | — |
| Triple Double | 0 | — | — |
Offensive
| Metric | Total | Per game | NBA rank |
|---|---|---|---|
| Assists | 2383 | 29.061 | 2nd |
| Effective Field Goal Percentage | 55.3 | — | 4th |
| Field Goals | 3543/7545 | 0.47 | — |
| Field Goals Attempted | 7545 | 92.012 | 1st |
| Field Goals Made | 3543 | 43.207 | 3rd |
| Field Goal Percentage | 47.0 | 0.47 | 5th |
| Free Throws | 1308/1617 | 0.809 | — |
| Free Throw Percentage | 80.9 | 0.809 | 1st |
| Free Throws Attempted | 1617 | 19.72 | 5th |
| Free Throws Made | 1308 | 15.951 | 5th |
| Offensive Rebounds | 825 | 10.061 | 3rd |
| Points | 9660 | 117.805 | 2nd |
| Turnovers | 1143 | 13.939 | 2nd |
| 3-Point Field Goal Percentage | 36.7 | 0.367 | 4th |
| 3-Point Field Goals Attempted | 3447 | 42.037 | 1st |
| 3-Point Field Goals Made | 1266 | 15.439 | 2nd |
| True Shooting Percentage | 58.5 | — | 4th |
| Team Turnovers | 60 | — | 3rd |
| Total Turnovers | 1203 | 13.939 | — |
| Assist Ratio | 20.1 | — | 2nd |
| Points in the Paint | 4162 | 50 | 4th |
| Offensive Rebound Rate | 22.3 | — | 3rd |
| Turnover Ratio | 12.7 | — | 2nd |
| Fast Break Points | 1517 | — | — |
| Possessions | 8634 | — | 1st |
| Pace Factor | 105.3 | — | 1st |
| Average Field Goals Made | 43.2 | — | — |
| Average Field Goals Attempted | 92.0 | — | — |
| Average 3-Point Field Goals Made | 15.4 | — | — |
| Average 3-Point Field Goals Attempted | 42.0 | — | — |
| Average Free Throws Made | 16.0 | — | — |
| Average Free Throws Attempted | 19.7 | — | — |
| Points Per Game | 117.8 | — | — |
| Offensive Rebounds Per Game | 10.1 | — | — |
| Assists Per Game | 29.1 | — | — |
| Turnovers Per Game | 13.9 | — | — |
| Offensive Rebound Percentage | 0.2 | 0.206 | — |
| Estimated Possessions | 8569.8 | 103.778 | — |
| Estimated Possessions Per Game | 104.5 | — | — |
| Points Per Estimated Possession | 1.1 | 1.135 | — |
| Team Turnovers Per Game | 0.7 | — | — |
| Total Turnovers Per Game | 14.7 | — | — |
| 3-Point Field Goal Percentage | 36.7 | 0.367 | 2nd |
| 2-Point Field Goals Made | 2277.0 | 27.768 | 1st |
| 2-Point Field Goals Attempted | 4098.0 | 49.975 | — |
| 2-Point Field Goals Made per Game | 27.8 | — | — |
| 2-Point Field Goals Attempted per Game | 50.0 | — | — |
| 2-Point Field Goal Percentage | 55.6 | 0.556 | — |
| Shooting Efficiency | 0.55 | 0.553 | — |
| Scoring Efficiency | 1.280 | 1.28 | — |
| Fieldgoals Made Per 48 | 0.0 | — | — |
| Fieldgoals Attempted Per 48 | 0.0 | — | — |
| 3-Point Fieldgoals Made Per 48 | 0.0 | — | — |
| 3-Point Fieldgoals Attempted Per 48 | 0.0 | — | — |
| Freethrows Made Per 48 | 0.0 | — | — |
| Freethrows Attempted Per 48 | 0.0 | — | — |
| Points Scored Per 48 | 0.0 | — | — |
| Offensive Rebounds Per 48 | 0.0 | — | — |
| Assists Per 48 | 0.0 | — | — |
| Turnovers | 0.0 | — | — |
03 / PLAYERS, POSITIONS AND NUMBERS
Roster 2024-25
The roster could not be loaded right now.
04 / GAME-BY-GAME
Results 2024-25
| Date | Opponent | Result | Score |
|---|---|---|---|
| Apr 14, 2025 | at Philadelphia 76ers | W | 122-102 |
| Apr 12, 2025 | vs Washington Wizards | W | 119-89 |
| Apr 10, 2025 | vs Miami Heat | W | 119-111 |
| Apr 9, 2025 | at Cleveland Cavaliers | L | 113-135 |
| Apr 7, 2025 | at Charlotte Hornets | W | 131-117 |
| Apr 5, 2025 | vs Portland Trail Blazers | W | 118-113 |
| Apr 2, 2025 | vs Toronto Raptors | W | 137-118 |
| Apr 1, 2025 | at Oklahoma City Thunder | L | 117-145 |
| Mar 30, 2025 | vs Dallas Mavericks | L | 119-120 |
| Mar 28, 2025 | vs Los Angeles Lakers | W | 119-117 |
| Mar 25, 2025 | at Denver Nuggets | W | 129-119 |
| Mar 23, 2025 | at Los Angeles Lakers | W | 146-115 |
| Mar 21, 2025 | at Sacramento Kings | W | 128-116 |
| Mar 20, 2025 | at Phoenix Suns | L | 121-127 |
| Mar 18, 2025 | at Utah Jazz | W | 111-97 |
| Mar 16, 2025 | at Houston Rockets | L | 114-117 |
| Mar 14, 2025 | vs Brooklyn Nets | W | 116-110 |
| Mar 11, 2025 | vs Indiana Pacers | W | 121-103 |
| Mar 9, 2025 | at Miami Heat | W | 114-109 |
| Mar 7, 2025 | at Orlando Magic | W | 125-123 |
| Mar 5, 2025 | vs Cleveland Cavaliers | L | 117-139 |
| Mar 3, 2025 | at Indiana Pacers | L | 112-127 |
| Mar 1, 2025 | vs Toronto Raptors | W | 125-115 |
| Feb 27, 2025 | vs LA Clippers | L | 117-122 |
| Feb 25, 2025 | at Philadelphia 76ers | W | 142-110 |
| Feb 23, 2025 | vs Phoenix Suns | L | 117-121 |
| Feb 21, 2025 | at New York Knicks | L | 111-113 |
| Feb 13, 2025 | vs Detroit Pistons | L | 110-128 |
| Feb 12, 2025 | vs Detroit Pistons | L | 92-132 |
| Feb 9, 2025 | vs Golden State Warriors | L | 111-132 |
| Feb 6, 2025 | at Minnesota Timberwolves | L | 108-127 |
| Feb 5, 2025 | vs Miami Heat | W | 133-124 |
| Feb 3, 2025 | at Detroit Pistons | L | 119-127 |
| Feb 1, 2025 | at Toronto Raptors | W | 122-106 |
| Jan 30, 2025 | at Boston Celtics | L | 100-122 |
| Jan 28, 2025 | vs Denver Nuggets | W | 129-121 |
| Jan 26, 2025 | vs Philadelphia 76ers | L | 97-109 |
| Jan 24, 2025 | at Golden State Warriors | L | 106-131 |
| Jan 21, 2025 | at LA Clippers | W | 112-99 |
| Jan 20, 2025 | at Portland Trail Blazers | L | 102-113 |
Most recent 40 completed games, 2024-25.
05 / PAYROLL AND SALARIES
Contracts
2026-27 payroll on file: $125.89M across 11 players.
| Player | 2026-27 | Total | Type / notes |
|---|---|---|---|
 Josh Giddey | $25M | $77.21M | |
 Nic Claxton | $23.15M | $98.38M | |
 Patrick Williams | $18M | $86.6M | |
 Isaac Okoro | $11.81M | $62.08M | |
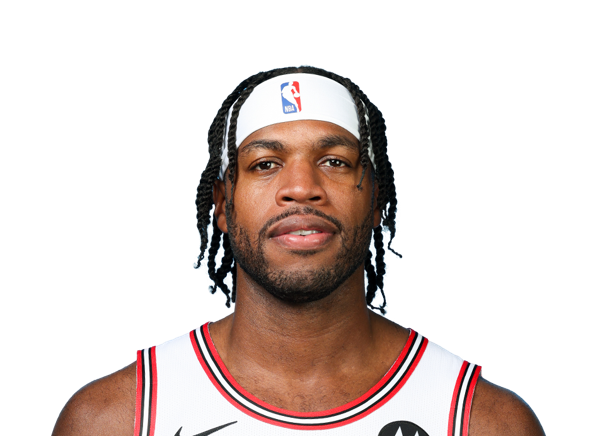 Buddy Hield | $9.66M | $133.08M | |
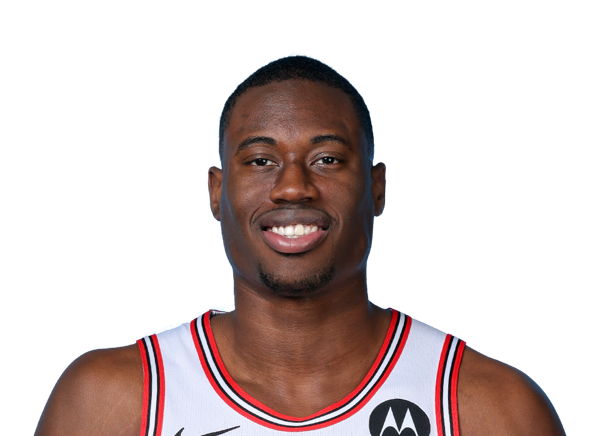 Jalen Smith | $9.43M | $45.98M | |
 Tre Jones | $8M | $39.2M | |
 Jordan Hawkins | $7.02M | $20.6M | |
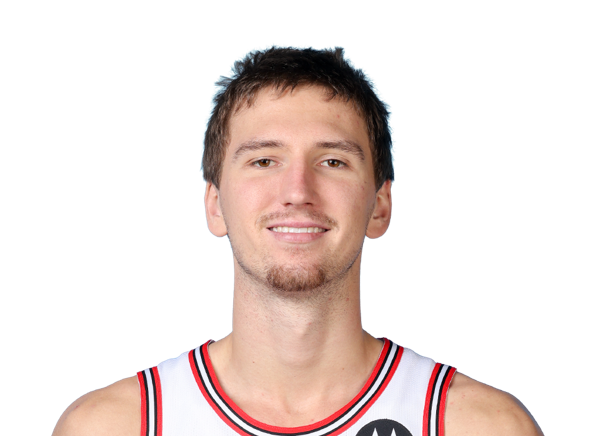 Matas Buzelis | $5.72M | $16.37M | |
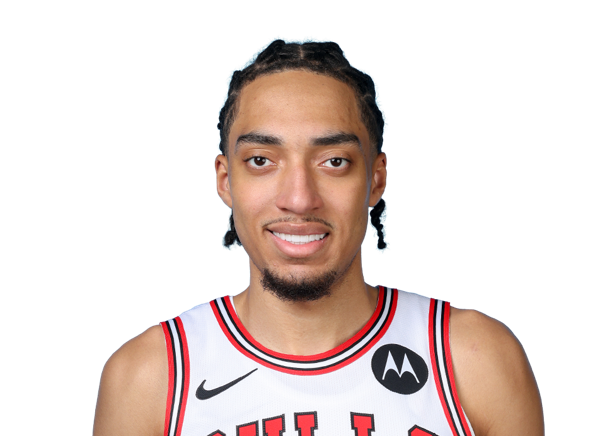 Noa Essengue | $5.7M | $11.13M | |
 Leonard Miller | $2.41M | $8.32M |
06 / CURRENT INJURY REPORT
Injuries
Patrick Williams Day-To-Day
Chicago Bulls · Finger / Arm / Dislocated · est. return Nov 18
Chicago Bulls · Finger / Arm / Dislocated · est. return Nov 18
Williams (finger) is listed as probable for Wednesday's game against Brooklyn.
Tobe Awaka Out
Chicago Bulls · Back / Torso · est. return Nov 25
Chicago Bulls · Back / Torso · est. return Nov 25
Awaka (back) has been ruled out for Wednesday's game against the Nets.
Caleb Wilson Out
Chicago Bulls · Hand / Arm · est. return Dec 13
Chicago Bulls · Hand / Arm · est. return Dec 13
Wilson (hand) is expected to miss four to six weeks, Shams Charania of ESPN reports.
07 / SIGNINGS, TRADES AND ROSTER MOVES
Adjustments & transactions
- Signed C Orlando Robinson to a rest-of-season contract.
- Waived G Brandon Boston, Fs Jalen Bridges, Drew Peterson and C Orlando Robinson.
- Waived G Isaiah Stevens.
- Waived G Peter Suder and F Marquel Sutton.
- Acquired G Buddy Hield from Charlotte in exchange for G Rob Dillingham.
- Waived G Houston Mallette.