


BALLERSCULTURE PLAYER PROFILE · 2026-27
James Johnson
Indiana Pacers · F • #16 • 6' 7" 240 lbs

01 / 2026-27 PER-GAME AVERAGES
Season snapshot
No regular-season 2026-27 statistics are recorded for this player. Career history is shown further down.
02 / EVERY SEASON SINCE 2022-23, SIDE BY SIDE
2022-23 to 2026-27
Per game
| Season | Team | GP | GS | MIN | PTS | REB | AST | STL | BLK | TO | FG% | 3P% | FT% |
|---|---|---|---|---|---|---|---|---|---|---|---|---|---|
| 2022-23 | Indiana Pacers | 18 | 1 | 9.0 | 2.8 | 1.7 | 0.8 | 0.4 | 0.3 | 0.4 | 44.9 | 20.0 | 50.0 |
| 2023-24 | Indiana Pacers | 9 | 0 | 5.2 | 0.9 | 0.4 | 0.9 | 0.6 | 0.1 | 0.6 | 30.0 | 0.0 | 100.0 |
| 2024-25 | Indiana Pacers | 12 | 0 | 3.1 | 0.7 | 0.5 | 0.3 | 0.0 | 0.2 | 0.3 | 36.4 | 0.0 | 0.0 |
| 2025-26 | — | — | — | — | — | — | — | — | — | — | — | — | — |
| 2026-27 | — | — | — | — | — | — | — | — | — | — | — | — | — |
Season totals
| Season | Team | GP | GS | MIN | PTS | REB | AST | STL | BLK | TO | FG% | 3P% | FT% |
|---|---|---|---|---|---|---|---|---|---|---|---|---|---|
| 2022-23 | Indiana Pacers | — | — | — | 51 | 30 | 15 | 7 | 6 | 8 | 44.9 | 20.0 | 50.0 |
| 2023-24 | Indiana Pacers | — | — | — | 8 | 4 | 8 | 5 | 1 | 5 | 30.0 | 0.0 | 100.0 |
| 2024-25 | Indiana Pacers | — | — | — | 8 | 6 | 4 | 0 | 2 | 4 | 36.4 | 0.0 | 0.0 |
| 2025-26 | — | — | — | — | — | — | — | — | — | — | — | — | — |
| 2026-27 | — | — | — | — | — | — | — | — | — | — | — | — | — |
Click a season to open this player’s full game log, splits and advanced stats for that year; click a team to open its page. A dash means no NBA games were recorded.
03 / SEASON-BY-SEASON HISTORY
Career statistics
Regular Season Averages
| Season | Team | GP | GS | MIN | FG | FG% | 3PT | 3P% | FT | FT% | OR | DR | REB | AST | BLK | STL | PF | TO | PTS |
|---|---|---|---|---|---|---|---|---|---|---|---|---|---|---|---|---|---|---|---|
| 2009-10 | Chicago Bulls | 65 | 11 | 11.6 | 1.5-3.2 | 45.2 | 0.2-0.7 | 32.6 | 0.8-1.1 | 72.9 | 0.5 | 1.4 | 2.0 | 0.7 | 0.7 | 0.3 | 1.9 | 1.0 | 3.9 |
| 2010-11 | Chicago Bulls | 13 | 0 | 9.5 | 1.3-3.2 | 41.5 | 0.2-0.7 | 22.2 | 0.5-1.0 | 46.2 | 0.5 | 1.4 | 1.8 | 1.1 | 0.7 | 0.6 | 1.9 | 1.4 | 3.2 |
| 2010-11 | Toronto Raptors | 25 | 25 | 28.0 | 3.6-7.8 | 46.4 | 0.2-1.0 | 24.0 | 1.6-2.3 | 70.7 | 1.2 | 3.5 | 4.7 | 3.0 | 1.1 | 1.0 | 2.8 | 1.8 | 9.2 |
| 2010-11 | 2010 11 Totals | 38 | 25 | 21.6 | 2.8-6.2 | 45.6 | 0.2-0.9 | 23.5 | 1.2-1.9 | 66.2 | 1.0 | 2.8 | 3.7 | 2.3 | 1.0 | 0.9 | 2.5 | 1.7 | 7.1 |
| 2011-12 | Toronto Raptors | 62 | 40 | 25.2 | 3.8-8.4 | 45.0 | 0.3-1.0 | 31.7 | 1.3-1.9 | 70.4 | 1.2 | 3.5 | 4.7 | 2.0 | 1.4 | 1.1 | 2.9 | 1.6 | 9.1 |
| 2012-13 | Sacramento Kings | 54 | 11 | 16.3 | 2.2-5.2 | 41.3 | 0.0-0.4 | 9.5 | 0.7-1.2 | 59.7 | 0.9 | 1.8 | 2.7 | 1.1 | 0.9 | 0.8 | 1.8 | 1.3 | 5.1 |
| 2013-14 | Memphis Grizzlies | 52 | 4 | 18.4 | 2.8-5.9 | 46.4 | 0.4-1.7 | 25.3 | 1.5-1.7 | 84.4 | 1.2 | 2.0 | 3.2 | 2.1 | 1.1 | 0.8 | 2.0 | 1.3 | 7.4 |
| 2014-15 | Toronto Raptors | 70 | 17 | 19.6 | 3.4-5.8 | 58.9 | 0.2-0.7 | 21.6 | 1.0-1.5 | 65.7 | 0.9 | 2.8 | 3.7 | 1.4 | 1.0 | 0.8 | 2.2 | 1.1 | 7.9 |
| 2015-16 | Toronto Raptors | 57 | 32 | 16.2 | 2.0-4.2 | 47.5 | 0.4-1.2 | 30.3 | 0.7-1.2 | 57.4 | 0.5 | 1.7 | 2.2 | 1.2 | 0.6 | 0.5 | 1.5 | 0.9 | 5.0 |
| 2016-17 | Miami Heat | 76 | 5 | 27.4 | 4.8-10.1 | 47.9 | 1.1-3.4 | 34.0 | 2.0-2.8 | 70.7 | 0.9 | 4.1 | 4.9 | 3.6 | 1.1 | 1.0 | 2.6 | 2.3 | 12.8 |
| 2017-18 | Miami Heat | 73 | 41 | 26.6 | 4.2-8.4 | 50.3 | 0.8-2.5 | 30.8 | 1.5-2.2 | 69.8 | 0.8 | 4.1 | 4.9 | 3.8 | 0.7 | 1.0 | 2.6 | 1.9 | 10.8 |
| 2018-19 | Miami Heat | 55 | 33 | 21.2 | 3.0-6.9 | 43.3 | 0.9-2.7 | 33.6 | 0.9-1.3 | 71.4 | 0.4 | 2.8 | 3.2 | 2.5 | 0.5 | 0.6 | 2.1 | 1.3 | 7.8 |
| 2019-20 | Miami Heat | 18 | 0 | 15.6 | 2.2-4.8 | 44.8 | 0.9-2.5 | 35.6 | 0.4-0.8 | 57.1 | 0.4 | 2.4 | 2.9 | 1.2 | 0.7 | 0.3 | 1.9 | 0.8 | 5.7 |
| 2019-20 | Minnesota Timberwolves | 14 | 1 | 24.1 | 4.6-9.1 | 50.0 | 1.2-3.3 | 37.0 | 1.6-2.4 | 67.6 | 1.2 | 3.5 | 4.7 | 3.8 | 1.4 | 1.4 | 3.3 | 2.4 | 12.0 |
| 2019-20 | 2019 20 Totals | 32 | 1 | 19.4 | 3.2-6.7 | 47.9 | 1.0-2.8 | 36.3 | 1.0-1.5 | 64.6 | 0.8 | 2.9 | 3.7 | 2.3 | 1.0 | 0.8 | 2.5 | 1.5 | 8.4 |
| 2020-21 | Dallas Mavericks | 29 | 1 | 17.4 | 2.3-5.0 | 46.2 | 0.5-2.1 | 25.0 | 0.6-1.0 | 58.6 | 0.5 | 2.5 | 3.0 | 1.7 | 0.8 | 0.8 | 2.0 | 0.9 | 5.7 |
| 2020-21 | New Orleans Pelicans | 22 | 11 | 24.5 | 3.6-8.3 | 43.4 | 0.7-2.7 | 26.7 | 1.3-2.1 | 59.6 | 0.8 | 3.3 | 4.1 | 2.2 | 0.9 | 0.8 | 2.8 | 1.3 | 9.2 |
| 2020-21 | 2020 21 Totals | 51 | 12 | 20.5 | 2.9-6.4 | 44.6 | 0.6-2.4 | 25.8 | 0.9-1.5 | 59.2 | 0.6 | 2.8 | 3.5 | 1.9 | 0.8 | 0.8 | 2.4 | 1.1 | 7.2 |
| 2021-22 | Brooklyn Nets | 62 | 10 | 19.2 | 2.3-5.0 | 46.9 | 0.4-1.4 | 27.1 | 0.5-0.9 | 52.7 | 0.8 | 2.6 | 3.5 | 2.1 | 0.5 | 0.5 | 2.6 | 0.8 | 5.5 |
| 2022-23 | Indiana Pacers | 18 | 1 | 9.0 | 1.2-2.7 | 44.9 | 0.2-0.8 | 20.0 | 0.2-0.4 | 50.0 | 0.2 | 1.4 | 1.7 | 0.8 | 0.3 | 0.4 | 1.8 | 0.4 | 2.8 |
| 2023-24 | Indiana Pacers | 9 | 0 | 5.2 | 0.3-1.1 | 30.0 | 0.0-0.2 | 0.0 | 0.2-0.2 | 100.0 | 0.1 | 0.3 | 0.4 | 0.9 | 0.1 | 0.6 | 1.0 | 0.6 | 0.9 |
| 2024-25 | Indiana Pacers | 12 | 0 | 3.1 | 0.3-0.9 | 36.4 | 0.0-0.3 | 0.0 | 0.0-0.1 | 0.0 | 0.0 | 0.5 | 0.5 | 0.3 | 0.2 | 0.0 | 0.4 | 0.3 | 0.7 |
| Career | — | 786 | 243 | 19.8 | 2.9-6.2 | 47.3 | 0.5-1.6 | 30.0 | 1.1-1.6 | 67.8 | 0.8 | 2.7 | 3.5 | 2.0 | 0.8 | 0.7 | 2.2 | 1.3 | 7.4 |
Regular Season Totals
| Season | Team | FG | FG% | 3PT | 3P% | FT | FT% | OR | DR | REB | AST | BLK | STL | PF | TO | PTS |
|---|---|---|---|---|---|---|---|---|---|---|---|---|---|---|---|---|
| 2009-10 | Chicago Bulls | 95-210 | 45.2 | 15-46 | 32.6 | 51-70 | 72.9 | 34 | 94 | 128 | 48 | 43 | 21 | 126 | 62 | 256 |
| 2010-11 | Chicago Bulls | 17-41 | 41.5 | 2-9 | 22.2 | 6-13 | 46.2 | 6 | 18 | 24 | 14 | 9 | 8 | 25 | 18 | 42 |
| 2010-11 | Toronto Raptors | 91-196 | 46.4 | 6-25 | 24.0 | 41-58 | 70.7 | 31 | 87 | 118 | 75 | 28 | 25 | 70 | 46 | 229 |
| 2010-11 | 2010 11 Totals | 108-237 | 45.6 | 8-34 | 23.5 | 47-71 | 66.2 | 37 | 105 | 142 | 89 | 37 | 33 | 95 | 64 | 271 |
| 2011-12 | Toronto Raptors | 233-518 | 45.0 | 19-60 | 31.7 | 81-115 | 70.4 | 74 | 218 | 292 | 122 | 84 | 71 | 177 | 101 | 566 |
| 2012-13 | Sacramento Kings | 117-283 | 41.3 | 2-21 | 9.5 | 40-67 | 59.7 | 49 | 96 | 145 | 58 | 50 | 41 | 99 | 68 | 276 |
| 2013-14 | Memphis Grizzlies | 143-308 | 46.4 | 22-87 | 25.3 | 76-90 | 84.4 | 60 | 106 | 166 | 111 | 57 | 42 | 102 | 66 | 384 |
| 2014-15 | Toronto Raptors | 238-404 | 58.9 | 11-51 | 21.6 | 67-102 | 65.7 | 61 | 196 | 257 | 95 | 70 | 54 | 155 | 79 | 554 |
| 2015-16 | Toronto Raptors | 114-240 | 47.5 | 20-66 | 30.3 | 39-68 | 57.4 | 28 | 98 | 126 | 67 | 33 | 29 | 84 | 54 | 287 |
| 2016-17 | Miami Heat | 368-769 | 47.9 | 87-256 | 34.0 | 152-215 | 70.7 | 66 | 310 | 376 | 276 | 86 | 76 | 197 | 171 | 975 |
| 2017-18 | Miami Heat | 309-614 | 50.3 | 57-185 | 30.8 | 113-162 | 69.8 | 61 | 297 | 358 | 280 | 51 | 70 | 192 | 142 | 788 |
| 2018-19 | Miami Heat | 164-379 | 43.3 | 50-149 | 33.6 | 50-70 | 71.4 | 22 | 154 | 176 | 135 | 27 | 35 | 114 | 74 | 428 |
| 2019-20 | Miami Heat | 39-87 | 44.8 | 16-45 | 35.6 | 8-14 | 57.1 | 8 | 44 | 52 | 21 | 13 | 6 | 34 | 15 | 102 |
| 2019-20 | Minnesota Timberwolves | 64-128 | 50.0 | 17-46 | 37.0 | 23-34 | 67.6 | 17 | 49 | 66 | 53 | 19 | 19 | 46 | 33 | 168 |
| 2019-20 | 2019 20 Totals | 103-215 | 47.9 | 33-91 | 36.3 | 31-48 | 64.6 | 25 | 93 | 118 | 74 | 32 | 25 | 80 | 48 | 270 |
| 2020-21 | Dallas Mavericks | 67-145 | 46.2 | 15-60 | 25.0 | 17-29 | 58.6 | 14 | 72 | 86 | 50 | 23 | 24 | 59 | 27 | 166 |
| 2020-21 | New Orleans Pelicans | 79-182 | 43.4 | 16-60 | 26.7 | 28-47 | 59.6 | 18 | 73 | 91 | 48 | 19 | 18 | 61 | 28 | 202 |
| 2020-21 | 2020 21 Totals | 146-327 | 44.6 | 31-120 | 25.8 | 45-76 | 59.2 | 32 | 145 | 177 | 98 | 42 | 42 | 120 | 55 | 368 |
| 2021-22 | Brooklyn Nets | 144-307 | 46.9 | 23-85 | 27.1 | 29-55 | 52.7 | 51 | 164 | 215 | 130 | 34 | 30 | 162 | 48 | 340 |
| 2022-23 | Indiana Pacers | 22-49 | 44.9 | 3-15 | 20.0 | 4-8 | 50.0 | 4 | 26 | 30 | 15 | 6 | 7 | 32 | 8 | 51 |
| 2023-24 | Indiana Pacers | 3-10 | 30.0 | 0-2 | 0.0 | 2-2 | 100.0 | 1 | 3 | 4 | 8 | 1 | 5 | 9 | 5 | 8 |
| 2024-25 | Indiana Pacers | 4-11 | 36.4 | 0-3 | 0.0 | 0-1 | 0.0 | 0 | 6 | 6 | 4 | 2 | 0 | 5 | 4 | 8 |
| Career | — | 2311-4881 | 47.3 | 381-1271 | 30.0 | 827-1220 | 67.8 | 605 | 2111 | 2716 | 1610 | 655 | 581 | 1749 | 1049 | 5830 |
Regular Season Misc Totals
| Season | Team | DD2 | TD3 | DQ | EJECT | TECH | FLAG | AST/TO | STL/TO | SC-EFF | SH-EFF |
|---|---|---|---|---|---|---|---|---|---|---|---|
| 2009-10 | Chicago Bulls | 0 | 0 | 3 | 0 | 1 | 0 | 0.8 | 0.3 | 1.219 | 0.49 |
| 2010-11 | Chicago Bulls | 0 | 0 | 1 | 0 | 0 | 0 | 0.8 | 0.4 | 1.024 | 0.44 |
| 2010-11 | Toronto Raptors | 0 | 0 | 0 | 0 | 0 | 1 | 1.6 | 0.5 | 1.168 | 0.48 |
| 2010-11 | 2010 11 Totals | 0 | 0 | 1 | 0 | 0 | 1 | 1.4 | 0.5 | 1.143 | 0.47 |
| 2011-12 | Toronto Raptors | 3 | 0 | 3 | 0 | 0 | 1 | 1.2 | 0.7 | 1.093 | 0.47 |
| 2012-13 | Sacramento Kings | 0 | 0 | 0 | 0 | 2 | 0 | 0.9 | 0.6 | 0.975 | 0.42 |
| 2013-14 | Memphis Grizzlies | 1 | 0 | 1 | 0 | 1 | 0 | 1.7 | 0.6 | 1.247 | 0.50 |
| 2014-15 | Toronto Raptors | 2 | 0 | 1 | 0 | 4 | 0 | 1.2 | 0.7 | 1.371 | 0.60 |
| 2015-16 | Toronto Raptors | 0 | 0 | 0 | 0 | 0 | 0 | 1.2 | 0.5 | 1.196 | 0.52 |
| 2016-17 | Miami Heat | 4 | 0 | 3 | 2 | 8 | 0 | 1.6 | 0.4 | 1.268 | 0.54 |
| 2017-18 | Miami Heat | 6 | 0 | 2 | 1 | 1 | 0 | 2.0 | 0.5 | 1.283 | 0.55 |
| 2018-19 | Miami Heat | 0 | 0 | 0 | 0 | 1 | 0 | 1.8 | 0.5 | 1.129 | 0.50 |
| 2019-20 | Miami Heat | 0 | 0 | 2 | 0 | 0 | 1 | 1.4 | 0.4 | 1.172 | 0.54 |
| 2019-20 | Minnesota Timberwolves | 0 | 0 | 1 | 0 | 0 | 0 | 1.6 | 0.6 | 1.313 | 0.57 |
| 2019-20 | 2019 20 Totals | 0 | 0 | 2 | 0 | 0 | 1 | 1.5 | 0.5 | 1.256 | 0.56 |
| 2020-21 | Dallas Mavericks | 0 | 0 | 0 | 1 | 2 | 2 | 1.9 | 0.9 | 1.145 | 0.51 |
| 2020-21 | New Orleans Pelicans | 0 | 0 | 0 | 0 | 3 | 0 | 1.7 | 0.6 | 1.110 | 0.48 |
| 2020-21 | 2020 21 Totals | 0 | 0 | 0 | 1 | 5 | 2 | 1.8 | 0.8 | 1.125 | 0.49 |
| 2021-22 | Brooklyn Nets | 1 | 0 | 4 | 0 | 3 | 1 | 2.7 | 0.6 | 1.107 | 0.51 |
| 2022-23 | Indiana Pacers | 0 | 0 | 1 | 0 | 0 | 0 | 1.9 | 0.9 | 1.041 | 0.48 |
| 2023-24 | Indiana Pacers | 0 | 0 | 0 | 0 | 0 | 0 | 1.6 | 1.0 | 0.800 | 0.30 |
| 2024-25 | Indiana Pacers | 0 | 0 | 0 | 0 | 1 | 0 | 1.0 | 0.0 | 0.727 | 0.36 |
| Career | — | 17 | 0 | 22 | 4 | 27 | 6 | 1.5 | 0.6 | 1.194 | 0.51 |
Scoring, rebounding and assist trend
04 / SHOT CHART AND ZONE SHOOTING
Shot profile
Shot-location data is not connected. Add a BALLDONTLIE GOAT-tier NBA API key in NBA Players → Settings to enable shot charts and zone shooting.
05 / RECORD, TEAM STATS AND TEAMMATES
Team
Overall5-9
Home2-4
Road3-4
DIV0-1
CONF3-6
Last Ten Games3-7
Team records for 2026-27 (regular season).
Team statistics 2026-27
Defensive
| Metric | Total | Per game | NBA rank |
|---|---|---|---|
| Blocks | 59 | 4.214 | 5th |
| Defensive Rebounds | 448 | 32 | 2nd |
| Steals | 101 | 7.214 | 2nd |
| Points Conceded Off Turnovers | 0 | 17 | — |
| Defensive Rebound Rate | 0.0 | — | — |
| Defensive Rebounds Per Game | 32.0 | — | — |
| Blocks Per Game | 4.2 | — | — |
| Steals Per Game | 7.2 | — | — |
| Defensive Rebounds Per 48 | 0.0 | — | — |
| Blocks Per 48 | 0.0 | — | — |
| Steals Per 48 | 0.0 | — | — |
General
| Metric | Total | Per game | NBA rank |
|---|---|---|---|
| Disqualifications | 2 | — | Tied-2nd |
| Flagrant Fouls | 1 | 0.071 | Tied-3rd |
| Fouls | 286 | 20.429 | 3rd |
| Rebound Rate | 48.7 | — | 4th |
| Ejections | 0 | — | — |
| Technical Fouls | 26 | 0.929 | Tied-1st |
| Rebounds | 583 | 41.643 | — |
| Minutes | 0 | — | — |
| Minutes Per Game | 0.0 | — | — |
| Fantasy Rating | 0.0 | — | — |
| Rating | 206.1 | — | — |
| Plus-Minus | -1 | -1 | Tied-1st |
| Game Day of Year | 0 | — | — |
| Rebounds Per Game | 41.6 | — | — |
| Fouls Per Game | 20.4 | — | — |
| Flagrant Fouls Per Game | 0.1 | — | — |
| Technical Fouls Per Game | 1.9 | — | — |
| Ejections Per Game | 0.0 | — | — |
| Disqualifications Per Game | 0.1 | — | — |
| Assist To Turnover Ratio | 2.0 | 2.016 | — |
| Steal To Foul Ratio | 0.4 | 0.353 | — |
| Block To Foul Ratio | 0.2 | 0.206 | — |
| Team Rebounds Per Game | 0.0 | — | — |
| Rebounds | 583 | 41.643 | — |
| Total Technical Fouls | 26 | 0.929 | — |
| Assist To Turnover Ratio | 38.9 | — | — |
| Team Rebounds | 0 | — | — |
| Steal To Turnover Ratio | 0.5 | 0.523 | — |
| Rebounds Per 48 Minutes | 0.0 | — | — |
| Fouls Per 48 Minutes | 0.0 | — | — |
| Flagrant Fouls Per 48 Minutes | 0.0 | — | — |
| Technical Fouls Per 48 Minutes | 0.0 | — | — |
| Ejections Per 48 Minutes | 0.0 | — | — |
| Disqualifications Per 48 Minutes | 0.0 | — | — |
| Games Played | 14 | — | Tied-1st |
| Games Started | 0 | — | — |
| Double Double | 0 | — | — |
| Triple Double | 0 | — | — |
Offensive
| Metric | Total | Per game | NBA rank |
|---|---|---|---|
| Assists | 389 | 27.786 | 1st |
| Effective Field Goal Percentage | 53.8 | — | 3rd |
| Field Goals | 573/1219 | 0.47 | — |
| Field Goals Attempted | 1219 | 87.071 | 3rd |
| Field Goals Made | 573 | 40.929 | 2nd |
| Field Goal Percentage | 47.0 | 0.47 | 2nd |
| Free Throws | 257/336 | 0.765 | — |
| Free Throw Percentage | 76.5 | 0.765 | 2nd |
| Free Throws Attempted | 336 | 24 | 3rd |
| Free Throws Made | 257 | 18.357 | 3rd |
| Offensive Rebounds | 135 | 9.643 | 5th |
| Points | 1569 | 112.071 | 2nd |
| Turnovers | 193 | 13.786 | 3rd |
| 3-Point Field Goal Percentage | 32.8 | 0.328 | 4th |
| 3-Point Field Goals Attempted | 506 | 36.143 | 3rd |
| 3-Point Field Goals Made | 166 | 11.857 | 3rd |
| True Shooting Percentage | 57.4 | — | 3rd |
| Team Turnovers | 10 | — | 2nd |
| Total Turnovers | 203 | 13.786 | — |
| Assist Ratio | 19.9 | — | 1st |
| Points in the Paint | 714 | 51 | 1st |
| Offensive Rebound Rate | 22.7 | — | 5th |
| Turnover Ratio | 12.9 | — | 3rd |
| Fast Break Points | 211 | — | — |
| Possessions | 1435 | — | 1st |
| Pace Factor | 99.1 | — | 4th |
| Average Field Goals Made | 40.9 | — | — |
| Average Field Goals Attempted | 87.1 | — | — |
| Average 3-Point Field Goals Made | 11.9 | — | — |
| Average 3-Point Field Goals Attempted | 36.1 | — | — |
| Average Free Throws Made | 18.4 | — | — |
| Average Free Throws Attempted | 24.0 | — | — |
| Points Per Game | 112.1 | — | — |
| Offensive Rebounds Per Game | 9.6 | — | — |
| Assists Per Game | 27.8 | — | — |
| Turnovers Per Game | 13.8 | — | — |
| Offensive Rebound Percentage | 0.2 | 0.209 | — |
| Estimated Possessions | 1421.4 | 100.814 | — |
| Estimated Possessions Per Game | 101.5 | — | — |
| Points Per Estimated Possession | 1.1 | 1.112 | — |
| Team Turnovers Per Game | 0.7 | — | — |
| Total Turnovers Per Game | 14.5 | — | — |
| 3-Point Field Goal Percentage | 32.8 | 0.328 | 1st |
| 2-Point Field Goals Made | 407.0 | 29.072 | Tied-1st |
| 2-Point Field Goals Attempted | 713.0 | 50.928 | — |
| 2-Point Field Goals Made per Game | 29.1 | — | — |
| 2-Point Field Goals Attempted per Game | 50.9 | — | — |
| 2-Point Field Goal Percentage | 57.1 | 0.571 | — |
| Shooting Efficiency | 0.54 | 0.538 | — |
| Scoring Efficiency | 1.287 | 1.287 | — |
| Fieldgoals Made Per 48 | 0.0 | — | — |
| Fieldgoals Attempted Per 48 | 0.0 | — | — |
| 3-Point Fieldgoals Made Per 48 | 0.0 | — | — |
| 3-Point Fieldgoals Attempted Per 48 | 0.0 | — | — |
| Freethrows Made Per 48 | 0.0 | — | — |
| Freethrows Attempted Per 48 | 0.0 | — | — |
| Points Scored Per 48 | 0.0 | — | — |
| Offensive Rebounds Per 48 | 0.0 | — | — |
| Assists Per 48 | 0.0 | — | — |
| Turnovers | 0.0 | — | — |
Teammates
 Aaron NesmithG #23
 Andrew NembhardG #2
 Ben SheppardG #26
 Braden SmithG #3
 Ethan ThompsonG #55
 Ivica ZubacC #40
 Jalen SlawsonF #18
 Jarace WalkerF #5
 Jay HuffC #32
 Johnny FurphyG #12
 Keba KeitaC #13
 Kelly Oubre Jr.G #10
 Kobe BrownG #24
 Larry Nance Jr.F #22
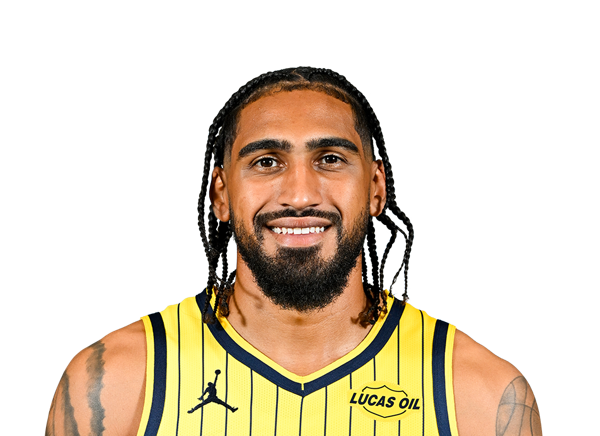 Obi ToppinF #1
 Pascal SiakamF #43
 Quenton JacksonG #29
 Rienk MastF #51
 T.J. McConnellG #9
 Tyrese HaliburtonG
06 / SALARY BY SEASON
Contract
| Season | Salary |
|---|---|
| 2013-14 | $634,610 |
| 2014-15 | $2.5M |
| 2015-16 | $2.5M |
| 2016-17 | $4M |
| 2017-18 | $14.65M |
| 2018-19 | $14.65M |
| 2019-20 | $15.35M |
| 2020-21 | $16.05M |
| 2021-22 | $1.67M |
| 2022-23 | $590,926 |
| 2023-24 | $777,703 |
| 2024-25 | $2.09M |
Total listed: $75.46M · source: espn.
07 / LATEST REPORT
Injury status
No current injury report entry for this player.
08 / SIGNINGS, TRADES AND ROSTER MOVES
Transactions
- Waived Cs Keba Keita, Rienk Mast and F James Johnson.
09 / LATEST COVERAGE
Player news
LATEST UPDATEJohnson was waived by the Pacers on Saturday, Tony East of Forbes.com reports.
Johnson signed a training camp contract with the Pacers but won't be on the initial regular-season roster. He last played in the NBA with Indiana in the 2024-25 season.
8 April 2022Brooklyn Nets waive forward James Johnson, clearing way for team to convert Kessler Edwards to NBA contract↗
24 December 2021James Harden, Paul Millsap, Jevon Carter clear protocols for Brooklyn Nets, set to play Christmas Day↗
16 December 2021Kevin Durant carries Nets to OT win as Brooklyn's COVID-19 protocols list grows to seven, including James Harden↗
4 August 2021Brooklyn Nets adding Patty Mills, retaining Bruce Brown, agents say↗
27 March 2021Sources: New Orleans Pelicans sending JJ Redick to Dallas Mavericks↗
2 January 2021NBA issues $85,000 in fines for Charlotte Hornets-Dallas Mavericks dustup↗
21 November 2020Trevor Ariza to Oklahoma City Thunder in 3-team trade with Detroit Pistons, Dallas Mavericks↗
7 February 2020Dion Waiters lands with Grizzlies in six-player trade with Heat↗
10 / BIO, DRAFT AND CONTACT DETAILS
Biography & profile
TeamIndiana Pacers
PositionForward
Jersey16
Height6' 7"
Weight240 lbs
Age39
CollegeWake Forest
StatusFree Agent