Click a season to open this player’s full game log, splits and advanced stats for that year; click a team to open its page. A dash means no NBA games were recorded.
03 / EVERY CATEGORY THE PROVIDER REPORTS
Full statistical breakdown
Regular season 2026-27
Defensive
Metric
Total
NBA rank
Blocks
1
Tied-289th
Defensive Rebounds
66
Tied-32nd
Steals
12
Tied-89th
Defensive Rebound Rate
0.0
—
Defensive Rebounds Per Game
5.1
Tied-38th
Blocks Per Game
0.1
Tied-257th
Steals Per Game
0.9
100th
Defensive Rebounds Per 48
7.6
Tied-1,536th
Blocks Per 48
0.1
Tied-13,872nd
Steals Per 48
1.4
Tied-4,272nd
General
Metric
Total
NBA rank
Disqualifications
1
Tied-4th
Flagrant Fouls
0
Tied-22nd
Fouls
35
Tied-44th
Player Efficiency Rating
21.32
30th
Rebound Rate
0.0
—
Ejections
0
Tied-7th
Technical Fouls
2
Tied-12th
Rebounds
81
—
Value Over Replacement Player
0.0
—
Minutes
419
1st
Minutes Per Game
32.2
—
Rating
37.1
Tied-41st
Plus-Minus
-15
Tied-1st
Rebounds Per Game
6.2
Tied-52nd
Fouls Per Game
2.7
Tied-69th
Flagrant Fouls Per Game
0.0
Tied-19th
Technical Fouls Per Game
0.2
23rd
Ejections Per Game
0.0
Tied-6th
Disqualifications Per Game
0.1
Tied-13th
Assist To Turnover Ratio
1.9
—
Steal To Foul Ratio
0.3
—
Block To Foul Ratio
0.0
—
Team Rebounds Per Game
0.0
—
Rebounds
81
—
Total Technical Fouls
2
—
Assist To Turnover Ratio
0.0
—
Steal To Turnover Ratio
0.4
—
Rebounds Per 48 Minutes
9.3
—
Fouls Per 48 Minutes
4.0
Tied-2,112th
Flagrant Fouls Per 48 Minutes
0.0
Tied-1,056th
Technical Fouls Per 48 Minutes
0.2
Tied-576th
Ejections Per 48 Minutes
0.0
Tied-336th
Disqualifications Per 48 Minutes
0.1
Tied-192nd
R/40
7.7
—
Games Played
13
13th
Games Started
13
Tied-22nd
Double Double
2
Tied-39th
Triple Double
0
Tied-12th
Offensive
Metric
Total
NBA rank
Assists
52
Tied-52nd
Effective Field Goal Percentage
56.4
—
Field Goals
109/212
—
Field Goals Attempted
212
Tied-20th
Field Goals Made
109
9th
Field Goal Percentage
51.4
25th
Free Throws
61/84
—
Free Throw Percentage
72.6
189th
Free Throws Attempted
84
Tied-15th
Free Throws Made
61
Tied-25th
Offensive Rebounds
15
Tied-94th
Points
300
11th
Turnovers
27
Tied-57th
3-Point Field Goal Percentage
33.9
Tied-150th
3-Point Field Goals Attempted
62
Tied-79th
3-Point Field Goals Made
21
Tied-91st
True Shooting Percentage
60.3
—
Total Turnovers
27
—
Assist Ratio
15.9
—
Points in the Paint
0
Tied-1st
Offensive Rebound Rate
0.0
—
Turnover Ratio
8.2
—
Brick Index
0.00
—
Usage Rate
0.0
—
Average Field Goals Made
8.4
18th
Average Field Goals Attempted
16.3
443rd
Average 3-Point Field Goals Made
1.6
Tied-107th
Average 3-Point Field Goals Attempted
4.8
Tied-86th
Average Free Throws Made
4.7
30th
Average Free Throws Attempted
6.5
21st
Points Per Game
23.1
20th
Offensive Rebounds Per Game
1.2
Tied-104th
Assists Per Game
4.0
Tied-58th
Turnovers Per Game
2.1
64th
Offensive Rebound Percentage
0.1
—
Estimated Possessions
257.6
—
Estimated Possessions Per Game
19.8
—
Points Per Estimated Possession
1.2
—
Team Turnovers Per Game
0.0
—
Total Turnovers Per Game
2.1
—
3-Point Field Goal Percentage
33.9
—
2-Point Field Goals Made
88.0
100th
2-Point Field Goals Attempted
150.0
59th
2-Point Field Goals Made per Game
6.8
—
2-Point Field Goals Attempted per Game
11.5
—
2-Point Field Goal Percentage
58.7
25th
Shooting Efficiency
0.56
—
Scoring Efficiency
1.415
—
Fieldgoals Made Per 48
12.5
432nd
Fieldgoals Attempted Per 48
24.3
Tied-960th
3-Point Fieldgoals Made Per 48
2.4
Tied-4,368th
3-Point Fieldgoals Attempted Per 48
7.1
Tied-3,792nd
Freethrows Made Per 48
7.0
Tied-1,200th
Freethrows Attempted Per 48
9.6
Tied-720th
Points Scored Per 48
34.4
528th
Offensive Rebounds Per 48
1.7
Tied-4,512th
Assists Per 48
6.0
Tied-2,496th
Turnovers
3.1
Tied-2,736th
P/40
28.6
—
A/40
5.0
—
04 / EFFICIENCY, SHOOTING PROFILE, PER-36
Advanced metrics
True shooting %60.3%
Effective FG %56.4%
2-point FG %59.1%
3-point attempt rate29.4%
Free throw rate39.9%
Points per shot attempt1.42
% of points from 3s20.8%
Assist-to-turnover1.90
Points per 36 min25.8
Rebounds per 36 min6.9
Assists per 36 min4.5
Steals per 36 min1.01
Blocks per 36 min0.11
Turnovers per 36 min2.35
Stocks (STL + BLK) per game1.00
Pts + Reb + Ast per game33.3
Efficiency (EFF) per game22.5
Game Score per game (Hollinger)17.3
Minutes per game32.2
Calculated by BallersCulture from the supplied 2026-27 box-score totals using standard formulas (hover a tile to see the formula). Tracking-based metrics such as BPM, VORP, on/off and RAPTOR are not available from this data source.
05 / 13 GAMES IN 2026-27
Game log: Regular season
Date
Opp
Result
MIN
FG
FG%
3PT
3P%
FT
FT%
REB
AST
BLK
STL
PF
TO
PTS
Nov 16
@ PHI
L 131-124
34
12-19
63.2
0-3
0.0
7-8
87.5
2
2
0
1
1
1
31
Nov 14
vs NY
W 106-104
32
5-13
38.5
2-4
50.0
7-12
58.3
3
2
0
0
4
3
19
Nov 12
vs WSH
W 114-101
32
7-17
41.2
2-7
28.6
12-12
100.0
8
5
0
1
1
2
28
Nov 10
@ DAL
L 125-122
35
9-16
56.3
5-8
62.5
6-8
75.0
9
8
0
2
3
0
29
Nov 8
vs DEN
L 114-102
32
10-18
55.6
2-7
28.6
1-2
50.0
2
5
0
0
3
0
23
Nov 5
@ MEM
W 107-103
30
8-13
61.5
2-5
40.0
2-2
100.0
5
2
1
2
3
0
20
Nov 2
vs BKN
L 98-90
36
6-14
42.9
0-2
0.0
5-6
83.3
5
5
0
1
3
3
17
Oct 31
@ MIA
L 145-125
29
5-17
29.4
0-5
0.0
3-5
60.0
5
4
0
2
1
3
13
Oct 29
vs PHI
L 114-109
34
11-17
64.7
0-3
0.0
4-4
100.0
11
3
0
1
6
3
26
Oct 27
@ MIL
L 110-102
37
8-17
47.1
1-4
25.0
3-4
75.0
13
6
0
0
1
4
20
Oct 26
@ BKN
W 136-109
26
7-15
46.7
3-6
50.0
4-6
66.7
7
6
0
1
3
1
21
Oct 24
vs DAL
L 121-105
29
8-13
61.5
3-5
60.0
4-7
57.1
3
3
0
0
3
5
23
Oct 22
@ NO
W 123-120
35
13-23
56.5
1-3
33.3
3-8
37.5
8
1
0
1
3
2
30
06 / 2026-27 HOME / AWAY, RESULTS, MONTHS AND OPPONENTS
Splits
split
Split
GP
MIN
FG
FG%
3PT
3P%
FT
FT%
OR
DR
REB
AST
BLK
STL
PF
TO
PTS
All Splits
13
32.2
8.4-16.3
51.4
1.6-4.8
33.9
4.7-6.5
72.6
1.2
5.1
6.2
4.0
0.1
0.9
2.7
2.1
23.1
Home
5
32.6
7.4-14.8
50.0
1.4-4.2
33.3
6.4-8.2
78.0
1.4
4.6
6.0
3.6
0.0
0.6
3.4
3.2
22.6
Road
7
32.1
8.9-17.1
51.7
1.7-4.9
35.3
4.0-5.9
68.3
1.1
5.9
7.0
4.1
0.1
1.3
2.1
1.6
23.4
vs. Division
1
37.0
8.0-17.0
47.1
1.0-4.0
25.0
3.0-4.0
75.0
4.0
9.0
13.0
6.0
0.0
0.0
1.0
4.0
20.0
vs. Conference
8
32.3
7.6-16.1
47.3
1.0-4.3
23.5
5.6-7.1
78.9
1.6
5.1
6.8
4.1
0.0
0.9
2.5
2.5
21.9
3+ Days Rest
1
35.0
13.0-23.0
56.5
1.0-3.0
33.3
3.0-8.0
37.5
2.0
6.0
8.0
1.0
0.0
1.0
3.0
2.0
30.0
Month
Split
GP
MIN
FG
FG%
3PT
3P%
FT
FT%
OR
DR
REB
AST
BLK
STL
PF
TO
PTS
October
6
31.7
8.7-17.0
51.0
1.3-4.3
30.8
3.5-5.7
61.8
1.5
6.3
7.8
3.8
0.0
0.8
2.8
3.0
22.2
November
7
32.9
8.1-15.7
51.8
1.9-5.1
36.1
5.7-7.1
80.0
0.9
4.0
4.9
4.1
0.1
1.0
2.6
1.3
23.9
Pre All-Star
13
32.2
8.4-16.3
51.4
1.6-4.8
33.9
4.7-6.5
72.6
1.2
5.1
6.2
4.0
0.1
0.9
2.7
2.1
23.1
Result
Split
GP
MIN
FG
FG%
3PT
3P%
FT
FT%
OR
DR
REB
AST
BLK
STL
PF
TO
PTS
Wins
5
31.0
8.0-16.2
49.4
2.0-5.0
40.0
5.6-8.0
70.0
1.2
5.0
6.2
3.2
0.2
1.0
2.8
1.6
23.6
Losses
8
33.0
8.6-16.4
52.7
1.4-4.6
29.7
4.1-5.5
75.0
1.1
5.1
6.3
4.5
0.0
0.9
2.6
2.4
22.8
Position
Split
GP
MIN
FG
FG%
3PT
3P%
FT
FT%
OR
DR
REB
AST
BLK
STL
PF
TO
PTS
As Starter
13
32.2
8.4-16.3
51.4
1.6-4.8
33.9
4.7-6.5
72.6
1.2
5.1
6.2
4.0
0.1
0.9
2.7
2.1
23.1
Day
Split
GP
MIN
FG
FG%
3PT
3P%
FT
FT%
OR
DR
REB
AST
BLK
STL
PF
TO
PTS
Monday
2
36.0
8.5-16.5
51.5
3.0-6.0
50.0
4.5-6.0
75.0
2.0
9.0
11.0
7.0
0.0
1.0
2.0
2.0
24.5
Wednesday
4
32.8
9.8-17.5
55.7
1.3-4.5
27.8
5.3-6.5
80.8
1.5
6.5
8.0
2.8
0.3
1.3
3.3
1.8
26.0
Friday
3
30.0
6.0-14.3
41.9
1.7-4.7
35.7
4.7-8.0
58.3
1.0
2.7
3.7
3.0
0.0
0.7
2.7
3.7
18.3
Saturday
1
32.0
10.0-18.0
55.6
2.0-7.0
28.6
1.0-2.0
50.0
0.0
2.0
2.0
5.0
0.0
0.0
3.0
0.0
23.0
Sunday
3
31.7
8.3-16.0
52.1
1.0-3.7
27.3
5.3-6.7
80.0
0.7
4.0
4.7
4.3
0.0
1.0
2.3
1.7
23.0
Opponent
Split
GP
MIN
FG
FG%
3PT
3P%
FT
FT%
OR
DR
REB
AST
BLK
STL
PF
TO
PTS
Brooklyn Nets
2
30.5
6.5-14.5
44.8
1.5-4.0
37.5
4.5-6.0
75.0
1.0
5.0
6.0
5.5
0.0
1.0
3.0
2.0
19.0
Dallas Mavericks
2
32.0
8.5-14.5
58.6
4.0-6.5
61.5
5.0-7.5
66.7
0.0
6.0
6.0
5.5
0.0
1.0
3.0
2.5
26.0
Denver Nuggets
1
32.0
10.0-18.0
55.6
2.0-7.0
28.6
1.0-2.0
50.0
0.0
2.0
2.0
5.0
0.0
0.0
3.0
0.0
23.0
Memphis Grizzlies
1
30.0
8.0-13.0
61.5
2.0-5.0
40.0
2.0-2.0
100.0
0.0
5.0
5.0
2.0
1.0
2.0
3.0
0.0
20.0
Miami Heat
1
29.0
5.0-17.0
29.4
0.0-5.0
0.0
3.0-5.0
60.0
2.0
3.0
5.0
4.0
0.0
2.0
1.0
3.0
13.0
Milwaukee Bucks
1
37.0
8.0-17.0
47.1
1.0-4.0
25.0
3.0-4.0
75.0
4.0
9.0
13.0
6.0
0.0
0.0
1.0
4.0
20.0
New Orleans Pelicans
1
35.0
13.0-23.0
56.5
1.0-3.0
33.3
3.0-8.0
37.5
2.0
6.0
8.0
1.0
0.0
1.0
3.0
2.0
30.0
New York Knicks
1
32.0
5.0-13.0
38.5
2.0-4.0
50.0
7.0-12.0
58.3
1.0
2.0
3.0
2.0
0.0
0.0
4.0
3.0
19.0
Philadelphia 76ers
2
34.0
11.5-18.0
63.9
0.0-3.0
0.0
5.5-6.0
91.7
0.5
6.0
6.5
2.5
0.0
1.0
3.5
2.0
28.5
Washington Wizards
1
32.0
7.0-17.0
41.2
2.0-7.0
28.6
12.0-12.0
100.0
3.0
5.0
8.0
5.0
0.0
1.0
1.0
2.0
28.0
07 / SEASON-BY-SEASON HISTORY
Career statistics
Regular Season Averages
Season
Team
GP
GS
MIN
FG
FG%
3PT
3P%
FT
FT%
OR
DR
REB
AST
BLK
STL
PF
TO
PTS
2016-17
Toronto Raptors
55
38
15.6
1.9-3.7
50.2
0.0-0.1
14.3
0.4-0.6
68.8
1.2
2.2
3.4
0.3
0.8
0.5
2.0
0.6
4.2
2017-18
Toronto Raptors
81
5
20.7
3.1-6.1
50.8
0.4-1.6
22.0
0.7-1.1
62.1
1.0
3.5
4.5
2.0
0.5
0.8
2.0
0.8
7.3
2018-19
Toronto Raptors
80
79
31.9
6.5-11.8
54.9
1.0-2.7
36.9
3.0-3.8
78.5
1.6
5.3
6.9
3.1
0.7
0.9
3.0
1.9
16.9
2019-20
Toronto Raptors
60
60
35.2
8.3-18.4
45.3
2.2-6.1
35.9
4.0-5.1
79.2
1.1
6.3
7.3
3.5
0.9
1.0
2.8
2.5
22.9
2020-21
Toronto Raptors
56
56
35.8
7.8-17.2
45.5
1.3-4.4
29.7
4.4-5.4
82.7
1.7
5.5
7.2
4.5
0.7
1.1
3.1
2.3
21.4
2021-22
Toronto Raptors
68
68
37.9
8.8-17.8
49.4
1.1-3.2
34.4
4.2-5.6
74.9
1.9
6.6
8.5
5.3
0.6
1.3
3.3
2.7
22.8
2022-23
Toronto Raptors
71
71
37.4
8.9-18.5
48.0
1.3-4.0
32.4
5.2-6.7
77.4
1.8
6.0
7.8
5.8
0.5
0.9
3.2
2.4
24.2
2023-24
Toronto Raptors
39
39
34.7
8.3-16.0
52.2
1.2-3.7
31.7
4.3-5.7
75.8
1.4
4.9
6.3
4.9
0.3
0.8
2.2
2.1
22.2
2023-24
Indiana Pacers
41
41
31.8
8.7-15.8
54.9
1.0-2.5
38.6
3.0-4.2
69.9
2.1
5.7
7.8
3.7
0.4
0.8
2.6
1.4
21.3
2023-24
2023 24 Totals
80
80
33.2
8.5-15.9
53.6
1.1-3.1
34.6
3.6-5.0
73.2
1.7
5.3
7.1
4.3
0.3
0.8
2.4
1.8
21.7
2024-25
Indiana Pacers
78
78
32.7
7.9-15.2
51.9
1.6-4.2
38.9
2.9-3.9
73.4
1.7
5.2
6.9
3.4
0.5
0.9
2.4
1.4
20.2
2025-26
Indiana Pacers
62
62
33.2
9.0-18.6
48.4
1.7-4.7
35.8
4.2-6.1
69.3
1.4
5.2
6.6
3.8
0.4
1.1
2.4
2.2
24.0
2026-27
Indiana Pacers
13
13
32.2
8.4-16.3
51.4
1.6-4.8
33.9
4.7-6.5
72.6
1.2
5.1
6.2
4.0
0.1
0.9
2.7
2.1
23.1
Career
—
704
610
31.4
7.1-14.3
49.7
1.2-3.4
34.2
3.3-4.3
75.3
1.5
5.1
6.6
3.6
0.6
0.9
2.7
1.8
18.6
Regular Season Totals
Season
Team
FG
FG%
3PT
3P%
FT
FT%
OR
DR
REB
AST
BLK
STL
PF
TO
PTS
2016-17
Toronto Raptors
103-205
50.2
1-7
14.3
22-32
68.8
64
121
185
17
45
26
109
33
229
2017-18
Toronto Raptors
253-498
50.8
29-132
22.0
54-87
62.1
79
285
364
159
42
62
166
67
589
2018-19
Toronto Raptors
519-945
54.9
79-214
36.9
237-302
78.5
124
425
549
248
52
73
241
154
1354
2019-20
Toronto Raptors
500-1104
45.3
131-365
35.9
240-303
79.2
64
375
439
207
53
61
170
148
1371
2020-21
Toronto Raptors
437-961
45.5
73-246
29.7
249-301
82.7
95
310
405
250
37
64
174
130
1196
2021-22
Toronto Raptors
596-1207
49.4
75-218
34.4
284-379
74.9
128
452
580
360
42
85
225
181
1551
2022-23
Toronto Raptors
630-1313
48.0
93-287
32.4
367-474
77.4
131
425
556
415
36
65
228
169
1720
2023-24
Toronto Raptors
325-623
52.2
46-145
31.7
169-223
75.8
54
192
246
190
10
32
87
83
865
2023-24
Indiana Pacers
356-648
54.9
39-101
38.6
121-173
69.9
85
234
319
152
15
31
106
58
872
2023-24
2023 24 Totals
681-1271
53.6
85-246
34.6
290-396
73.2
139
426
565
342
25
63
193
141
1737
2024-25
Indiana Pacers
613-1182
51.9
126-324
38.9
226-308
73.4
133
407
540
263
42
70
189
109
1578
2025-26
Indiana Pacers
559-1155
48.4
105-293
35.8
262-378
69.3
89
322
411
236
25
69
147
138
1485
2026-27
Indiana Pacers
109-212
51.4
21-62
33.9
61-84
72.6
15
66
81
52
1
12
35
27
300
Career
—
5000-10053
49.7
818-2394
34.2
2292-3044
75.3
1061
3614
4675
2549
400
650
1877
1297
13110
Regular Season Misc Totals
Season
Team
DD2
TD3
DQ
EJECT
TECH
FLAG
AST/TO
STL/TO
SC-EFF
SH-EFF
2016-17
Toronto Raptors
0
0
0
0
0
0
0.5
0.8
1.117
0.50
2017-18
Toronto Raptors
0
0
0
0
0
0
2.4
0.9
1.183
0.54
2018-19
Toronto Raptors
18
0
4
0
5
0
1.6
0.5
1.433
0.59
2019-20
Toronto Raptors
12
0
1
0
7
0
1.4
0.4
1.242
0.51
2020-21
Toronto Raptors
13
1
4
0
1
0
1.9
0.5
1.245
0.49
2021-22
Toronto Raptors
30
2
6
0
5
0
2.0
0.5
1.285
0.52
2022-23
Toronto Raptors
24
2
5
0
6
1
2.5
0.4
1.310
0.52
2023-24
Toronto Raptors
5
0
0
0
2
0
2.3
0.4
1.388
0.56
2023-24
Indiana Pacers
10
1
1
0
2
0
2.6
0.5
1.346
0.58
2023-24
2023 24 Totals
15
1
1
0
4
0
2.4
0.4
1.367
0.57
2024-25
Indiana Pacers
11
0
0
0
2
2
2.4
0.6
1.335
0.57
2025-26
Indiana Pacers
10
0
1
1
10
1
1.7
0.5
1.286
0.53
2026-27
Indiana Pacers
2
0
1
0
2
0
1.9
0.4
1.415
0.56
Career
—
135
6
23
1
42
4
2.0
0.5
1.304
0.54
Scoring, rebounding and assist trend
08 / SHOT CHART AND ZONE SHOOTING
Shot profile
Shot-location data is not connected. Add a BALLDONTLIE GOAT-tier NBA API key in NBA Players → Settings to enable shot charts and zone shooting.
LATEST UPDATESiakam recorded 31 points (12-19 FG, 0-3 3Pt, 7-8 FT), two rebounds, two assists and one steal across 34 minutes during Sunday's 131-124 loss to Philadelphia.
Siakam was ultra efficient en route to a season- and team-high 31 points, but it wasn't enough to extend Indiana's win streak to three games. He's now led the Pacers in scoring in five consecutive outings, as he's averaging 26.0 points per contest over that same stretch. Siakam should continue racking up stats across the board as the main cog in Indiana's offensive machine while Tyrese Haliburton (hamstring) remains sidelined.




 Aaron NesmithG #23
 Andrew NembhardG #2
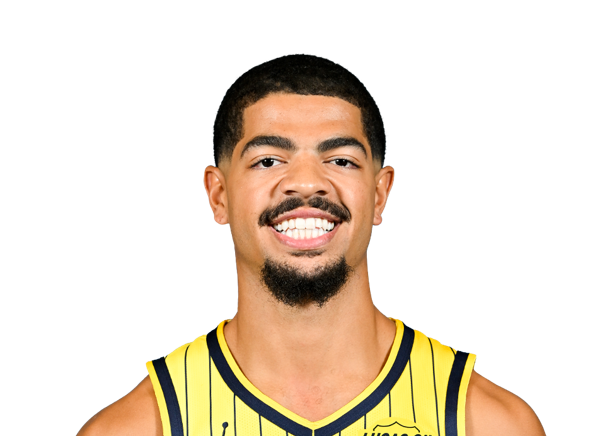 Ben SheppardG #26
 Braden SmithG #3
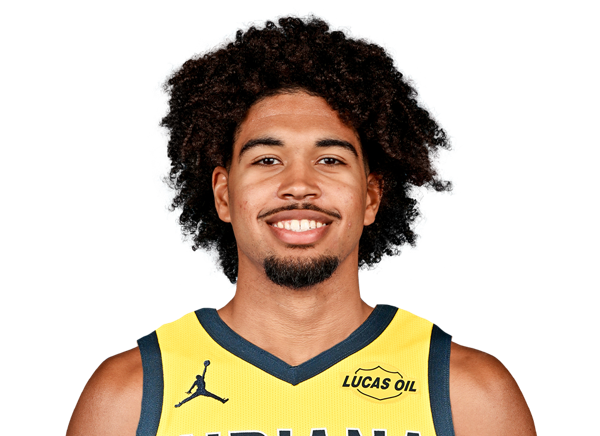 Ethan ThompsonG #55
 Ivica ZubacC #40
 Jalen SlawsonF #18
 James JohnsonF #16
 Jarace WalkerF #5
 Jay HuffC #32
 Johnny FurphyG #12
 Keba KeitaC #13
 Kelly Oubre Jr.G #10
 Kobe BrownG #24
 Larry Nance Jr.F #22
 Obi ToppinF #1
 Quenton JacksonG #29
 Rienk MastF #51
 T.J. McConnellG #9
 Tyrese HaliburtonG