Click a season to open this player’s full game log, splits and advanced stats for that year; click a team to open its page. A dash means no NBA games were recorded.
03 / EVERY CATEGORY THE PROVIDER REPORTS
Full statistical breakdown
Regular season 2026-27
Defensive
Metric
Total
NBA rank
Blocks
3
Tied-194th
Defensive Rebounds
29
Tied-190th
Steals
10
Tied-138th
Defensive Rebound Rate
0.0
—
Defensive Rebounds Per Game
2.2
Tied-188th
Blocks Per Game
0.2
Tied-182nd
Steals Per Game
0.8
142nd
Defensive Rebounds Per 48
5.5
3,040th
Blocks Per 48
0.6
3,104th
Steals Per 48
1.9
2,208th
General
Metric
Total
NBA rank
Disqualifications
0
Tied-22nd
Flagrant Fouls
0
Tied-24th
Fouls
27
Tied-143rd
Player Efficiency Rating
7.31
270th
Rebound Rate
0.0
—
Ejections
0
Tied-7th
Technical Fouls
0
Tied-104th
Rebounds
44
—
Value Over Replacement Player
0.0
—
Minutes
251
Tied-3rd
Minutes Per Game
19.3
—
Rating
9.2
Tied-105th
Plus-Minus
-61
Tied-1st
Rebounds Per Game
3.4
Tied-167th
Fouls Per Game
2.1
Tied-153rd
Flagrant Fouls Per Game
0.0
Tied-21st
Technical Fouls Per Game
0.0
Tied-84th
Ejections Per Game
0.0
Tied-6th
Disqualifications Per Game
0.0
Tied-21st
Assist To Turnover Ratio
1.1
—
Steal To Foul Ratio
0.4
—
Block To Foul Ratio
0.1
—
Team Rebounds Per Game
0.0
—
Rebounds
44
—
Total Technical Fouls
0
—
Assist To Turnover Ratio
0.0
—
Steal To Turnover Ratio
0.8
—
Rebounds Per 48 Minutes
8.4
—
Fouls Per 48 Minutes
5.2
2,288th
Flagrant Fouls Per 48 Minutes
0.0
384th
Technical Fouls Per 48 Minutes
0.0
1,664th
Ejections Per 48 Minutes
0.0
112th
Disqualifications Per 48 Minutes
0.0
352nd
R/40
7.0
—
Games Played
13
13th
Games Started
2
Tied-198th
Double Double
0
Tied-121st
Triple Double
0
Tied-13th
Offensive
Metric
Total
NBA rank
Assists
13
Tied-256th
Effective Field Goal Percentage
39.2
—
Field Goals
15/51
—
Field Goals Attempted
51
Tied-265th
Field Goals Made
15
Tied-303rd
Field Goal Percentage
29.4
—
Free Throws
18/20
—
Free Throw Percentage
90.0
Tied-35th
Free Throws Attempted
20
Tied-178th
Free Throws Made
18
Tied-152nd
Offensive Rebounds
15
Tied-103rd
Points
58
Tied-276th
Turnovers
12
Tied-189th
3-Point Field Goal Percentage
37.0
111th
3-Point Field Goals Attempted
27
Tied-224th
3-Point Field Goals Made
10
Tied-211th
True Shooting Percentage
48.5
—
Total Turnovers
12
—
Assist Ratio
15.3
—
Points in the Paint
0
Tied-1st
Offensive Rebound Rate
0.0
—
Turnover Ratio
14.2
—
Brick Index
0.00
—
Usage Rate
0.0
—
Average Field Goals Made
1.2
—
Average Field Goals Attempted
3.9
161st
Average 3-Point Field Goals Made
0.8
—
Average 3-Point Field Goals Attempted
2.1
Tied-216th
Average Free Throws Made
1.4
—
Average Free Throws Attempted
1.5
Tied-173rd
Points Per Game
4.5
260th
Offensive Rebounds Per Game
1.2
Tied-104th
Assists Per Game
1.0
Tied-232nd
Turnovers Per Game
0.9
190th
Offensive Rebound Percentage
0.4
—
Estimated Possessions
56.0
—
Estimated Possessions Per Game
4.3
—
Points Per Estimated Possession
1.0
—
Team Turnovers Per Game
0.0
—
Total Turnovers Per Game
0.9
—
3-Point Field Goal Percentage
37.0
—
2-Point Field Goals Made
5.0
Tied-92nd
2-Point Field Goals Attempted
24.0
Tied-41st
2-Point Field Goals Made per Game
0.4
—
2-Point Field Goals Attempted per Game
1.8
—
2-Point Field Goal Percentage
20.8
—
Shooting Efficiency
0.39
—
Scoring Efficiency
1.137
—
Fieldgoals Made Per 48
2.9
4,848th
Fieldgoals Attempted Per 48
9.8
4,240th
3-Point Fieldgoals Made Per 48
1.9
3,376th
3-Point Fieldgoals Attempted Per 48
5.2
3,584th
Freethrows Made Per 48
3.4
2,432nd
Freethrows Attempted Per 48
3.8
2,848th
Points Scored Per 48
11.1
4,416th
Offensive Rebounds Per 48
2.9
1,648th
Assists Per 48
2.5
4,096th
Turnovers
2.3
3,024th
P/40
9.2
—
A/40
2.1
—
04 / EFFICIENCY, SHOOTING PROFILE, PER-36
Advanced metrics
True shooting %49.3%
Effective FG %41.0%
2-point FG %22.2%
3-point attempt rate53.8%
Free throw rate38.5%
Points per shot attempt1.15
% of points from 3s53.3%
Assist-to-turnover1.11
Points per 36 min8.4
Rebounds per 36 min6.3
Assists per 36 min1.9
Steals per 36 min1.49
Blocks per 36 min0.37
Turnovers per 36 min1.68
Stocks (STL + BLK) per game1.00
Pts + Reb + Ast per game8.9
Efficiency (EFF) per game6.2
Game Score per game (Hollinger)3.6
Minutes per game19.3
Calculated by BallersCulture from the supplied 2026-27 box-score totals using standard formulas (hover a tile to see the formula). Tracking-based metrics such as BPM, VORP, on/off and RAPTOR are not available from this data source.
05 / 13 GAMES IN 2026-27
Game log: Regular season
Date
Opp
Result
MIN
FG
FG%
3PT
3P%
FT
FT%
REB
AST
BLK
STL
PF
TO
PTS
Nov 16
vs SA
L 110-102
27
2-6
33.3
2-3
66.7
1-1
100.0
6
0
0
3
3
1
7
Nov 14
@ HOU
L 125-118
22
2-7
28.6
2-6
33.3
1-2
50.0
2
1
1
1
1
0
7
Nov 12
vs ORL
L 123-108
15
1-2
50.0
1-2
50.0
4-4
100.0
3
0
0
0
3
1
7
Nov 11
vs MIA
L 115-109
21
1-8
12.5
0-3
0.0
4-5
80.0
4
4
0
1
3
1
6
Nov 9
@ MIN
L 115-100
17
0-3
0.0
0-1
0.0
0-0
0.0
1
0
0
1
0
1
0
Nov 7
@ DAL
L 112-100
24
4-10
40.0
2-3
66.7
2-2
100.0
4
0
0
2
3
1
12
Nov 5
@ NO
L 120-113 OT
26
1-3
33.3
1-2
50.0
0-0
0.0
6
1
1
0
5
2
3
Nov 3
@ SA
L 119-97
19
1-2
50.0
1-1
100.0
6-6
100.0
3
2
0
1
1
1
9
Nov 1
vs POR
L 112-90
14
0-1
0.0
0-1
0.0
0-0
0.0
1
0
0
0
2
1
0
Oct 29
vs SA
L 117-111 OT
28
2-2
100.0
1-1
100.0
0-0
0.0
9
3
0
0
0
0
5
Oct 27
vs MEM
L 110-105
21
0-4
0.0
0-3
0.0
0-0
0.0
2
0
1
0
0
1
0
Oct 26
vs LAL
L 132-123
10
1-2
50.0
0-0
0.0
0-0
0.0
2
2
0
1
5
2
2
Oct 22
@ MEM
L 123-103
8
0-1
0.0
0-1
0.0
0-0
0.0
1
0
0
0
1
0
0
06 / 2026-27 HOME / AWAY, RESULTS, MONTHS AND OPPONENTS
Splits
split
Split
GP
MIN
FG
FG%
3PT
3P%
FT
FT%
OR
DR
REB
AST
BLK
STL
PF
TO
PTS
All Splits
13
19.3
1.2-3.9
29.4
0.8-2.1
37.0
1.4-1.5
90.0
1.2
2.2
3.4
1.0
0.2
0.8
2.1
0.9
4.5
Home
7
19.4
1.0-3.6
28.0
0.6-1.9
30.8
1.3-1.4
90.0
1.3
2.6
3.9
1.3
0.1
0.7
2.3
1.0
3.9
Road
6
19.2
1.3-4.3
30.8
1.0-2.3
42.9
1.5-1.7
90.0
1.0
1.8
2.8
0.7
0.3
0.8
1.8
0.8
5.2
vs. Division
2
15.5
0.0-2.0
0.0
0.0-1.0
0.0
0.0-0.0
0.0
0.5
0.5
1.0
0.0
0.0
0.5
1.0
1.0
0.0
vs. Conference
11
19.5
1.2-3.7
31.7
0.8-2.0
40.9
0.9-1.0
90.9
1.2
2.2
3.4
0.8
0.3
0.8
1.9
0.9
4.1
3+ Days Rest
2
8.5
0.5-1.5
33.3
0.0-0.5
0.0
0.0-0.0
0.0
0.5
1.0
1.5
1.0
0.0
0.5
3.0
1.0
1.0
Month
Split
GP
MIN
FG
FG%
3PT
3P%
FT
FT%
OR
DR
REB
AST
BLK
STL
PF
TO
PTS
October
5
16.0
0.6-2.0
30.0
0.2-1.2
16.7
0.0-0.0
0.0
1.0
2.0
3.0
1.0
0.2
0.2
1.6
0.8
1.4
November
8
21.4
1.5-5.1
29.3
1.1-2.6
42.9
2.3-2.5
90.0
1.3
2.4
3.6
1.0
0.3
1.1
2.4
1.0
6.4
Pre All-Star
13
19.3
1.2-3.9
29.4
0.8-2.1
37.0
1.4-1.5
90.0
1.2
2.2
3.4
1.0
0.2
0.8
2.1
0.9
4.5
Result
Split
GP
MIN
FG
FG%
3PT
3P%
FT
FT%
OR
DR
REB
AST
BLK
STL
PF
TO
PTS
Losses
13
19.3
1.2-3.9
29.4
0.8-2.1
37.0
1.4-1.5
90.0
1.2
2.2
3.4
1.0
0.2
0.8
2.1
0.9
4.5
Position
Split
GP
MIN
FG
FG%
3PT
3P%
FT
FT%
OR
DR
REB
AST
BLK
STL
PF
TO
PTS
As Starter
2
21.5
1.5-7.5
20.0
1.0-4.5
22.2
2.5-3.5
71.4
1.5
1.5
3.0
2.5
0.5
1.0
2.0
0.5
6.5
Day
Split
GP
MIN
FG
FG%
3PT
3P%
FT
FT%
OR
DR
REB
AST
BLK
STL
PF
TO
PTS
Monday
2
19.5
0.5-3.0
16.7
0.5-2.0
25.0
3.0-3.0
100.0
1.5
1.0
2.5
1.0
0.5
0.5
0.5
1.0
4.5
Tuesday
1
21.0
1.0-8.0
12.5
0.0-3.0
0.0
4.0-5.0
80.0
2.0
2.0
4.0
4.0
0.0
1.0
3.0
1.0
6.0
Wednesday
4
19.3
1.0-2.0
50.0
0.8-1.5
50.0
1.0-1.0
100.0
1.0
3.8
4.8
1.0
0.3
0.0
2.3
0.8
3.8
Friday
2
23.0
3.0-8.5
35.3
2.0-4.5
44.4
1.5-2.0
75.0
1.0
2.0
3.0
0.5
0.5
1.5
2.0
0.5
9.5
Saturday
1
14.0
0.0-1.0
0.0
0.0-1.0
0.0
0.0-0.0
0.0
0.0
1.0
1.0
0.0
0.0
0.0
2.0
1.0
0.0
Sunday
3
18.0
1.0-3.7
27.3
0.7-1.3
50.0
0.3-0.3
100.0
1.3
1.7
3.0
0.7
0.0
1.7
2.7
1.3
3.0
Opponent
Split
GP
MIN
FG
FG%
3PT
3P%
FT
FT%
OR
DR
REB
AST
BLK
STL
PF
TO
PTS
Dallas Mavericks
1
24.0
4.0-10.0
40.0
2.0-3.0
66.7
2.0-2.0
100.0
1.0
3.0
4.0
0.0
0.0
2.0
3.0
1.0
12.0
Houston Rockets
1
22.0
2.0-7.0
28.6
2.0-6.0
33.3
1.0-2.0
50.0
1.0
1.0
2.0
1.0
1.0
1.0
1.0
0.0
7.0
Los Angeles Lakers
1
10.0
1.0-2.0
50.0
0.0-0.0
0.0
0.0-0.0
0.0
1.0
1.0
2.0
2.0
0.0
1.0
5.0
2.0
2.0
Memphis Grizzlies
2
14.0
0.0-2.5
0.0
0.0-2.0
0.0
0.0-0.0
0.0
0.5
1.0
1.5
0.0
0.5
0.0
0.5
0.5
0.0
Miami Heat
1
21.0
1.0-8.0
12.5
0.0-3.0
0.0
4.0-5.0
80.0
2.0
2.0
4.0
4.0
0.0
1.0
3.0
1.0
6.0
Minnesota Timberwolves
1
17.0
0.0-3.0
0.0
0.0-1.0
0.0
0.0-0.0
0.0
1.0
0.0
1.0
0.0
0.0
1.0
0.0
1.0
0.0
New Orleans Pelicans
1
26.0
1.0-3.0
33.3
1.0-2.0
50.0
0.0-0.0
0.0
1.0
5.0
6.0
1.0
1.0
0.0
5.0
2.0
3.0
Orlando Magic
1
15.0
1.0-2.0
50.0
1.0-2.0
50.0
4.0-4.0
100.0
0.0
3.0
3.0
0.0
0.0
0.0
3.0
1.0
7.0
Portland Trail Blazers
1
14.0
0.0-1.0
0.0
0.0-1.0
0.0
0.0-0.0
0.0
0.0
1.0
1.0
0.0
0.0
0.0
2.0
1.0
0.0
San Antonio Spurs
3
25.0
1.7-3.3
50.0
1.3-1.7
80.0
2.3-2.3
100.0
2.3
3.7
6.0
1.7
0.0
1.3
1.3
0.7
7.0
07 / SEASON-BY-SEASON HISTORY
Career statistics
Regular Season Averages
Season
Team
GP
GS
MIN
FG
FG%
3PT
3P%
FT
FT%
OR
DR
REB
AST
BLK
STL
PF
TO
PTS
2018-19
Minnesota Timberwolves
74
52
23.7
2.6-6.9
38.6
0.8-2.9
27.9
1.6-2.2
72.8
0.6
2.4
2.9
1.2
0.4
1.2
2.2
0.9
7.7
2019-20
Minnesota Timberwolves
62
28
25.0
2.7-6.4
42.7
0.7-2.5
26.6
2.5-3.1
79.6
1.4
2.9
4.3
1.6
0.4
1.1
2.2
1.4
8.6
2020-21
Minnesota Timberwolves
59
37
20.3
1.7-4.3
40.2
0.5-1.8
26.9
1.4-1.8
76.9
1.1
1.6
2.6
1.1
0.5
0.9
2.1
0.7
5.4
2021-22
Minnesota Timberwolves
49
6
10.5
0.9-2.1
40.4
0.3-1.0
29.8
0.7-1.0
68.6
0.6
0.8
1.4
0.5
0.2
0.5
1.1
0.5
2.7
2022-23
Phoenix Suns
72
26
18.8
2.3-5.8
39.1
0.9-2.7
33.5
1.9-2.7
72.4
1.5
2.0
3.5
1.5
0.5
0.8
1.6
0.9
7.3
2023-24
Phoenix Suns
60
11
16.0
1.4-3.4
41.7
0.5-1.6
30.9
1.3-1.7
74.5
1.2
1.3
2.6
1.1
0.4
0.8
1.1
0.6
4.6
2024-25
Phoenix Suns
25
1
14.0
2.2-4.6
49.1
0.6-1.7
38.1
0.9-1.3
68.8
1.3
1.6
2.9
0.6
0.4
0.8
1.1
0.6
6.0
2024-25
Charlotte Hornets
15
6
18.3
2.5-6.5
38.8
1.1-3.3
32.0
2.7-3.5
77.4
0.9
1.9
2.7
1.3
0.5
1.8
1.3
1.0
8.9
2024-25
2024 25 Totals
40
7
15.6
2.4-5.3
44.3
0.8-2.3
34.8
1.6-2.1
74.1
1.1
1.7
2.8
0.8
0.5
1.2
1.2
0.8
7.1
2025-26
Houston Rockets
78
32
17.4
1.6-3.8
42.5
0.8-2.1
38.5
0.5-0.9
59.4
1.0
1.5
2.6
0.9
0.2
0.8
1.4
0.5
4.5
2026-27
Utah Jazz
13
2
19.3
1.2-3.9
29.4
0.8-2.1
37.0
1.4-1.5
90.0
1.2
2.2
3.4
1.0
0.2
0.8
2.1
0.9
4.5
Career
—
507
201
18.9
2.0-4.8
40.6
0.7-2.2
31.3
1.4-1.9
74.0
1.1
1.8
2.9
1.1
0.4
0.9
1.7
0.8
6.0
Regular Season Totals
Season
Team
FG
FG%
3PT
3P%
FT
FT%
OR
DR
REB
AST
BLK
STL
PF
TO
PTS
2018-19
Minnesota Timberwolves
196-508
38.6
60-215
27.9
118-162
72.8
41
177
218
91
33
88
166
63
570
2019-20
Minnesota Timberwolves
170-398
42.7
41-154
26.6
152-191
79.6
87
181
268
99
26
68
139
87
533
2020-21
Minnesota Timberwolves
102-254
40.2
29-108
26.9
83-108
76.9
63
93
156
63
28
54
123
43
316
2021-22
Minnesota Timberwolves
42-104
40.4
14-47
29.8
35-51
68.6
29
41
70
25
12
26
53
23
133
2022-23
Phoenix Suns
162-414
39.1
66-197
33.5
139-192
72.4
109
142
251
105
34
56
114
63
529
2023-24
Phoenix Suns
86-206
41.7
29-94
30.9
76-102
74.5
74
80
154
64
24
48
68
36
277
2024-25
Phoenix Suns
56-114
49.1
16-42
38.1
22-32
68.8
32
40
72
14
11
21
28
16
150
2024-25
Charlotte Hornets
38-98
38.8
16-50
32.0
41-53
77.4
13
28
41
19
8
27
19
15
133
2024-25
2024 25 Totals
94-212
44.3
32-92
34.8
63-85
74.1
45
68
113
33
19
48
47
31
283
2025-26
Houston Rockets
125-294
42.5
62-161
38.5
41-69
59.4
81
119
200
69
16
63
107
41
353
2026-27
Utah Jazz
15-51
29.4
10-27
37.0
18-20
90.0
15
29
44
13
3
10
27
12
58
Career
—
992-2441
40.6
343-1095
31.3
725-980
74.0
544
930
1474
562
195
461
844
399
3052
Regular Season Misc Totals
Season
Team
DD2
TD3
DQ
EJECT
TECH
FLAG
AST/TO
STL/TO
SC-EFF
SH-EFF
2018-19
Minnesota Timberwolves
1
0
0
0
1
0
1.4
1.4
1.122
0.44
2019-20
Minnesota Timberwolves
0
0
1
0
2
1
1.1
0.8
1.339
0.48
2020-21
Minnesota Timberwolves
0
0
0
0
1
0
1.5
1.3
1.244
0.46
2021-22
Minnesota Timberwolves
0
0
0
0
0
0
1.1
1.1
1.279
0.47
2022-23
Phoenix Suns
2
0
0
0
1
0
1.7
0.9
1.278
0.47
2023-24
Phoenix Suns
0
0
0
0
1
0
1.8
1.3
1.345
0.49
2024-25
Phoenix Suns
0
0
0
0
0
0
0.9
1.3
1.316
0.56
2024-25
Charlotte Hornets
1
0
0
0
0
0
1.3
1.8
1.357
0.47
2024-25
2024 25 Totals
1
0
0
0
0
0
1.1
1.5
1.335
0.52
2025-26
Houston Rockets
1
0
0
0
2
0
1.7
1.5
1.201
0.53
2026-27
Utah Jazz
0
0
0
0
0
0
1.1
0.8
1.137
0.39
Career
—
5
0
1
0
8
1
1.4
1.2
1.250
0.48
Scoring, rebounding and assist trend
08 / SHOT CHART AND ZONE SHOOTING
Shot profile
Shot-location data is not connected. Add a BALLDONTLIE GOAT-tier NBA API key in NBA Players → Settings to enable shot charts and zone shooting.
LATEST UPDATEOkogie is not listed in the starting lineup for Sunday's game against the Spurs.
Okogie will return to the bench after starting in Friday's 125-118 loss to Houston. He tallied seven points (2-7 FG, 2-6 3Pt, 1-2 FT), two rebounds, one assist, one steal and one block across 22 minutes, but Josh Green will replace him in the first unit versus San Antonio.




 Ace BaileyG #19
 Blake HinsonF #25
 Brice SensabaughF #28
 Darryn PetersonG #22
 Harrison IngramF #00
 Isaiah CollierG #8
 Jaelen HouseG #24
 Jaren Jackson Jr.F #20
 Jaxson HayesC #11
 Jonas AidooC #13
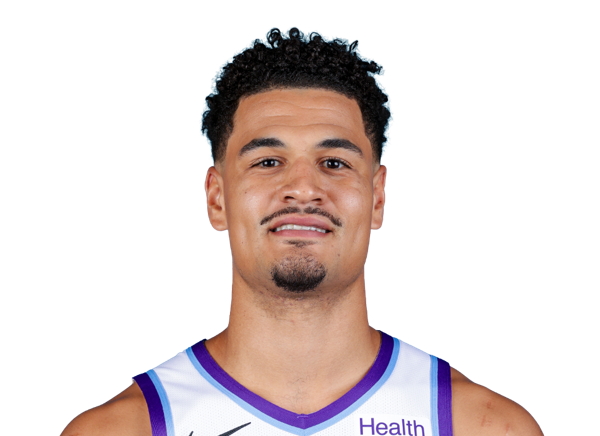 Josh GreenG #5
 Jusuf NurkicC #30
 Kevin LoveF #42
 Keyonte GeorgeG #3
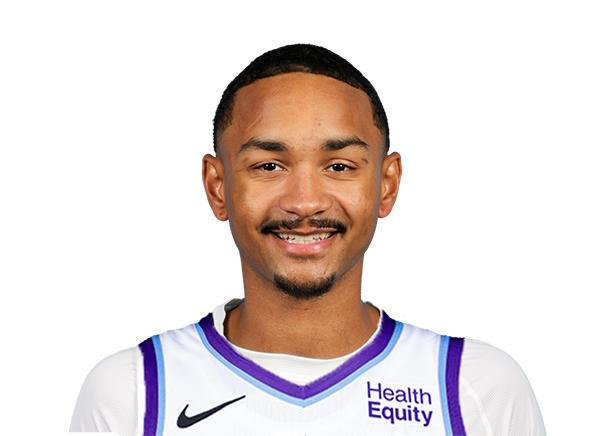 Kobe BufkinG
 Kyle FilipowskiF #2
 Lauri MarkkanenF #23
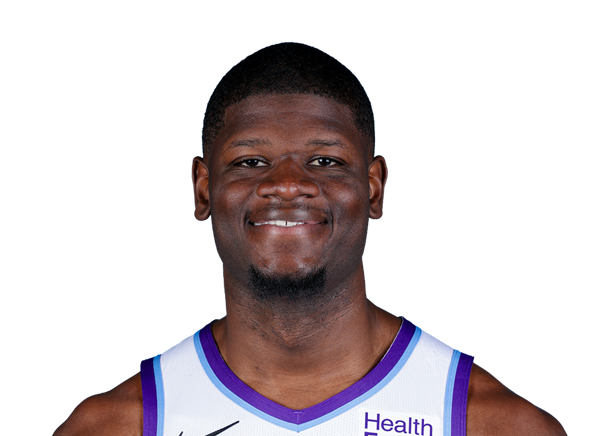 Mo BambaC #44
 Mohamed WagueF #17
 Svi MykhailiukG #10
 Tamar BatesG
 Taylor FunkF #33
 Terrell Brown Jr.G #16
 Tony BradleyC #13
 Trey AlexanderG #15