Click a season to open this player’s full game log, splits and advanced stats for that year; click a team to open its page. A dash means no NBA games were recorded.
03 / EVERY CATEGORY THE PROVIDER REPORTS
Full statistical breakdown
Regular season 2026-27
Defensive
Metric
Total
NBA rank
Blocks
4
Tied-160th
Defensive Rebounds
38
Tied-129th
Steals
6
Tied-226th
Defensive Rebound Rate
0.0
—
Defensive Rebounds Per Game
2.7
Tied-156th
Blocks Per Game
0.3
Tied-165th
Steals Per Game
0.4
231st
Defensive Rebounds Per 48
7.1
2,064th
Blocks Per 48
0.8
2,560th
Steals Per 48
1.1
3,616th
General
Metric
Total
NBA rank
Disqualifications
0
Tied-22nd
Flagrant Fouls
0
Tied-24th
Fouls
13
Tied-297th
Player Efficiency Rating
13.13
179th
Rebound Rate
0.0
—
Ejections
0
Tied-7th
Technical Fouls
1
Tied-31st
Rebounds
51
—
Value Over Replacement Player
0.0
—
Minutes
256
Tied-3rd
Minutes Per Game
18.3
—
Rating
12.1
Tied-54th
Plus-Minus
+82
Tied-1st
Rebounds Per Game
3.6
Tied-148th
Fouls Per Game
0.9
273rd
Flagrant Fouls Per Game
0.0
Tied-21st
Technical Fouls Per Game
0.1
Tied-67th
Ejections Per Game
0.0
Tied-6th
Disqualifications Per Game
0.0
Tied-21st
Assist To Turnover Ratio
2.2
—
Steal To Foul Ratio
0.5
—
Block To Foul Ratio
0.3
—
Team Rebounds Per Game
0.0
—
Rebounds
51
—
Total Technical Fouls
1
—
Assist To Turnover Ratio
0.0
—
Steal To Turnover Ratio
1.0
—
Rebounds Per 48 Minutes
9.6
—
Fouls Per 48 Minutes
2.4
4,752nd
Flagrant Fouls Per 48 Minutes
0.0
384th
Technical Fouls Per 48 Minutes
0.2
496th
Ejections Per 48 Minutes
0.0
112th
Disqualifications Per 48 Minutes
0.0
352nd
R/40
8.0
—
Games Played
14
14th
Games Started
0
Tied-258th
Double Double
0
Tied-121st
Triple Double
0
Tied-13th
Offensive
Metric
Total
NBA rank
Assists
13
Tied-256th
Effective Field Goal Percentage
58.2
—
Field Goals
29/61
—
Field Goals Attempted
61
Tied-235th
Field Goals Made
29
Tied-224th
Field Goal Percentage
47.5
—
Free Throws
15/24
—
Free Throw Percentage
62.5
Tied-247th
Free Throws Attempted
24
Tied-152nd
Free Throws Made
15
Tied-178th
Offensive Rebounds
13
Tied-132nd
Points
86
219th
Turnovers
6
Tied-279th
3-Point Field Goal Percentage
32.5
Tied-168th
3-Point Field Goals Attempted
40
Tied-171st
3-Point Field Goals Made
13
Tied-168th
True Shooting Percentage
60.1
—
Total Turnovers
6
—
Assist Ratio
14.4
—
Points in the Paint
0
Tied-1st
Offensive Rebound Rate
0.0
—
Turnover Ratio
6.6
—
Brick Index
0.00
—
Usage Rate
0.0
—
Average Field Goals Made
2.1
—
Average Field Goals Attempted
4.4
180th
Average 3-Point Field Goals Made
0.9
—
Average 3-Point Field Goals Attempted
2.9
Tied-187th
Average Free Throws Made
1.1
—
Average Free Throws Attempted
1.7
Tied-158th
Points Per Game
6.1
219th
Offensive Rebounds Per Game
0.9
Tied-137th
Assists Per Game
0.9
242nd
Turnovers Per Game
0.4
259th
Offensive Rebound Percentage
0.4
—
Estimated Possessions
63.6
—
Estimated Possessions Per Game
4.5
—
Points Per Estimated Possession
1.4
—
Team Turnovers Per Game
0.0
—
Total Turnovers Per Game
0.4
—
3-Point Field Goal Percentage
32.5
—
2-Point Field Goals Made
16.0
Tied-56th
2-Point Field Goals Attempted
21.0
Tied-64th
2-Point Field Goals Made per Game
1.1
—
2-Point Field Goals Attempted per Game
1.5
—
2-Point Field Goal Percentage
76.2
—
Shooting Efficiency
0.58
—
Scoring Efficiency
1.410
—
Fieldgoals Made Per 48
5.4
3,584th
Fieldgoals Attempted Per 48
11.4
3,760th
3-Point Fieldgoals Made Per 48
2.4
2,688th
3-Point Fieldgoals Attempted Per 48
7.5
2,736th
Freethrows Made Per 48
2.8
2,848th
Freethrows Attempted Per 48
4.5
2,432nd
Points Scored Per 48
16.1
Tied-3,504th
Offensive Rebounds Per 48
2.4
2,112th
Assists Per 48
2.4
4,096th
Turnovers
1.1
4,464th
P/40
13.4
—
A/40
2.0
—
04 / EFFICIENCY, SHOOTING PROFILE, PER-36
Advanced metrics
True shooting %59.2%
Effective FG %58.0%
2-point FG %80.0%
3-point attempt rate65.9%
Free throw rate38.6%
Points per shot attempt1.39
% of points from 3s44.3%
Assist-to-turnover2.25
Points per 36 min12.0
Rebounds per 36 min7.1
Assists per 36 min1.8
Steals per 36 min0.79
Blocks per 36 min0.59
Turnovers per 36 min0.79
Stocks (STL + BLK) per game0.70
Pts + Reb + Ast per game10.6
Efficiency (EFF) per game8.0
Game Score per game (Hollinger)5.5
Minutes per game18.3
Calculated by BallersCulture from the supplied 2026-27 box-score totals using standard formulas (hover a tile to see the formula). Tracking-based metrics such as BPM, VORP, on/off and RAPTOR are not available from this data source.
05 / 14 GAMES IN 2026-27
Game log: Regular season
Date
Opp
Result
MIN
FG
FG%
3PT
3P%
FT
FT%
REB
AST
BLK
STL
PF
TO
PTS
Nov 17
vs POR
W 106-98
19
3-5
60.0
2-3
66.7
1-2
50.0
3
1
0
0
0
0
9
Nov 15
vs CHI
L 117-106
19
1-4
25.0
0-3
0.0
3-4
75.0
1
2
1
0
1
0
5
Nov 13
vs DAL
W 133-94
15
1-1
100.0
0-0
0.0
0-0
0.0
0
0
0
0
2
0
2
Nov 9
vs UTAH
W 115-100
21
3-6
50.0
1-3
33.3
2-3
66.7
6
2
0
1
1
0
9
Nov 7
@ NO
W 115-109
29
2-7
28.6
0-4
0.0
1-2
50.0
13
2
1
3
2
1
5
Nov 5
@ HOU
W 117-107
20
2-3
66.7
1-2
50.0
0-0
0.0
2
0
1
0
1
0
5
Nov 3
vs MIL
W 112-100
21
4-9
44.4
2-7
28.6
2-2
100.0
4
0
0
0
0
0
12
Nov 1
@ SA
L 121-111
17
1-3
33.3
1-3
33.3
3-4
75.0
0
0
0
0
0
3
6
Oct 31
vs LAC
W 127-101
17
4-7
57.1
1-3
33.3
1-2
50.0
5
0
0
0
1
0
10
Oct 29
vs GS
L 119-114
22
3-5
60.0
1-3
33.3
0-0
0.0
3
1
1
1
1
0
7
Oct 27
@ CLE
L 127-125 OT
13
1-1
100.0
1-1
100.0
0-0
0.0
1
1
0
0
0
0
3
Oct 26
vs TOR
W 117-94
14
1-3
33.3
1-3
33.3
0-0
0.0
6
2
0
1
1
2
3
Oct 24
@ ORL
W 115-93
17
3-6
50.0
2-5
40.0
1-3
33.3
6
2
0
0
0
0
9
Oct 22
@ MIA
W 131-106
12
0-1
0.0
0-0
0.0
1-2
50.0
1
0
0
0
3
0
1
06 / 2026-27 HOME / AWAY, RESULTS, MONTHS AND OPPONENTS
Splits
split
Split
GP
MIN
FG
FG%
3PT
3P%
FT
FT%
OR
DR
REB
AST
BLK
STL
PF
TO
PTS
All Splits
14
18.3
2.1-4.4
47.5
0.9-2.9
32.5
1.1-1.7
62.5
0.9
2.7
3.6
0.9
0.3
0.4
0.9
0.4
6.1
Home
8
18.6
2.5-5.0
50.0
1.0-3.1
32.0
1.1-1.6
69.2
0.8
2.8
3.5
1.0
0.3
0.4
0.9
0.3
7.1
Road
6
18.0
1.5-3.5
42.9
0.8-2.5
33.3
1.0-1.8
54.5
1.2
2.7
3.8
0.8
0.3
0.5
1.0
0.7
4.8
vs. Division
2
20.0
3.0-5.5
54.5
1.5-3.0
50.0
1.5-2.5
60.0
0.5
4.0
4.5
1.5
0.0
0.5
0.5
0.0
9.0
vs. Conference
8
20.0
2.4-4.6
51.4
0.9-2.6
33.3
1.0-1.6
61.5
0.9
3.1
4.0
0.8
0.4
0.6
1.0
0.5
6.6
3+ Days Rest
2
14.0
0.5-1.0
50.0
0.0-0.0
0.0
0.5-1.0
50.0
0.0
0.5
0.5
0.0
0.0
0.0
2.5
0.0
1.5
Month
Split
GP
MIN
FG
FG%
3PT
3P%
FT
FT%
OR
DR
REB
AST
BLK
STL
PF
TO
PTS
October
7
16.0
1.9-3.7
50.0
1.0-2.6
38.9
0.9-1.6
54.5
0.7
2.4
3.1
0.9
0.1
0.3
0.9
0.7
5.6
November
7
20.6
2.3-5.0
45.7
0.9-3.1
27.3
1.3-1.9
69.2
1.1
3.0
4.1
1.0
0.4
0.6
1.0
0.1
6.7
Pre All-Star
14
18.3
2.1-4.4
47.5
0.9-2.9
32.5
1.1-1.7
62.5
0.9
2.7
3.6
0.9
0.3
0.4
0.9
0.4
6.1
Result
Split
GP
MIN
FG
FG%
3PT
3P%
FT
FT%
OR
DR
REB
AST
BLK
STL
PF
TO
PTS
Wins
10
18.6
2.3-4.8
47.9
1.0-3.0
33.3
0.9-1.6
56.3
1.2
3.4
4.6
0.9
0.2
0.5
1.1
0.3
6.5
Losses
4
17.5
1.5-3.3
46.2
0.8-2.5
30.0
1.5-2.0
75.0
0.3
1.0
1.3
1.0
0.5
0.3
0.5
0.8
5.3
Day
Split
GP
MIN
FG
FG%
3PT
3P%
FT
FT%
OR
DR
REB
AST
BLK
STL
PF
TO
PTS
Monday
3
18.0
2.7-5.0
53.3
1.7-3.7
45.5
1.0-1.3
75.0
0.3
2.3
2.7
0.7
0.0
0.0
0.0
0.0
8.0
Wednesday
3
18.0
1.7-3.0
55.6
0.7-1.7
40.0
0.3-0.7
50.0
0.3
1.7
2.0
0.3
0.7
0.3
1.7
0.0
4.3
Thursday
1
15.0
1.0-1.0
100.0
0.0-0.0
0.0
0.0-0.0
0.0
0.0
0.0
0.0
0.0
0.0
0.0
2.0
0.0
2.0
Friday
3
21.0
3.0-6.7
45.0
1.0-4.0
25.0
1.0-2.3
42.9
2.3
5.7
8.0
1.3
0.3
1.0
1.0
0.3
8.0
Saturday
2
18.0
1.0-3.5
28.6
0.5-3.0
16.7
3.0-4.0
75.0
0.5
0.0
0.5
1.0
0.5
0.0
0.5
1.5
5.5
Sunday
2
17.5
2.0-4.5
44.4
1.0-3.0
33.3
1.0-1.5
66.7
1.5
4.5
6.0
2.0
0.0
1.0
1.0
1.0
6.0
Opponent
Split
GP
MIN
FG
FG%
3PT
3P%
FT
FT%
OR
DR
REB
AST
BLK
STL
PF
TO
PTS
Chicago Bulls
1
19.0
1.0-4.0
25.0
0.0-3.0
0.0
3.0-4.0
75.0
1.0
0.0
1.0
2.0
1.0
0.0
1.0
0.0
5.0
Cleveland Cavaliers
1
13.0
1.0-1.0
100.0
1.0-1.0
100.0
0.0-0.0
0.0
0.0
1.0
1.0
1.0
0.0
0.0
0.0
0.0
3.0
Dallas Mavericks
1
15.0
1.0-1.0
100.0
0.0-0.0
0.0
0.0-0.0
0.0
0.0
0.0
0.0
0.0
0.0
0.0
2.0
0.0
2.0
Golden State Warriors
1
22.0
3.0-5.0
60.0
1.0-3.0
33.3
0.0-0.0
0.0
0.0
3.0
3.0
1.0
1.0
1.0
1.0
0.0
7.0
Houston Rockets
1
20.0
2.0-3.0
66.7
1.0-2.0
50.0
0.0-0.0
0.0
1.0
1.0
2.0
0.0
1.0
0.0
1.0
0.0
5.0
Los Angeles Clippers
1
17.0
4.0-7.0
57.1
1.0-3.0
33.3
1.0-2.0
50.0
1.0
4.0
5.0
0.0
0.0
0.0
1.0
0.0
10.0
Miami Heat
1
12.0
0.0-1.0
0.0
0.0-0.0
0.0
1.0-2.0
50.0
0.0
1.0
1.0
0.0
0.0
0.0
3.0
0.0
1.0
Milwaukee Bucks
1
21.0
4.0-9.0
44.4
2.0-7.0
28.6
2.0-2.0
100.0
1.0
3.0
4.0
0.0
0.0
0.0
0.0
0.0
12.0
New Orleans Pelicans
1
29.0
2.0-7.0
28.6
0.0-4.0
0.0
1.0-2.0
50.0
4.0
9.0
13.0
2.0
1.0
3.0
2.0
1.0
5.0
Orlando Magic
1
17.0
3.0-6.0
50.0
2.0-5.0
40.0
1.0-3.0
33.3
2.0
4.0
6.0
2.0
0.0
0.0
0.0
0.0
9.0
Portland Trail Blazers
1
19.0
3.0-5.0
60.0
2.0-3.0
66.7
1.0-2.0
50.0
0.0
3.0
3.0
1.0
0.0
0.0
0.0
0.0
9.0
San Antonio Spurs
1
17.0
1.0-3.0
33.3
1.0-3.0
33.3
3.0-4.0
75.0
0.0
0.0
0.0
0.0
0.0
0.0
0.0
3.0
6.0
Toronto Raptors
1
14.0
1.0-3.0
33.3
1.0-3.0
33.3
0.0-0.0
0.0
2.0
4.0
6.0
2.0
0.0
1.0
1.0
2.0
3.0
Utah Jazz
1
21.0
3.0-6.0
50.0
1.0-3.0
33.3
2.0-3.0
66.7
1.0
5.0
6.0
2.0
0.0
1.0
1.0
0.0
9.0
07 / SEASON-BY-SEASON HISTORY
Career statistics
Regular Season Averages
Season
Team
GP
GS
MIN
FG
FG%
3PT
3P%
FT
FT%
OR
DR
REB
AST
BLK
STL
PF
TO
PTS
2015-16
Utah Jazz
80
33
17.3
2.4-5.5
43.8
0.6-1.6
38.3
0.7-1.0
69.5
0.7
3.0
3.7
0.7
0.2
0.3
1.4
0.8
6.1
2016-17
Utah Jazz
71
4
16.3
2.2-6.2
36.2
0.9-2.9
31.9
0.8-1.1
72.2
0.7
2.6
3.3
1.0
0.3
0.4
1.4
0.9
6.2
2017-18
Denver Nuggets
73
2
19.1
3.7-7.5
49.1
1.1-3.0
38.1
1.4-2.0
70.6
0.8
4.0
4.8
1.2
0.5
0.4
1.5
0.8
9.9
2018-19
Denver Nuggets
64
2
17.5
3.2-7.7
41.8
0.8-3.1
25.5
1.3-1.8
69.8
0.7
3.2
3.8
1.4
0.4
0.5
1.5
1.1
8.5
2019-20
San Antonio Spurs
63
53
20.2
2.4-5.4
44.6
1.0-2.7
38.7
0.5-0.7
73.3
1.1
4.6
5.7
1.1
0.4
0.4
1.6
0.6
6.4
2020-21
San Antonio Spurs
23
9
15.6
1.9-3.9
47.8
0.6-1.7
35.0
0.7-1.0
65.2
0.4
3.3
3.7
0.6
0.0
0.3
0.6
0.3
5.0
2021-22
Detroit Pistons
51
3
19.4
3.4-7.5
45.6
0.9-2.9
30.1
2.7-3.5
78.4
1.2
3.6
4.8
1.1
0.5
0.4
1.8
1.1
10.4
2021-22
Sacramento Kings
24
20
22.8
3.6-7.4
48.9
1.0-2.6
36.5
2.4-2.8
85.1
1.2
4.4
5.6
1.3
0.3
0.3
1.3
0.8
10.6
2021-22
2021 22 Totals
75
23
20.5
3.5-7.5
46.6
0.9-2.8
32.1
2.6-3.2
80.2
1.2
3.9
5.1
1.2
0.4
0.4
1.6
1.0
10.5
2022-23
Sacramento Kings
74
0
16.9
2.5-5.5
45.8
1.2-3.2
36.3
1.4-1.7
81.5
0.9
3.1
4.1
0.9
0.4
0.4
1.3
0.9
7.6
2023-24
Sacramento Kings
58
0
20.0
2.5-5.5
44.5
1.4-3.8
38.4
0.8-1.2
70.0
1.1
3.4
4.4
1.2
0.3
0.3
1.5
0.7
7.2
2024-25
Sacramento Kings
69
5
19.6
2.3-5.4
42.0
1.2-3.4
34.0
0.8-1.2
70.0
1.2
3.4
4.6
1.2
0.3
0.6
1.2
0.6
6.5
2026-27
Minnesota Timberwolves
14
0
18.3
2.1-4.4
47.5
0.9-2.9
32.5
1.1-1.7
62.5
0.9
2.7
3.6
0.9
0.3
0.4
0.9
0.4
6.1
Career
—
664
131
18.4
2.7-6.1
44.2
1.0-2.9
34.6
1.1-1.5
73.9
0.9
3.4
4.3
1.1
0.4
0.4
1.4
0.8
7.6
Regular Season Totals
Season
Team
FG
FG%
3PT
3P%
FT
FT%
OR
DR
REB
AST
BLK
STL
PF
TO
PTS
2015-16
Utah Jazz
191-436
43.8
49-128
38.3
57-82
69.5
59
240
299
59
18
26
114
65
488
2016-17
Utah Jazz
159-439
36.2
65-204
31.9
57-79
72.2
48
187
235
69
20
26
97
64
440
2017-18
Denver Nuggets
270-550
49.1
83-218
38.1
101-143
70.6
55
292
347
91
34
30
111
61
724
2018-19
Denver Nuggets
207-495
41.8
51-200
25.5
81-116
69.8
44
202
246
87
23
30
93
68
546
2019-20
San Antonio Spurs
153-343
44.6
65-168
38.7
33-45
73.3
71
290
361
69
28
28
98
39
404
2020-21
San Antonio Spurs
43-90
47.8
14-40
35.0
15-23
65.2
9
77
86
14
1
6
13
6
115
2021-22
Detroit Pistons
175-384
45.6
44-146
30.1
138-176
78.4
60
184
244
58
26
22
91
54
532
2021-22
Sacramento Kings
87-178
48.9
23-63
36.5
57-67
85.1
29
106
135
30
6
7
32
19
254
2021-22
2021 22 Totals
262-562
46.6
67-209
32.1
195-243
80.2
89
290
379
88
32
29
123
73
786
2022-23
Sacramento Kings
187-408
45.8
87-240
36.3
101-124
81.5
68
232
300
66
31
27
97
64
562
2023-24
Sacramento Kings
143-321
44.5
84-219
38.4
49-70
70.0
61
196
257
72
19
17
86
38
419
2024-25
Sacramento Kings
157-374
42.0
81-238
34.0
56-80
70.0
80
236
316
82
23
41
86
39
451
2026-27
Minnesota Timberwolves
29-61
47.5
13-40
32.5
15-24
62.5
13
38
51
13
4
6
13
6
86
Career
—
1801-4079
44.2
659-1904
34.6
760-1029
73.9
597
2280
2877
710
233
266
931
523
5021
Regular Season Misc Totals
Season
Team
DD2
TD3
DQ
EJECT
TECH
FLAG
AST/TO
STL/TO
SC-EFF
SH-EFF
2015-16
Utah Jazz
2
0
0
1
0
1
0.9
0.4
1.119
0.49
2016-17
Utah Jazz
1
0
1
0
1
0
1.1
0.4
1.002
0.44
2017-18
Denver Nuggets
6
0
1
0
1
1
1.5
0.5
1.316
0.57
2018-19
Denver Nuggets
0
0
0
0
0
0
1.3
0.4
1.103
0.47
2019-20
San Antonio Spurs
2
0
0
0
3
0
1.8
0.7
1.178
0.54
2020-21
San Antonio Spurs
1
0
0
0
0
0
2.3
1.0
1.278
0.56
2021-22
Detroit Pistons
1
0
0
0
1
0
1.1
0.4
1.385
0.51
2021-22
Sacramento Kings
2
0
0
0
1
0
1.6
0.4
1.427
0.55
2021-22
2021 22 Totals
3
0
0
0
2
0
1.2
0.4
1.399
0.53
2022-23
Sacramento Kings
1
0
0
1
3
0
1.0
0.4
1.377
0.56
2023-24
Sacramento Kings
1
0
0
0
2
0
1.9
0.4
1.305
0.58
2024-25
Sacramento Kings
1
0
0
0
3
0
2.1
1.1
1.206
0.53
2026-27
Minnesota Timberwolves
0
0
0
0
1
0
2.2
1.0
1.410
0.58
Career
—
18
0
2
2
16
2
1.4
0.5
1.231
0.52
Scoring, rebounding and assist trend
08 / SHOT CHART AND ZONE SHOOTING
Shot profile
Shot-location data is not connected. Add a BALLDONTLIE GOAT-tier NBA API key in NBA Players → Settings to enable shot charts and zone shooting.
LATEST UPDATELyles recorded nine points (3-5 FG, 2-3 3Pt, 1-2 FT), three rebounds and one assist over 19 minutes during Monday's 106-98 victory over the Trail Blazers.
Lyles offered a spark off the bench in the front end of this back-to-back set against Portland, and he continues to play a meaningful role for the Timberwolves. The veteran forward has logged at least 19 minutes in six of his seven outings this month, during which he's averaged 6.7 points, 4.1 rebounds and 1.0 assists across 20.6 minutes per showing.


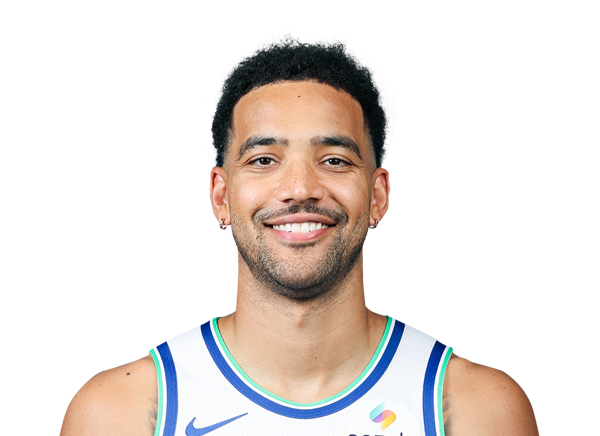

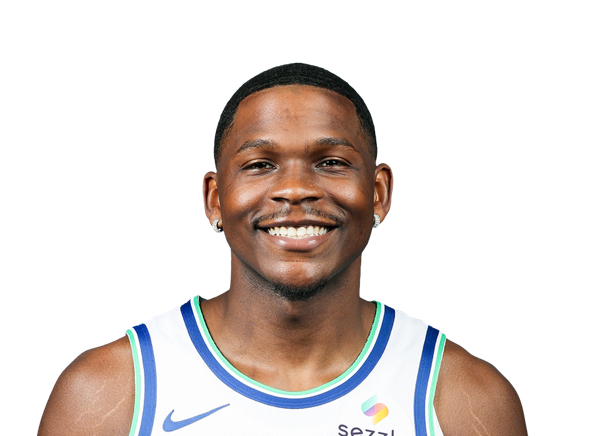 Anthony EdwardsG #5
 Antonio ReevesG #12
 Ayo DosunmuG #13
 Bones HylandG #8
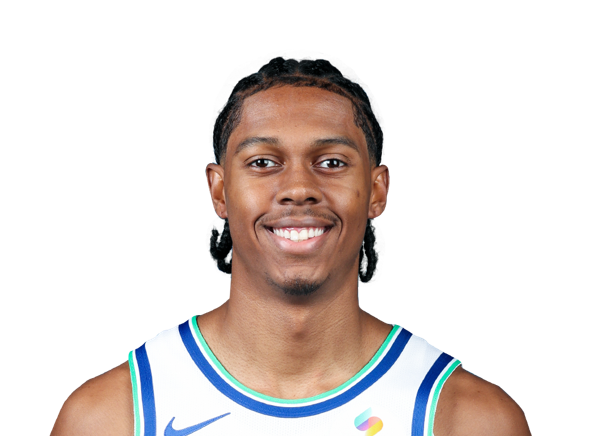 Cody WilliamsF #9
 Donte DiVincenzoG
 Enrique FreemanF #25
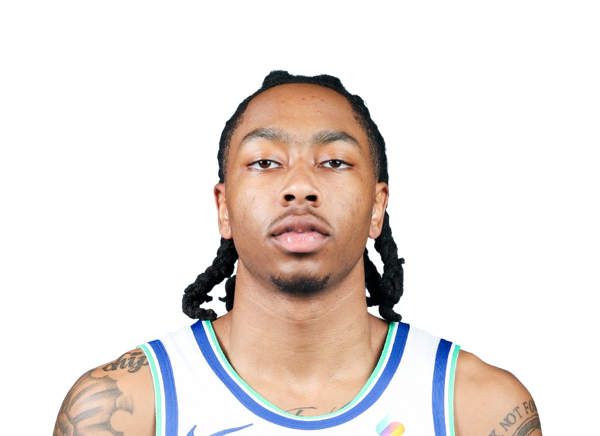 Isaiah EvansF #33
 Jaden McDanielsF #3
 Jaylen ClarkG #7
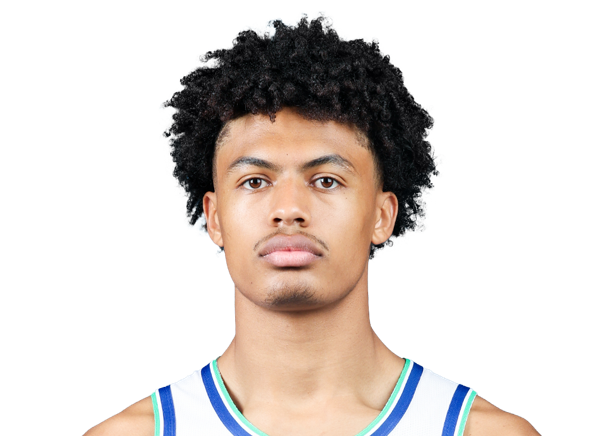 Joan BeringerF #19
 Joe InglesF #7
 Johni BroomeF #22
 Jonathan KumingaF #24
 KJ MartinF #99
 LaMelo BallG #1
 Rocco ZikarskyC #44
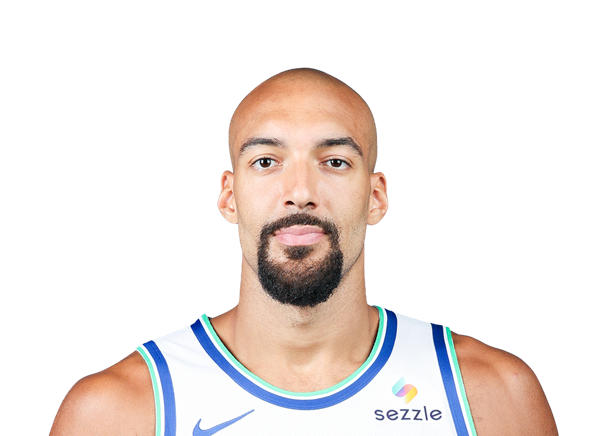 Rudy GobertC #27
 Terrence Shannon Jr.G #4
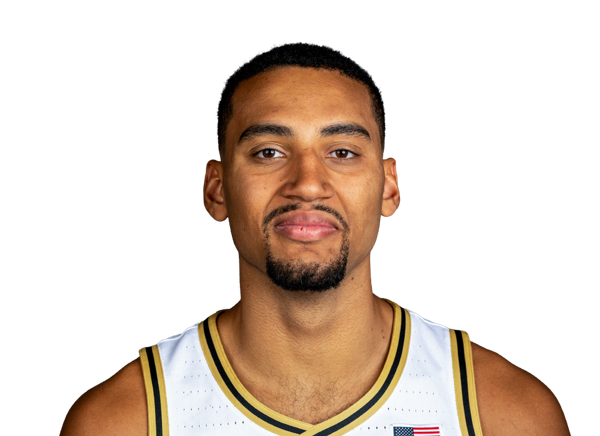 Trey Kaufman-RennF
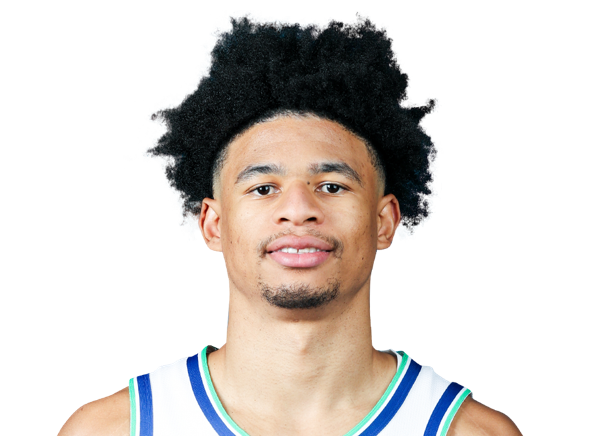 Zyon PullinG #15