Click a season to open this player’s full game log, splits and advanced stats for that year; click a team to open its page. A dash means no NBA games were recorded.
03 / EVERY CATEGORY THE PROVIDER REPORTS
Full statistical breakdown
Regular season 2026-27
Defensive
Metric
Total
NBA rank
Blocks
13
Tied-26th
Defensive Rebounds
60
51st
Steals
14
Tied-62nd
Defensive Rebound Rate
0.0
—
Defensive Rebounds Per Game
4.3
65th
Blocks Per Game
0.9
Tied-36th
Steals Per Game
1.0
81st
Defensive Rebounds Per 48
6.2
—
Blocks Per 48
1.3
—
Steals Per 48
1.4
—
General
Metric
Total
NBA rank
Disqualifications
1
Tied-4th
Flagrant Fouls
0
Tied-24th
Fouls
48
Tied-4th
Player Efficiency Rating
17.17
90th
Rebound Rate
0.0
—
Ejections
0
Tied-7th
Technical Fouls
1
Tied-31st
Rebounds
87
—
Value Over Replacement Player
0.0
—
Minutes
465
—
Minutes Per Game
33.2
—
Rating
31.6
Tied-12th
Plus-Minus
+156
Tied-1st
Rebounds Per Game
6.2
58th
Fouls Per Game
3.4
Tied-10th
Flagrant Fouls Per Game
0.0
Tied-21st
Technical Fouls Per Game
0.1
Tied-67th
Ejections Per Game
0.0
Tied-6th
Disqualifications Per Game
0.1
Tied-15th
Assist To Turnover Ratio
1.7
—
Steal To Foul Ratio
0.3
—
Block To Foul Ratio
0.3
—
Team Rebounds Per Game
0.0
—
Rebounds
87
—
Total Technical Fouls
1
—
Assist To Turnover Ratio
0.0
—
Steal To Turnover Ratio
0.5
—
Rebounds Per 48 Minutes
9.0
—
Fouls Per 48 Minutes
5.0
—
Flagrant Fouls Per 48 Minutes
0.0
—
Technical Fouls Per 48 Minutes
0.1
—
Ejections Per 48 Minutes
0.0
—
Disqualifications Per 48 Minutes
0.1
—
R/40
7.5
—
Games Played
14
14th
Games Started
14
Tied-7th
Double Double
0
Tied-121st
Triple Double
0
Tied-13th
Offensive
Metric
Total
NBA rank
Assists
52
Tied-56th
Effective Field Goal Percentage
57.1
—
Field Goals
96/184
—
Field Goals Attempted
184
Tied-48th
Field Goals Made
96
32nd
Field Goal Percentage
52.2
21st
Free Throws
24/28
—
Free Throw Percentage
85.7
Tied-70th
Free Throws Attempted
28
Tied-127th
Free Throws Made
24
Tied-111th
Offensive Rebounds
27
Tied-38th
Points
234
Tied-48th
Turnovers
30
Tied-41st
3-Point Field Goal Percentage
30.5
191st
3-Point Field Goals Attempted
59
Tied-94th
3-Point Field Goals Made
18
Tied-121st
True Shooting Percentage
59.6
—
Total Turnovers
30
—
Assist Ratio
18.7
—
Points in the Paint
0
Tied-1st
Offensive Rebound Rate
0.0
—
Turnover Ratio
10.8
—
Brick Index
0.00
—
Usage Rate
0.0
—
Average Field Goals Made
6.9
41st
Average Field Goals Attempted
13.1
410th
Average 3-Point Field Goals Made
1.3
Tied-145th
Average 3-Point Field Goals Attempted
4.2
109th
Average Free Throws Made
1.7
Tied-121st
Average Free Throws Attempted
2.0
Tied-137th
Points Per Game
16.7
Tied-58th
Offensive Rebounds Per Game
1.9
Tied-47th
Assists Per Game
3.7
Tied-69th
Turnovers Per Game
2.1
55th
Offensive Rebound Percentage
0.3
—
Estimated Possessions
198.2
—
Estimated Possessions Per Game
14.2
—
Points Per Estimated Possession
1.2
—
Team Turnovers Per Game
0.0
—
Total Turnovers Per Game
2.1
—
3-Point Field Goal Percentage
30.5
157th
2-Point Field Goals Made
78.0
153rd
2-Point Field Goals Attempted
125.0
46th
2-Point Field Goals Made per Game
5.6
—
2-Point Field Goals Attempted per Game
8.9
—
2-Point Field Goal Percentage
62.4
21st
Shooting Efficiency
0.57
—
Scoring Efficiency
1.272
—
Fieldgoals Made Per 48
9.9
—
Fieldgoals Attempted Per 48
19.0
—
3-Point Fieldgoals Made Per 48
1.9
—
3-Point Fieldgoals Attempted Per 48
6.1
—
Freethrows Made Per 48
2.5
—
Freethrows Attempted Per 48
2.9
—
Points Scored Per 48
24.2
—
Offensive Rebounds Per 48
2.8
—
Assists Per 48
5.4
—
Turnovers
3.1
—
P/40
20.1
—
A/40
4.5
—
04 / EFFICIENCY, SHOOTING PROFILE, PER-36
Advanced metrics
True shooting %59.7%
Effective FG %57.6%
2-point FG %62.9%
3-point attempt rate32.1%
Free throw rate15.3%
Points per shot attempt1.27
% of points from 3s23.4%
Assist-to-turnover1.76
Points per 36 min18.1
Rebounds per 36 min6.7
Assists per 36 min4.0
Steals per 36 min1.08
Blocks per 36 min0.98
Turnovers per 36 min2.28
Stocks (STL + BLK) per game1.90
Pts + Reb + Ast per game26.6
Efficiency (EFF) per game19.9
Game Score per game (Hollinger)13.6
Minutes per game33.2
Calculated by BallersCulture from the supplied 2026-27 box-score totals using standard formulas (hover a tile to see the formula). Tracking-based metrics such as BPM, VORP, on/off and RAPTOR are not available from this data source.
05 / 14 GAMES IN 2026-27
Game log: Regular season
Date
Opp
Result
MIN
FG
FG%
3PT
3P%
FT
FT%
REB
AST
BLK
STL
PF
TO
PTS
Nov 17
vs POR
W 106-98
31
5-11
45.5
0-2
0.0
3-3
100.0
6
3
2
2
3
2
13
Nov 15
vs CHI
L 117-106
37
7-11
63.6
2-5
40.0
2-2
100.0
5
6
1
2
2
3
18
Nov 13
vs DAL
W 133-94
25
7-12
58.3
0-3
0.0
2-2
100.0
9
3
1
0
2
3
16
Nov 9
vs UTAH
W 115-100
33
5-9
55.6
2-3
66.7
4-4
100.0
6
3
1
1
5
4
16
Nov 7
@ NO
W 115-109
40
8-19
42.1
2-7
28.6
5-5
100.0
6
5
2
1
4
2
23
Nov 5
@ HOU
W 117-107
37
7-14
50.0
0-6
0.0
0-0
0.0
8
4
0
2
4
2
14
Nov 3
vs MIL
W 112-100
29
5-14
35.7
2-4
50.0
1-3
33.3
6
3
0
0
4
2
13
Nov 1
@ SA
L 121-111
39
7-17
41.2
2-5
40.0
3-4
75.0
3
3
0
2
3
2
19
Oct 31
vs LAC
W 127-101
33
11-15
73.3
1-2
50.0
0-0
0.0
6
7
1
1
1
2
23
Oct 29
vs GS
L 119-114
35
8-18
44.4
1-8
12.5
2-3
66.7
6
4
0
0
5
2
19
Oct 27
@ CLE
L 127-125 OT
37
6-9
66.7
2-3
66.7
0-0
0.0
6
4
0
0
6
0
14
Oct 26
vs TOR
W 117-94
31
6-10
60.0
1-3
33.3
1-1
100.0
6
3
3
0
3
4
14
Oct 24
@ ORL
W 115-93
30
6-14
42.9
2-5
40.0
1-1
100.0
6
3
2
0
2
0
15
Oct 22
@ MIA
W 131-106
29
8-11
72.7
1-3
33.3
0-0
0.0
8
1
0
3
4
2
17
06 / 2026-27 HOME / AWAY, RESULTS, MONTHS AND OPPONENTS
Splits
split
Split
GP
MIN
FG
FG%
3PT
3P%
FT
FT%
OR
DR
REB
AST
BLK
STL
PF
TO
PTS
All Splits
14
33.2
6.9-13.1
52.2
1.3-4.2
30.5
1.7-2.0
85.7
1.9
4.3
6.2
3.7
0.9
1.0
3.4
2.1
16.7
Home
8
31.9
6.8-12.5
54.0
1.1-3.8
30.0
1.9-2.3
83.3
2.1
4.1
6.3
4.0
1.1
0.8
3.1
2.8
16.5
Road
6
35.2
7.0-14.0
50.0
1.5-4.8
31.0
1.5-1.7
90.0
1.7
4.5
6.2
3.3
0.7
1.3
3.8
1.3
17.0
vs. Division
2
32.0
5.0-10.0
50.0
1.0-2.5
40.0
3.5-3.5
100.0
2.0
4.0
6.0
3.0
1.5
1.5
4.0
3.0
14.5
vs. Conference
8
34.0
7.3-14.4
50.4
1.0-4.5
22.2
2.4-2.6
90.5
2.0
4.3
6.3
4.0
0.9
1.1
3.4
2.4
17.9
3+ Days Rest
2
27.0
7.5-11.5
65.2
0.5-3.0
16.7
1.0-1.0
100.0
3.0
5.5
8.5
2.0
0.5
1.5
3.0
2.5
16.5
Month
Split
GP
MIN
FG
FG%
3PT
3P%
FT
FT%
OR
DR
REB
AST
BLK
STL
PF
TO
PTS
October
7
33.3
7.4-13.4
55.3
1.4-4.1
34.5
1.0-1.3
77.8
1.3
4.6
5.9
3.6
0.9
0.9
3.4
1.7
17.3
November
7
33.1
6.3-12.9
48.9
1.1-4.3
26.7
2.4-2.7
89.5
2.6
4.0
6.6
3.9
1.0
1.1
3.4
2.6
16.1
Pre All-Star
14
33.2
6.9-13.1
52.2
1.3-4.2
30.5
1.7-2.0
85.7
1.9
4.3
6.2
3.7
0.9
1.0
3.4
2.1
16.7
Result
Split
GP
MIN
FG
FG%
3PT
3P%
FT
FT%
OR
DR
REB
AST
BLK
STL
PF
TO
PTS
Wins
10
31.8
6.8-12.9
52.7
1.1-3.8
28.9
1.7-1.9
89.5
2.3
4.4
6.7
3.5
1.2
1.0
3.2
2.3
16.4
Losses
4
36.8
7.0-13.8
50.9
1.8-5.3
33.3
1.8-2.3
77.8
1.0
4.0
5.0
4.3
0.3
1.0
4.0
1.8
17.5
Position
Split
GP
MIN
FG
FG%
3PT
3P%
FT
FT%
OR
DR
REB
AST
BLK
STL
PF
TO
PTS
As Starter
14
33.2
6.9-13.1
52.2
1.3-4.2
30.5
1.7-2.0
85.7
1.9
4.3
6.2
3.7
0.9
1.0
3.4
2.1
16.7
Day
Split
GP
MIN
FG
FG%
3PT
3P%
FT
FT%
OR
DR
REB
AST
BLK
STL
PF
TO
PTS
Monday
3
32.3
5.3-11.3
47.1
1.3-3.0
44.4
1.3-2.0
66.7
2.0
4.0
6.0
3.3
0.7
0.7
4.3
1.3
13.3
Wednesday
3
33.7
7.7-14.3
53.5
0.7-5.7
11.8
0.7-1.0
66.7
1.3
6.0
7.3
3.0
0.0
1.7
4.3
2.0
16.7
Thursday
1
25.0
7.0-12.0
58.3
0.0-3.0
0.0
2.0-2.0
100.0
4.0
5.0
9.0
3.0
1.0
0.0
2.0
3.0
16.0
Friday
3
34.3
8.3-16.0
52.1
1.7-4.7
35.7
2.0-2.0
100.0
2.7
3.3
6.0
5.0
1.7
0.7
2.3
1.3
20.3
Saturday
2
38.0
7.0-14.0
50.0
2.0-5.0
40.0
2.5-3.0
83.3
1.5
2.5
4.0
4.5
0.5
2.0
2.5
2.5
18.5
Sunday
2
32.0
5.5-9.5
57.9
1.5-3.0
50.0
2.5-2.5
100.0
1.0
5.0
6.0
3.0
2.0
0.5
4.0
4.0
15.0
Opponent
Split
GP
MIN
FG
FG%
3PT
3P%
FT
FT%
OR
DR
REB
AST
BLK
STL
PF
TO
PTS
Chicago Bulls
1
37.0
7.0-11.0
63.6
2.0-5.0
40.0
2.0-2.0
100.0
2.0
3.0
5.0
6.0
1.0
2.0
2.0
3.0
18.0
Cleveland Cavaliers
1
37.0
6.0-9.0
66.7
2.0-3.0
66.7
0.0-0.0
0.0
0.0
6.0
6.0
4.0
0.0
0.0
6.0
0.0
14.0
Dallas Mavericks
1
25.0
7.0-12.0
58.3
0.0-3.0
0.0
2.0-2.0
100.0
4.0
5.0
9.0
3.0
1.0
0.0
2.0
3.0
16.0
Golden State Warriors
1
35.0
8.0-18.0
44.4
1.0-8.0
12.5
2.0-3.0
66.7
1.0
5.0
6.0
4.0
0.0
0.0
5.0
2.0
19.0
Houston Rockets
1
37.0
7.0-14.0
50.0
0.0-6.0
0.0
0.0-0.0
0.0
1.0
7.0
8.0
4.0
0.0
2.0
4.0
2.0
14.0
Los Angeles Clippers
1
33.0
11.0-15.0
73.3
1.0-2.0
50.0
0.0-0.0
0.0
2.0
4.0
6.0
7.0
1.0
1.0
1.0
2.0
23.0
Miami Heat
1
29.0
8.0-11.0
72.7
1.0-3.0
33.3
0.0-0.0
0.0
2.0
6.0
8.0
1.0
0.0
3.0
4.0
2.0
17.0
Milwaukee Bucks
1
29.0
5.0-14.0
35.7
2.0-4.0
50.0
1.0-3.0
33.3
4.0
2.0
6.0
3.0
0.0
0.0
4.0
2.0
13.0
New Orleans Pelicans
1
40.0
8.0-19.0
42.1
2.0-7.0
28.6
5.0-5.0
100.0
3.0
3.0
6.0
5.0
2.0
1.0
4.0
2.0
23.0
Orlando Magic
1
30.0
6.0-14.0
42.9
2.0-5.0
40.0
1.0-1.0
100.0
3.0
3.0
6.0
3.0
2.0
0.0
2.0
0.0
15.0
Portland Trail Blazers
1
31.0
5.0-11.0
45.5
0.0-2.0
0.0
3.0-3.0
100.0
2.0
4.0
6.0
3.0
2.0
2.0
3.0
2.0
13.0
San Antonio Spurs
1
39.0
7.0-17.0
41.2
2.0-5.0
40.0
3.0-4.0
75.0
1.0
2.0
3.0
3.0
0.0
2.0
3.0
2.0
19.0
Toronto Raptors
1
31.0
6.0-10.0
60.0
1.0-3.0
33.3
1.0-1.0
100.0
0.0
6.0
6.0
3.0
3.0
0.0
3.0
4.0
14.0
Utah Jazz
1
33.0
5.0-9.0
55.6
2.0-3.0
66.7
4.0-4.0
100.0
2.0
4.0
6.0
3.0
1.0
1.0
5.0
4.0
16.0
07 / SEASON-BY-SEASON HISTORY
Career statistics
Regular Season Averages
Season
Team
GP
GS
MIN
FG
FG%
3PT
3P%
FT
FT%
OR
DR
REB
AST
BLK
STL
PF
TO
PTS
2020-21
Minnesota Timberwolves
63
27
24.0
2.6-5.8
44.7
1.1-3.1
36.4
0.4-0.7
60.0
0.8
2.9
3.7
1.1
1.0
0.6
2.7
0.7
6.8
2021-22
Minnesota Timberwolves
70
31
25.8
3.6-7.9
46.0
1.1-3.6
31.7
0.8-1.0
80.3
1.1
3.1
4.2
1.1
0.8
0.7
3.2
1.1
9.2
2022-23
Minnesota Timberwolves
79
79
30.6
4.7-9.1
51.7
1.4-3.4
39.8
1.3-1.8
73.6
1.2
2.7
3.9
1.9
1.0
0.9
3.4
1.4
12.1
2023-24
Minnesota Timberwolves
72
71
29.2
4.3-8.7
48.9
1.2-3.5
33.7
0.8-1.1
72.2
0.8
2.3
3.1
1.4
0.6
0.9
3.0
1.2
10.5
2024-25
Minnesota Timberwolves
82
82
31.9
4.9-10.2
47.7
1.2-3.7
33.0
1.3-1.6
81.3
1.6
4.2
5.7
2.0
0.9
1.3
2.7
1.2
12.2
2025-26
Minnesota Timberwolves
73
73
31.7
5.7-11.1
51.5
1.4-3.4
41.2
2.0-2.4
83.5
1.0
3.2
4.2
2.7
1.0
1.1
3.3
1.8
14.8
2026-27
Minnesota Timberwolves
14
14
33.2
6.9-13.1
52.2
1.3-4.2
30.5
1.7-2.0
85.7
1.9
4.3
6.2
3.7
0.9
1.0
3.4
2.1
16.7
Career
—
453
377
29.2
4.4-9.0
49.0
1.2-3.5
35.7
1.2-1.5
77.8
1.1
3.1
4.2
1.8
0.9
0.9
3.1
1.3
11.3
Regular Season Totals
Season
Team
FG
FG%
3PT
3P%
FT
FT%
OR
DR
REB
AST
BLK
STL
PF
TO
PTS
2020-21
Minnesota Timberwolves
164-367
44.7
72-198
36.4
27-45
60.0
52
180
232
71
60
35
172
47
427
2021-22
Minnesota Timberwolves
255-554
46.0
80-252
31.7
57-71
80.3
76
217
293
79
54
52
224
75
647
2022-23
Minnesota Timberwolves
370-716
51.7
107-269
39.8
106-144
73.6
92
215
307
148
76
74
272
112
953
2023-24
Minnesota Timberwolves
307-628
48.9
86-255
33.7
57-79
72.2
56
168
224
101
42
63
219
87
757
2024-25
Minnesota Timberwolves
398-834
47.7
100-303
33.0
104-128
81.3
129
341
470
163
74
110
225
95
1000
2025-26
Minnesota Timberwolves
417-809
51.5
103-250
41.2
147-176
83.5
76
234
310
199
73
81
244
131
1084
2026-27
Minnesota Timberwolves
96-184
52.2
18-59
30.5
24-28
85.7
27
60
87
52
13
14
48
30
234
Career
—
2007-4092
49.0
566-1586
35.7
522-671
77.8
508
1415
1923
813
392
429
1404
577
5102
Regular Season Misc Totals
Season
Team
DD2
TD3
DQ
EJECT
TECH
FLAG
AST/TO
STL/TO
SC-EFF
SH-EFF
2020-21
Minnesota Timberwolves
0
0
1
0
0
1
1.5
0.7
1.163
0.54
2021-22
Minnesota Timberwolves
0
0
8
0
1
0
1.1
0.7
1.168
0.53
2022-23
Minnesota Timberwolves
0
0
6
1
4
2
1.3
0.7
1.331
0.59
2023-24
Minnesota Timberwolves
0
0
5
1
4
1
1.2
0.7
1.205
0.56
2024-25
Minnesota Timberwolves
10
0
0
1
3
1
1.7
1.2
1.199
0.54
2025-26
Minnesota Timberwolves
0
0
0
0
4
1
1.5
0.6
1.340
0.58
2026-27
Minnesota Timberwolves
0
0
1
0
1
0
1.7
0.5
1.272
0.57
Career
—
10
0
21
3
17
6
1.4
0.7
1.247
0.56
Scoring, rebounding and assist trend
08 / SHOT CHART AND ZONE SHOOTING
Shot profile
Shot-location data is not connected. Add a BALLDONTLIE GOAT-tier NBA API key in NBA Players → Settings to enable shot charts and zone shooting.
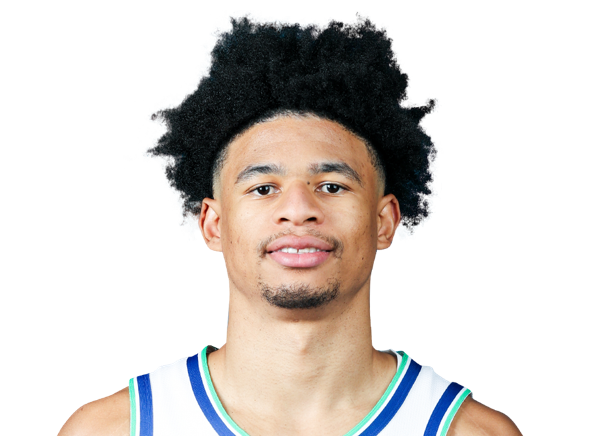
LATEST UPDATEMcDaniels finished Monday's 106-98 victory over Portland with 13 points (5-11 FG, 0-2 3Pt, 3-3 FT), six rebounds, three assists, two blocks and two steals over 31 minutes.
McDaniels tied his season low in points but was still productive on the offensive end in this one. The veteran forward also made his presence felt on the defensive end, where he racked up at least three combined steals-plus-blocks for the third time in his last five games. During that span, he's averaged 17.2 points, 6.4 rebounds, 4.0 assists and 2.6 combined steals-plus-blocks in 33.2 minutes per contest. McDaniels should continue seeing increased usage in Anthony Edwards' (knee) absence.




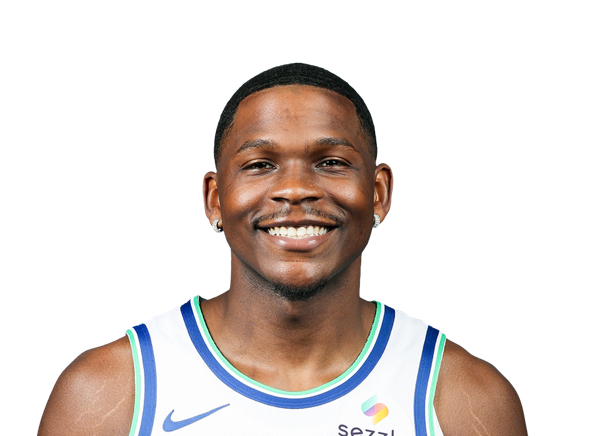 Anthony EdwardsG #5
 Antonio ReevesG #12
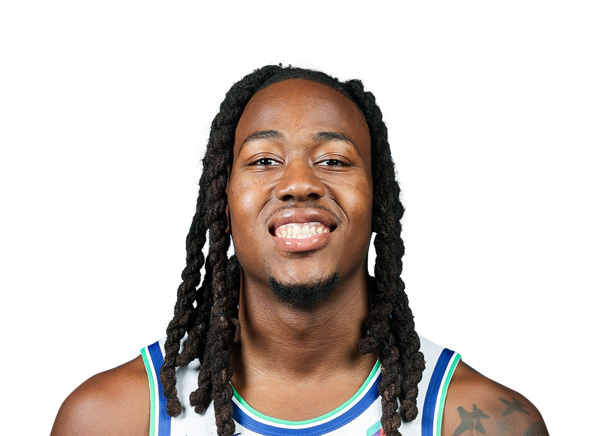 Ayo DosunmuG #13
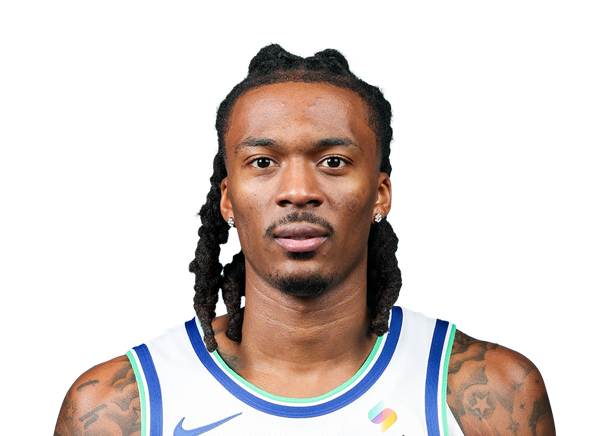 Bones HylandG #8
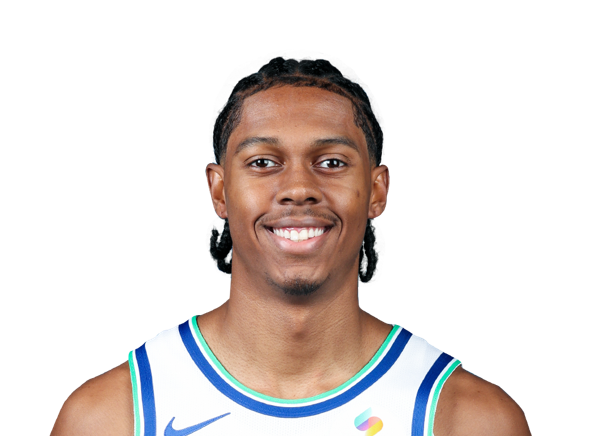 Cody WilliamsF #9
 Donte DiVincenzoG
 Enrique FreemanF #25
 Isaiah EvansF #33
 Jaylen ClarkG #7
 Joan BeringerF #19
 Joe InglesF #7
 Johni BroomeF #22
 Jonathan KumingaF #24
 KJ MartinF #99
 LaMelo BallG #1
 Rocco ZikarskyC #44
 Rudy GobertC #27
 Terrence Shannon Jr.G #4
 Trey Kaufman-RennF
 Trey LylesF #41
 Zyon PullinG #15