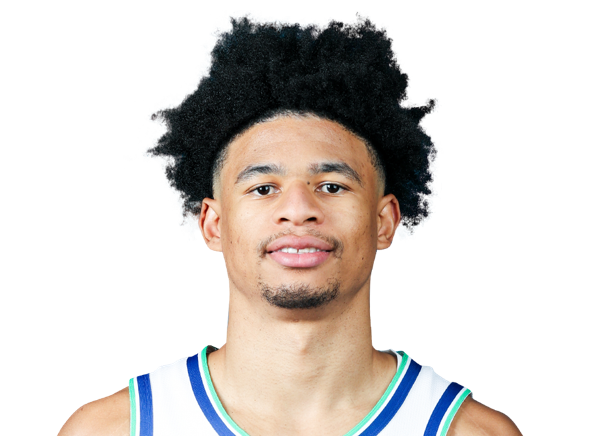
Click a season to open this player’s full game log, splits and advanced stats for that year; click a team to open its page. A dash means no NBA games were recorded.
03 / EVERY CATEGORY THE PROVIDER REPORTS
Full statistical breakdown
Regular season 2025-26
Defensive
Metric
Total
NBA rank
Blocks
0
Tied-524th
Defensive Rebounds
2
Tied-559th
Steals
1
Tied-540th
Defensive Rebound Rate
0.0
—
Defensive Rebounds Per Game
0.4
—
Blocks Per Game
0.0
—
Steals Per Game
0.2
—
Defensive Rebounds Per 48
2.2
2,981st
Blocks Per 48
0.0
2,794th
Steals Per 48
1.1
2,880th
General
Metric
Total
NBA rank
Disqualifications
0
Tied-41st
Flagrant Fouls
0
Tied-116th
Fouls
6
Tied-520th
Player Efficiency Rating
19.03
—
Rebound Rate
0.0
—
Ejections
0
Tied-51st
Technical Fouls
0
Tied-269th
Rebounds
3
—
Value Over Replacement Player
5.3
—
Minutes
43
Tied-9th
Minutes Per Game
8.6
—
Rating
9.0
Tied-598th
Plus-Minus
+6
Tied-1st
Rebounds Per Game
0.6
—
Fouls Per Game
1.2
—
Flagrant Fouls Per Game
0.0
—
Technical Fouls Per Game
0.0
—
Ejections Per Game
0.0
—
Disqualifications Per Game
0.0
—
Assist To Turnover Ratio
3.0
—
Steal To Foul Ratio
0.2
—
Block To Foul Ratio
0.0
—
Team Rebounds Per Game
0.0
—
Rebounds
3
—
Total Technical Fouls
0
—
Assist To Turnover Ratio
0.0
—
Steal To Turnover Ratio
0.3
—
Rebounds Per 48 Minutes
3.3
—
Fouls Per 48 Minutes
6.7
2,773rd
Flagrant Fouls Per 48 Minutes
0.0
618th
Technical Fouls Per 48 Minutes
0.0
1,434th
Ejections Per 48 Minutes
0.0
272nd
Disqualifications Per 48 Minutes
0.0
218th
R/40
2.8
—
Games Played
5
5th
Games Started
0
Tied-450th
Double Double
0
Tied-284th
Triple Double
0
Tied-38th
Offensive
Metric
Total
NBA rank
Assists
9
Tied-496th
Effective Field Goal Percentage
73.1
—
Field Goals
9/13
—
Field Goals Attempted
13
Tied-533rd
Field Goals Made
9
Tied-518th
Field Goal Percentage
69.2
—
Free Throws
4/4
—
Free Throw Percentage
100.0
—
Free Throws Attempted
4
Tied-515th
Free Throws Made
4
Tied-501st
Offensive Rebounds
1
Tied-546th
Points
23
Tied-520th
Turnovers
3
Tied-514th
3-Point Field Goal Percentage
33.3
—
3-Point Field Goals Attempted
3
Tied-517th
3-Point Field Goals Made
1
Tied-493rd
True Shooting Percentage
77.9
—
Total Turnovers
3
—
Assist Ratio
33.6
—
Points in the Paint
0
Tied-1st
Offensive Rebound Rate
0.0
—
Turnover Ratio
11.2
—
Brick Index
0.00
—
Usage Rate
0.0
—
Average Field Goals Made
1.8
—
Average Field Goals Attempted
2.6
—
Average 3-Point Field Goals Made
0.2
—
Average 3-Point Field Goals Attempted
0.6
—
Average Free Throws Made
0.8
—
Average Free Throws Attempted
0.8
—
Points Per Game
4.6
—
Offensive Rebounds Per Game
0.2
—
Assists Per Game
1.8
—
Turnovers Per Game
0.6
—
Offensive Rebound Percentage
0.3
—
Estimated Possessions
16.6
—
Estimated Possessions Per Game
3.3
—
Points Per Estimated Possession
1.4
—
Team Turnovers Per Game
0.0
—
Total Turnovers Per Game
0.6
—
3-Point Field Goal Percentage
33.3
—
2-Point Field Goals Made
8.0
Tied-25th
2-Point Field Goals Attempted
10.0
Tied-16th
2-Point Field Goals Made per Game
1.6
—
2-Point Field Goals Attempted per Game
2.0
—
2-Point Field Goal Percentage
80.0
—
Shooting Efficiency
0.73
—
Scoring Efficiency
1.769
—
Fieldgoals Made Per 48
10.0
2,762nd
Fieldgoals Attempted Per 48
14.5
2,842nd
3-Point Fieldgoals Made Per 48
1.1
2,629th
3-Point Fieldgoals Attempted Per 48
3.3
2,757th
Freethrows Made Per 48
4.5
2,672nd
Freethrows Attempted Per 48
4.5
2,746th
Points Scored Per 48
25.7
2,773rd
Offensive Rebounds Per 48
1.1
2,912th
Assists Per 48
10.0
2,645th
Turnovers
3.3
2,741st
P/40
21.4
—
A/40
8.4
—
04 / EFFICIENCY, SHOOTING PROFILE, PER-36
Advanced metrics
True shooting %77.9%
Effective FG %73.1%
2-point FG %80.0%
3-point attempt rate23.1%
Free throw rate30.8%
Points per shot attempt1.77
% of points from 3s13.0%
Assist-to-turnover3.00
Points per 36 min19.3
Rebounds per 36 min2.5
Assists per 36 min7.5
Steals per 36 min0.84
Blocks per 36 min0.00
Turnovers per 36 min2.51
Stocks (STL + BLK) per game0.20
Pts + Reb + Ast per game7.0
Efficiency (EFF) per game5.8
Game Score per game (Hollinger)4.1
Minutes per game8.6
Calculated by BallersCulture from the supplied 2025-26 box-score totals using standard formulas (hover a tile to see the formula). Tracking-based metrics such as BPM, VORP, on/off and RAPTOR are not available from this data source.
05 / 5 GAMES IN 2025-26
Game log: Regular season
Date
Opp
Result
MIN
FG
FG%
3PT
3P%
FT
FT%
REB
AST
BLK
STL
PF
TO
PTS
Apr 13
vs NO
W 132-126
31
8-12
66.7
1-3
33.3
2-2
100.0
3
5
0
0
4
0
19
Apr 8
@ IND
W 124-104
3
0-0
0.0
0-0
0.0
0-0
0.0
0
0
0
0
0
0
0
Apr 6
vs CHA
L 122-108
2
0-0
0.0
0-0
0.0
0-0
0.0
0
1
0
0
0
1
0
Mar 23
@ BOS
W 102-92
1
0-0
0.0
0-0
0.0
0-0
0.0
0
0
0
0
1
0
0
Mar 19
vs UTAH
W 147-111
5
1-1
100.0
0-0
0.0
2-2
100.0
0
3
0
1
1
2
4
06 / 2025-26 HOME / AWAY, RESULTS, MONTHS AND OPPONENTS
5th in Western Conference Division · Target Center
Overall49-33
Home26-15
Road23-18
DIV9-7
CONF31-21
Last Ten Games5-5
Team records for 2025-26 (regular season).
Team statistics 2025-26
Defensive
Metric
Total
Per game
NBA rank
Blocks
476
5.805
1st
Defensive Rebounds
2708
33.024
6th
Steals
717
8.744
8th
Points Conceded Off Turnovers
0
17
—
Defensive Rebound Rate
0.0
—
—
Defensive Rebounds Per Game
33.0
—
—
Blocks Per Game
5.8
—
—
Steals Per Game
8.7
—
—
Defensive Rebounds Per 48
0.0
—
—
Blocks Per 48
0.0
—
—
Steals Per 48
0.0
—
—
General
Metric
Total
Per game
NBA rank
Disqualifications
2
—
Tied-4th
Flagrant Fouls
14
0.171
1st
Fouls
1738
21.195
1st
Rebound Rate
50.6
—
5th
Ejections
4
0.049
Tied-2nd
Technical Fouls
104
0.634
4th
Rebounds
3615
44.085
—
Minutes
0
—
—
Minutes Per Game
0.0
—
—
Fantasy Rating
0.0
—
—
Rating
218.1
—
—
Plus-Minus
-1
-1
Tied-1st
Game Day of Year
0
—
—
Rebounds Per Game
44.1
—
—
Fouls Per Game
21.2
—
—
Flagrant Fouls Per Game
0.2
—
—
Technical Fouls Per Game
1.3
—
—
Ejections Per Game
0.0
—
—
Disqualifications Per Game
0.0
—
—
Assist To Turnover Ratio
1.8
1.846
—
Steal To Foul Ratio
0.4
0.413
—
Block To Foul Ratio
0.3
0.274
—
Team Rebounds Per Game
0.0
—
—
Rebounds
3615
44.085
—
Total Technical Fouls
104
0.634
—
Assist To Turnover Ratio
38.2
—
—
Team Rebounds
0
—
—
Steal To Turnover Ratio
0.6
0.619
—
Rebounds Per 48 Minutes
0.0
—
—
Fouls Per 48 Minutes
0.0
—
—
Flagrant Fouls Per 48 Minutes
0.0
—
—
Technical Fouls Per 48 Minutes
0.0
—
—
Ejections Per 48 Minutes
0.0
—
—
Disqualifications Per 48 Minutes
0.0
—
—
Games Played
82
—
Tied-1st
Games Started
0
—
—
Double Double
0
—
—
Triple Double
0
—
—
Offensive
Metric
Total
Per game
NBA rank
Assists
2138
26.073
6th
Effective Field Goal Percentage
55.9
—
4th
Field Goals
3495/7260
0.481
—
Field Goals Attempted
7260
88.537
12th
Field Goals Made
3495
42.622
5th
Field Goal Percentage
48.1
0.481
6th
Free Throws
1558/2072
0.752
—
Free Throw Percentage
75.2
0.752
15th
Free Throws Attempted
2072
25.268
5th
Free Throws Made
1558
19
9th
Offensive Rebounds
907
11.061
10th
Points
9676
118
4th
Turnovers
1158
14.122
6th
3-Point Field Goal Percentage
37.0
0.37
2nd
3-Point Field Goals Attempted
3049
37.183
7th
3-Point Field Goals Made
1128
13.756
7th
True Shooting Percentage
59.2
—
6th
Team Turnovers
56
—
9th
Total Turnovers
1214
14.122
—
Assist Ratio
18.6
—
8th
Points in the Paint
4126
50
8th
Offensive Rebound Rate
25.9
—
8th
Turnover Ratio
12.9
—
8th
Fast Break Points
1310
—
—
Possessions
8479
—
6th
Pace Factor
102.5
—
5th
Average Field Goals Made
42.6
—
—
Average Field Goals Attempted
88.5
—
—
Average 3-Point Field Goals Made
13.8
—
—
Average 3-Point Field Goals Attempted
37.2
—
—
Average Free Throws Made
19.0
—
—
Average Free Throws Attempted
25.3
—
—
Points Per Game
118.0
—
—
Offensive Rebounds Per Game
11.1
—
—
Assists Per Game
26.1
—
—
Turnovers Per Game
14.1
—
—
Offensive Rebound Percentage
0.2
0.241
—
Estimated Possessions
8395.8
101.705
—
Estimated Possessions Per Game
102.4
—
—
Points Per Estimated Possession
1.2
1.16
—
Team Turnovers Per Game
0.7
—
—
Total Turnovers Per Game
14.8
—
—
3-Point Field Goal Percentage
37.0
0.37
1st
2-Point Field Goals Made
2367.0
28.866
Tied-2nd
2-Point Field Goals Attempted
4211.0
51.354
5th
2-Point Field Goals Made per Game
28.9
—
—
2-Point Field Goals Attempted per Game
51.4
—
—
2-Point Field Goal Percentage
56.2
0.562
—
Shooting Efficiency
0.56
0.559
—
Scoring Efficiency
1.333
1.333
—
Fieldgoals Made Per 48
0.0
—
—
Fieldgoals Attempted Per 48
0.0
—
—
3-Point Fieldgoals Made Per 48
0.0
—
—
3-Point Fieldgoals Attempted Per 48
0.0
—
—
Freethrows Made Per 48
0.0
—
—
Freethrows Attempted Per 48
0.0
—
—
Points Scored Per 48
0.0
—
—
Offensive Rebounds Per 48
0.0
—
—
Assists Per 48
0.0
—
—
Turnovers
0.0
—
—
09 / SALARY BY SEASON
Contract
No contract is on file for this player yet.
10 / LATEST REPORT
Injury status
No current injury report entry for this player.
11 / SIGNINGS, TRADES AND ROSTER MOVES
Transactions
No recorded transactions for this player.
12 / LATEST COVERAGE
Player news
LATEST UPDATEPullin is in the starting lineup for Friday's preseason matchup with the Bulls.
The Timberwolves are resting their entire starting lineup and some key reserves for Friday's final exhibition game, so Pullin will draw the start alongside Terrence Shannon, Jaylen Clark, Cody Williams and Joan Beringer. Pullin is coming off a 22-point performance, so it'll be interesting to see what he can do with the starting role Friday evening.