Click a season to open this player’s full game log, splits and advanced stats for that year; click a team to open its page. A dash means no NBA games were recorded.
03 / EVERY CATEGORY THE PROVIDER REPORTS
Full statistical breakdown
Regular season 2026-27
Defensive
Metric
Total
NBA rank
Blocks
1
Tied-292nd
Defensive Rebounds
9
Tied-341st
Steals
1
Tied-364th
Defensive Rebound Rate
0.0
—
Defensive Rebounds Per Game
1.8
—
Blocks Per Game
0.2
—
Steals Per Game
0.2
—
Defensive Rebounds Per 48
7.9
2,728th
Blocks Per 48
0.9
2,336th
Steals Per 48
0.9
2,912th
General
Metric
Total
NBA rank
Disqualifications
0
Tied-22nd
Flagrant Fouls
0
Tied-24th
Fouls
5
Tied-368th
Player Efficiency Rating
9.82
—
Rebound Rate
0.0
—
Ejections
0
Tied-7th
Technical Fouls
0
Tied-104th
Rebounds
13
—
Value Over Replacement Player
-0.8
—
Minutes
55
Tied-6th
Minutes Per Game
11.0
—
Rating
7.6
Tied-402nd
Plus-Minus
+18
Tied-1st
Rebounds Per Game
2.6
—
Fouls Per Game
1.0
—
Flagrant Fouls Per Game
0.0
—
Technical Fouls Per Game
0.0
—
Ejections Per Game
0.0
—
Disqualifications Per Game
0.0
—
Assist To Turnover Ratio
1.3
—
Steal To Foul Ratio
0.2
—
Block To Foul Ratio
0.2
—
Team Rebounds Per Game
0.0
—
Rebounds
13
—
Total Technical Fouls
0
—
Assist To Turnover Ratio
0.0
—
Steal To Turnover Ratio
0.3
—
Rebounds Per 48 Minutes
11.3
—
Fouls Per 48 Minutes
4.4
2,944th
Flagrant Fouls Per 48 Minutes
0.0
192nd
Technical Fouls Per 48 Minutes
0.0
832nd
Ejections Per 48 Minutes
0.0
56th
Disqualifications Per 48 Minutes
0.0
176th
R/40
9.5
—
Games Played
5
5th
Games Started
0
Tied-258th
Double Double
0
Tied-121st
Triple Double
0
Tied-13th
Offensive
Metric
Total
NBA rank
Assists
5
Tied-340th
Effective Field Goal Percentage
53.3
—
Field Goals
7/15
—
Field Goals Attempted
15
Tied-372nd
Field Goals Made
7
Tied-359th
Field Goal Percentage
46.7
—
Free Throws
2/4
—
Free Throw Percentage
50.0
—
Free Throws Attempted
4
Tied-338th
Free Throws Made
2
Tied-360th
Offensive Rebounds
4
Tied-305th
Points
18
Tied-368th
Turnovers
4
Tied-315th
3-Point Field Goal Percentage
25.0
—
3-Point Field Goals Attempted
8
Tied-323rd
3-Point Field Goals Made
2
Tied-320th
True Shooting Percentage
53.7
—
Total Turnovers
4
—
Assist Ratio
19.4
—
Points in the Paint
0
Tied-1st
Offensive Rebound Rate
0.0
—
Turnover Ratio
15.5
—
Brick Index
0.00
—
Usage Rate
0.0
—
Average Field Goals Made
1.4
—
Average Field Goals Attempted
3.0
—
Average 3-Point Field Goals Made
0.4
—
Average 3-Point Field Goals Attempted
1.6
—
Average Free Throws Made
0.4
—
Average Free Throws Attempted
0.8
—
Points Per Game
3.6
—
Offensive Rebounds Per Game
0.8
—
Assists Per Game
1.0
—
Turnovers Per Game
0.8
—
Offensive Rebound Percentage
0.5
—
Estimated Possessions
16.6
—
Estimated Possessions Per Game
3.3
—
Points Per Estimated Possession
1.1
—
Team Turnovers Per Game
0.0
—
Total Turnovers Per Game
0.8
—
3-Point Field Goal Percentage
25.0
—
2-Point Field Goals Made
5.0
Tied-39th
2-Point Field Goals Attempted
7.0
Tied-49th
2-Point Field Goals Made per Game
1.0
—
2-Point Field Goals Attempted per Game
1.4
—
2-Point Field Goal Percentage
71.4
—
Shooting Efficiency
0.53
—
Scoring Efficiency
1.200
—
Fieldgoals Made Per 48
6.1
2,872nd
Fieldgoals Attempted Per 48
13.1
2,976th
3-Point Fieldgoals Made Per 48
1.7
2,560th
3-Point Fieldgoals Attempted Per 48
7.0
2,584th
Freethrows Made Per 48
1.7
2,880th
Freethrows Attempted Per 48
3.5
2,704th
Points Scored Per 48
15.7
2,944th
Offensive Rebounds Per 48
3.5
2,440th
Assists Per 48
4.4
2,720th
Turnovers
3.5
2,520th
P/40
13.1
—
A/40
3.6
—
04 / EFFICIENCY, SHOOTING PROFILE, PER-36
Advanced metrics
True shooting %53.7%
Effective FG %53.3%
2-point FG %71.4%
3-point attempt rate53.3%
Free throw rate26.7%
Points per shot attempt1.20
% of points from 3s33.3%
Assist-to-turnover1.25
Points per 36 min11.8
Rebounds per 36 min8.5
Assists per 36 min3.3
Steals per 36 min0.65
Blocks per 36 min0.65
Turnovers per 36 min2.62
Stocks (STL + BLK) per game0.40
Pts + Reb + Ast per game7.2
Efficiency (EFF) per game4.8
Game Score per game (Hollinger)2.8
Minutes per game11.0
Calculated by BallersCulture from the supplied 2026-27 box-score totals using standard formulas (hover a tile to see the formula). Tracking-based metrics such as BPM, VORP, on/off and RAPTOR are not available from this data source.
05 / 5 GAMES IN 2026-27
Game log: Regular season
Date
Opp
Result
MIN
FG
FG%
3PT
3P%
FT
FT%
REB
AST
BLK
STL
PF
TO
PTS
Nov 5
@ WSH
W 120-105
10
1-1
100.0
0-0
0.0
0-0
0.0
3
3
0
0
2
1
2
Nov 3
@ IND
W 108-104
17
0-1
0.0
0-0
0.0
0-0
0.0
4
1
1
1
3
2
0
Nov 1
@ NO
L 121-99
19
5-11
45.5
1-6
16.7
2-2
100.0
4
1
0
0
0
1
13
Oct 27
@ HOU
L 120-110
1
0-0
0.0
0-0
0.0
0-0
0.0
1
0
0
0
0
0
0
Oct 24
@ CHA
W 128-81
8
1-2
50.0
1-2
50.0
0-2
0.0
1
0
0
0
0
0
3
06 / 2026-27 HOME / AWAY, RESULTS, MONTHS AND OPPONENTS
Splits
split
Split
GP
MIN
FG
FG%
3PT
3P%
FT
FT%
OR
DR
REB
AST
BLK
STL
PF
TO
PTS
All Splits
5
11.0
1.4-3.0
46.7
0.4-1.6
25.0
0.4-0.8
50.0
0.8
1.8
2.6
1.0
0.2
0.2
1.0
0.8
3.6
Road
5
11.0
1.4-3.0
46.7
0.4-1.6
25.0
0.4-0.8
50.0
0.8
1.8
2.6
1.0
0.2
0.2
1.0
0.8
3.6
vs. Division
2
9.0
1.0-1.5
66.7
0.5-1.0
50.0
0.0-1.0
0.0
1.0
1.0
2.0
1.5
0.0
0.0
1.0
0.5
2.5
vs. Conference
3
11.7
0.7-1.3
50.0
0.3-0.7
50.0
0.0-0.7
0.0
0.7
2.0
2.7
1.3
0.3
0.3
1.7
1.0
1.7
3+ Days Rest
2
13.5
3.0-6.5
46.2
1.0-4.0
25.0
1.0-2.0
50.0
1.0
1.5
2.5
0.5
0.0
0.0
0.0
0.5
8.0
Month
Split
GP
MIN
FG
FG%
3PT
3P%
FT
FT%
OR
DR
REB
AST
BLK
STL
PF
TO
PTS
October
3
9.3
2.0-4.3
46.2
0.7-2.7
25.0
0.7-1.3
50.0
0.7
1.3
2.0
0.3
0.0
0.0
0.0
0.3
5.3
November
2
13.5
0.5-1.0
50.0
0.0-0.0
0.0
0.0-0.0
0.0
1.0
2.5
3.5
2.0
0.5
0.5
2.5
1.5
1.0
Pre All-Star
5
11.0
1.4-3.0
46.7
0.4-1.6
25.0
0.4-0.8
50.0
0.8
1.8
2.6
1.0
0.2
0.2
1.0
0.8
3.6
Result
Split
GP
MIN
FG
FG%
3PT
3P%
FT
FT%
OR
DR
REB
AST
BLK
STL
PF
TO
PTS
Wins
3
11.7
0.7-1.3
50.0
0.3-0.7
50.0
0.0-0.7
0.0
0.7
2.0
2.7
1.3
0.3
0.3
1.7
1.0
1.7
Losses
2
10.0
2.5-5.5
45.5
0.5-3.0
16.7
1.0-1.0
100.0
1.0
1.5
2.5
0.5
0.0
0.0
0.0
0.5
6.5
Day
Split
GP
MIN
FG
FG%
3PT
3P%
FT
FT%
OR
DR
REB
AST
BLK
STL
PF
TO
PTS
Monday
2
9.5
0.0-0.5
0.0
0.0-0.0
0.0
0.0-0.0
0.0
0.0
2.5
2.5
0.5
0.5
0.5
1.5
1.0
0.0
Wednesday
1
10.0
1.0-1.0
100.0
0.0-0.0
0.0
0.0-0.0
0.0
2.0
1.0
3.0
3.0
0.0
0.0
2.0
1.0
2.0
Friday
1
8.0
1.0-2.0
50.0
1.0-2.0
50.0
0.0-2.0
0.0
0.0
1.0
1.0
0.0
0.0
0.0
0.0
0.0
3.0
Saturday
1
19.0
5.0-11.0
45.5
1.0-6.0
16.7
2.0-2.0
100.0
2.0
2.0
4.0
1.0
0.0
0.0
0.0
1.0
13.0
Opponent
Split
GP
MIN
FG
FG%
3PT
3P%
FT
FT%
OR
DR
REB
AST
BLK
STL
PF
TO
PTS
Charlotte Hornets
1
8.0
1.0-2.0
50.0
1.0-2.0
50.0
0.0-2.0
0.0
0.0
1.0
1.0
0.0
0.0
0.0
0.0
0.0
3.0
Houston Rockets
1
1.0
0.0-0.0
0.0
0.0-0.0
0.0
0.0-0.0
0.0
0.0
1.0
1.0
0.0
0.0
0.0
0.0
0.0
0.0
Indiana Pacers
1
17.0
0.0-1.0
0.0
0.0-0.0
0.0
0.0-0.0
0.0
0.0
4.0
4.0
1.0
1.0
1.0
3.0
2.0
0.0
New Orleans Pelicans
1
19.0
5.0-11.0
45.5
1.0-6.0
16.7
2.0-2.0
100.0
2.0
2.0
4.0
1.0
0.0
0.0
0.0
1.0
13.0
Washington Wizards
1
10.0
1.0-1.0
100.0
0.0-0.0
0.0
0.0-0.0
0.0
2.0
1.0
3.0
3.0
0.0
0.0
2.0
1.0
2.0
07 / SEASON-BY-SEASON HISTORY
Career statistics
Regular Season Averages
Season
Team
GP
GS
MIN
FG
FG%
3PT
3P%
FT
FT%
OR
DR
REB
AST
BLK
STL
PF
TO
PTS
2025-26
Atlanta Hawks
44
2
11.4
2.1-3.8
53.8
0.7-1.7
38.7
0.4-0.7
55.2
1.0
1.2
2.2
0.6
0.3
0.4
1.5
0.5
5.2
2026-27
Atlanta Hawks
5
0
11.0
1.4-3.0
46.7
0.4-1.6
25.0
0.4-0.8
50.0
0.8
1.8
2.6
1.0
0.2
0.2
1.0
0.8
3.6
Career
—
49
2
11.3
2.0-3.8
53.3
0.6-1.7
37.3
0.4-0.7
54.5
1.0
1.2
2.2
0.6
0.3
0.3
1.4
0.6
5.0
Regular Season Totals
Season
Team
FG
FG%
3PT
3P%
FT
FT%
OR
DR
REB
AST
BLK
STL
PF
TO
PTS
2025-26
Atlanta Hawks
91-169
53.8
29-75
38.7
16-29
55.2
44
52
96
26
15
16
65
23
227
2026-27
Atlanta Hawks
7-15
46.7
2-8
25.0
2-4
50.0
4
9
13
5
1
1
5
4
18
Career
—
98-184
53.3
31-83
37.3
18-33
54.5
48
61
109
31
16
17
70
27
245
Regular Season Misc Totals
Season
Team
DD2
TD3
DQ
EJECT
TECH
FLAG
AST/TO
STL/TO
SC-EFF
SH-EFF
2025-26
Atlanta Hawks
2
0
0
0
0
0
1.1
0.7
1.343
0.62
2026-27
Atlanta Hawks
0
0
0
0
0
0
1.3
0.3
1.200
0.53
Career
—
2
0
0
0
0
0
1.1
0.6
1.332
0.62
Scoring, rebounding and assist trend
08 / SHOT CHART AND ZONE SHOOTING
Shot profile
Shot-location data is not connected. Add a BALLDONTLIE GOAT-tier NBA API key in NBA Players → Settings to enable shot charts and zone shooting.
LATEST UPDATENewell underwent surgery Tuesday for a plantar plate tear in his left great toe, and he will be re-evaluated in approximately four months, Brad Rowland of the Locked On Podcast Network reports.
Newell suffered the toe injury in the Nov. 4 win over Washington and is now set to miss an extended period. With Mouhamed Gueye (foot) expected to miss at least three more weeks, Aaron Wiggins and Corey Kispert could see a slight bump in minutes moving forward.



 Aaron WigginsG #2
 Cameron CorhenF #32
 CJ McCollumG #3
 Corey KispertF #24
 Dorian Finney-SmithF #8
 Dyson DanielsG #5
 Gabe VincentG #4
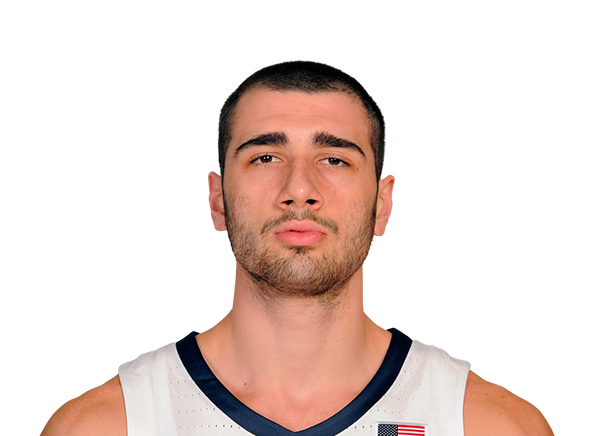 Giorgi BezhanishviliF
 Henri VeesaarC #13
 Isaac McKneelyG #15
 Jalen JohnsonF #1
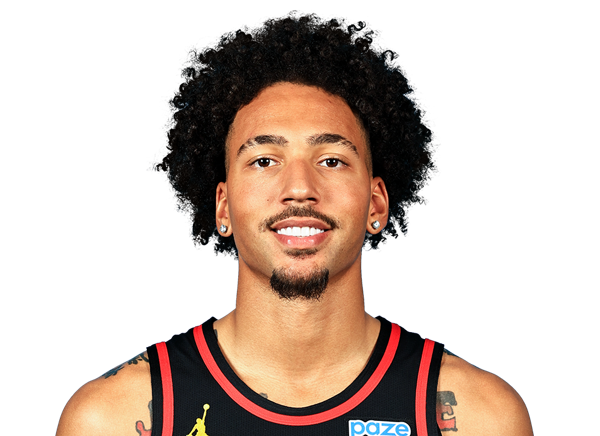 Jalen WilsonF #22
 Jock LandaleC #31
 Keaton WallaceG #2
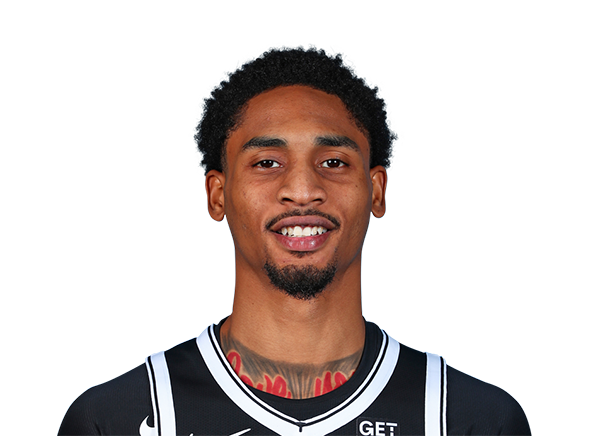 Keon JohnsonG
 Keshon GilbertG #00
 Keyshawn BryantF
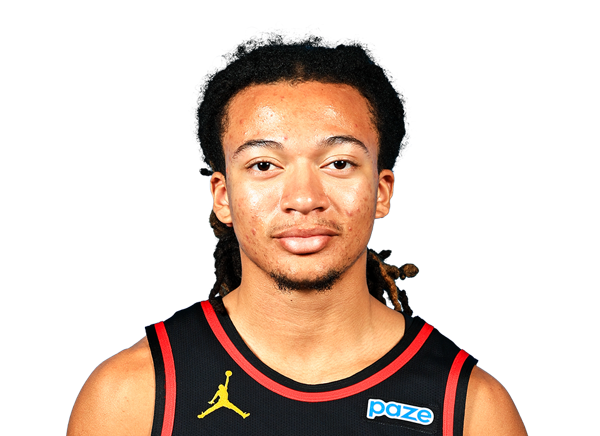 Kingston FlemingsG #4
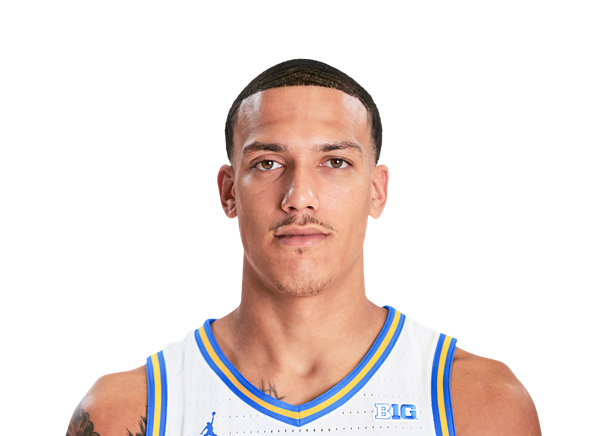 Kobe JohnsonG #12
 Lamont ButlerG
 Luguentz DortG
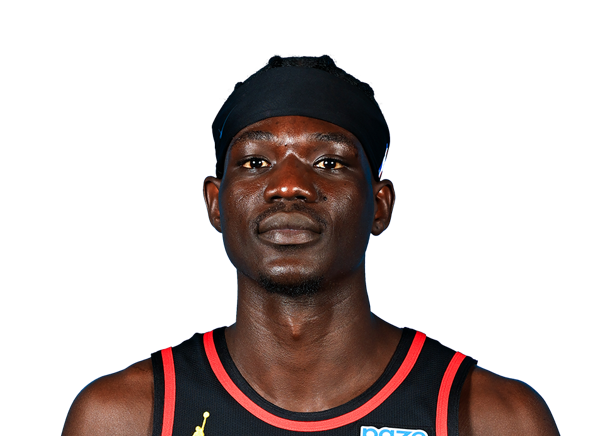 Mouhamed GueyeF #18
 Nickeil Alexander-WalkerG #7
 Onyeka OkongwuF #17
 RayJ DennisG #10
 Will BakerC #9
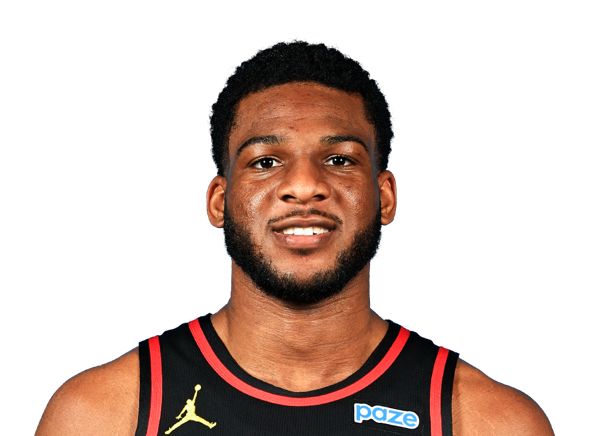 Zuby EjioforF #20