Click a season to open this player’s full game log, splits and advanced stats for that year; click a team to open its page. A dash means no NBA games were recorded.
03 / EVERY CATEGORY THE PROVIDER REPORTS
Full statistical breakdown
Regular season 2026-27
Defensive
Metric
Total
NBA rank
Blocks
4
Tied-157th
Defensive Rebounds
43
Tied-103rd
Steals
12
Tied-89th
Defensive Rebound Rate
0.0
—
Defensive Rebounds Per Game
3.1
Tied-128th
Blocks Per Game
0.3
Tied-165th
Steals Per Game
0.9
115th
Defensive Rebounds Per 48
5.7
4,944th
Blocks Per 48
0.5
7,536th
Steals Per 48
1.6
4,272nd
General
Metric
Total
NBA rank
Disqualifications
0
Tied-21st
Flagrant Fouls
0
Tied-22nd
Fouls
23
Tied-176th
Player Efficiency Rating
14.54
149th
Rebound Rate
0.0
—
Ejections
0
Tied-7th
Technical Fouls
0
Tied-101st
Rebounds
51
—
Value Over Replacement Player
0.0
—
Minutes
359
Tied-1st
Minutes Per Game
25.6
—
Rating
22.8
Tied-39th
Plus-Minus
+21
Tied-1st
Rebounds Per Game
3.6
Tied-148th
Fouls Per Game
1.6
213th
Flagrant Fouls Per Game
0.0
Tied-19th
Technical Fouls Per Game
0.0
Tied-82nd
Ejections Per Game
0.0
Tied-6th
Disqualifications Per Game
0.0
Tied-20th
Assist To Turnover Ratio
1.7
—
Steal To Foul Ratio
0.5
—
Block To Foul Ratio
0.2
—
Team Rebounds Per Game
0.0
—
Rebounds
51
—
Total Technical Fouls
0
—
Assist To Turnover Ratio
0.0
—
Steal To Turnover Ratio
0.6
—
Rebounds Per 48 Minutes
6.8
—
Fouls Per 48 Minutes
3.1
8,448th
Flagrant Fouls Per 48 Minutes
0.0
1,056th
Technical Fouls Per 48 Minutes
0.0
4,848th
Ejections Per 48 Minutes
0.0
336th
Disqualifications Per 48 Minutes
0.0
1,008th
R/40
5.7
—
Games Played
14
14th
Games Started
0
Tied-257th
Double Double
0
Tied-119th
Triple Double
0
Tied-12th
Offensive
Metric
Total
NBA rank
Assists
35
Tied-102nd
Effective Field Goal Percentage
57.3
—
Field Goals
75/164
—
Field Goals Attempted
164
60th
Field Goals Made
75
Tied-59th
Field Goal Percentage
45.7
74th
Free Throws
7/11
—
Free Throw Percentage
63.6
Tied-241st
Free Throws Attempted
11
Tied-250th
Free Throws Made
7
Tied-260th
Offensive Rebounds
8
Tied-213th
Points
195
70th
Turnovers
21
Tied-95th
3-Point Field Goal Percentage
39.2
87th
3-Point Field Goals Attempted
97
Tied-13th
3-Point Field Goals Made
38
Tied-13th
True Shooting Percentage
57.7
—
Total Turnovers
21
—
Assist Ratio
15.6
—
Points in the Paint
0
Tied-1st
Offensive Rebound Rate
0.0
—
Turnover Ratio
9.3
—
Brick Index
0.00
—
Usage Rate
0.0
—
Average Field Goals Made
5.4
75th
Average Field Goals Attempted
11.7
387th
Average 3-Point Field Goals Made
2.7
24th
Average 3-Point Field Goals Attempted
6.9
30th
Average Free Throws Made
0.5
—
Average Free Throws Attempted
0.8
Tied-233rd
Points Per Game
13.9
84th
Offensive Rebounds Per Game
0.6
Tied-214th
Assists Per Game
2.5
Tied-111th
Turnovers Per Game
1.5
107th
Offensive Rebound Percentage
0.1
—
Estimated Possessions
181.4
—
Estimated Possessions Per Game
13.0
—
Points Per Estimated Possession
1.1
—
Team Turnovers Per Game
0.0
—
Total Turnovers Per Game
1.5
—
3-Point Field Goal Percentage
39.2
73rd
2-Point Field Goals Made
37.0
Tied-46th
2-Point Field Goals Attempted
67.0
73rd
2-Point Field Goals Made per Game
2.6
—
2-Point Field Goals Attempted per Game
4.8
—
2-Point Field Goal Percentage
55.2
74th
Shooting Efficiency
0.57
—
Scoring Efficiency
1.189
—
Fieldgoals Made Per 48
10.0
2,832nd
Fieldgoals Attempted Per 48
21.9
Tied-2,880th
3-Point Fieldgoals Made Per 48
5.1
624th
3-Point Fieldgoals Attempted Per 48
13.0
624th
Freethrows Made Per 48
0.9
12,480th
Freethrows Attempted Per 48
1.5
12,000th
Points Scored Per 48
26.1
Tied-3,360th
Offensive Rebounds Per 48
1.1
10,224th
Assists Per 48
4.7
4,896th
Turnovers
2.8
4,560th
P/40
21.7
—
A/40
3.9
—
04 / EFFICIENCY, SHOOTING PROFILE, PER-36
Advanced metrics
True shooting %57.7%
Effective FG %57.7%
2-point FG %56.3%
3-point attempt rate59.0%
Free throw rate6.8%
Points per shot attempt1.19
% of points from 3s58.3%
Assist-to-turnover1.67
Points per 36 min19.5
Rebounds per 36 min5.1
Assists per 36 min3.5
Steals per 36 min1.27
Blocks per 36 min0.42
Turnovers per 36 min2.11
Stocks (STL + BLK) per game1.20
Pts + Reb + Ast per game20.0
Efficiency (EFF) per game13.1
Game Score per game (Hollinger)9.8
Minutes per game25.6
Calculated by BallersCulture from the supplied 2026-27 box-score totals using standard formulas (hover a tile to see the formula). Tracking-based metrics such as BPM, VORP, on/off and RAPTOR are not available from this data source.
05 / 14 GAMES IN 2026-27
Game log: Regular season
Date
Opp
Result
MIN
FG
FG%
3PT
3P%
FT
FT%
REB
AST
BLK
STL
PF
TO
PTS
Nov 16
@ MIL
W 113-106
24
3-7
42.9
1-5
20.0
0-0
0.0
3
3
0
1
1
4
7
Nov 14
@ CHI
L 125-117 OT
26
4-10
40.0
1-6
16.7
0-0
0.0
4
3
0
0
1
1
9
Nov 10
vs LAL
L 124-114
23
5-11
45.5
4-7
57.1
1-1
100.0
3
3
0
0
1
3
15
Nov 8
vs BKN
W 124-121
26
7-19
36.8
5-13
38.5
1-2
50.0
4
6
0
1
1
0
20
Nov 7
vs WSH
W 139-132
29
8-12
66.7
3-7
42.9
0-0
0.0
4
3
0
0
1
2
19
Nov 5
@ WSH
W 120-105
29
6-14
42.9
3-7
42.9
0-0
0.0
4
2
1
2
1
2
15
Nov 3
@ IND
W 108-104
24
3-12
25.0
1-6
16.7
0-1
0.0
3
2
0
1
2
2
7
Nov 1
@ NO
L 121-99
23
4-11
36.4
2-7
28.6
0-0
0.0
2
1
1
1
2
2
10
Oct 30
vs CLE
W 114-111
24
8-14
57.1
4-7
57.1
0-0
0.0
7
3
1
0
0
1
20
Oct 29
vs MIA
L 129-117
24
4-11
36.4
2-7
28.6
0-0
0.0
4
3
0
0
3
1
10
Oct 27
@ HOU
L 120-110
27
5-12
41.7
2-6
33.3
0-0
0.0
4
3
0
1
3
0
12
Oct 25
vs HOU
L 121-114
29
6-13
46.2
4-9
44.4
0-0
0.0
5
2
1
1
2
0
16
Oct 24
@ CHA
W 128-81
22
7-9
77.8
3-5
60.0
2-4
50.0
1
1
0
2
1
1
19
Oct 22
@ ORL
W 132-125
32
5-9
55.6
3-5
60.0
3-3
100.0
3
0
0
2
4
2
16
06 / 2026-27 HOME / AWAY, RESULTS, MONTHS AND OPPONENTS
Splits
split
Split
GP
MIN
FG
FG%
3PT
3P%
FT
FT%
OR
DR
REB
AST
BLK
STL
PF
TO
PTS
All Splits
14
25.6
5.4-11.7
45.7
2.7-6.9
39.2
0.5-0.8
63.6
0.6
3.1
3.6
2.5
0.3
0.9
1.6
1.5
13.9
Home
6
25.7
6.3-13.3
47.5
3.7-8.3
44.0
0.3-0.5
66.7
1.2
3.3
4.5
3.3
0.3
0.3
1.3
1.2
16.7
Road
8
25.6
4.6-10.5
44.0
2.0-5.9
34.0
0.6-1.0
62.5
0.1
2.9
3.0
1.9
0.3
1.3
1.9
1.8
11.9
vs. Division
5
27.0
6.0-11.0
54.5
2.8-6.2
45.2
1.0-1.4
71.4
0.4
2.8
3.2
1.8
0.2
1.2
2.0
1.6
15.8
vs. Conference
10
25.8
5.5-11.7
47.0
2.6-6.8
38.2
0.6-1.0
60.0
0.5
3.2
3.7
2.6
0.2
0.9
1.5
1.6
14.2
3+ Days Rest
2
28.5
4.5-9.5
47.4
2.0-5.5
36.4
1.5-1.5
100.0
0.5
3.0
3.5
1.5
0.0
1.0
2.5
1.5
12.5
Month
Split
GP
MIN
FG
FG%
3PT
3P%
FT
FT%
OR
DR
REB
AST
BLK
STL
PF
TO
PTS
October
7
25.6
5.6-11.3
49.4
2.9-6.6
43.5
0.7-1.0
71.4
0.6
3.1
3.7
1.9
0.4
1.0
2.1
1.0
14.7
November
7
25.7
5.1-12.1
42.4
2.6-7.3
35.3
0.3-0.6
50.0
0.6
3.0
3.6
3.1
0.1
0.7
1.1
2.0
13.1
Pre All-Star
14
25.6
5.4-11.7
45.7
2.7-6.9
39.2
0.5-0.8
63.6
0.6
3.1
3.6
2.5
0.3
0.9
1.6
1.5
13.9
Result
Split
GP
MIN
FG
FG%
3PT
3P%
FT
FT%
OR
DR
REB
AST
BLK
STL
PF
TO
PTS
Wins
8
26.0
5.9-12.0
49.0
2.9-6.9
41.8
0.8-1.3
60.0
0.6
3.0
3.6
2.5
0.3
1.1
1.4
1.8
15.4
Losses
6
25.0
4.7-11.3
41.2
2.5-7.0
35.7
0.2-0.2
100.0
0.5
3.2
3.7
2.5
0.3
0.5
2.0
1.2
12.0
Day
Split
GP
MIN
FG
FG%
3PT
3P%
FT
FT%
OR
DR
REB
AST
BLK
STL
PF
TO
PTS
Monday
3
24.3
4.3-11.7
37.1
2.3-6.3
36.8
0.3-0.7
50.0
0.3
3.0
3.3
2.7
0.0
0.7
2.0
1.7
11.3
Wednesday
3
28.3
5.0-11.3
44.1
2.7-6.3
42.1
1.0-1.0
100.0
0.3
3.3
3.7
1.7
0.3
1.3
2.7
1.7
13.7
Thursday
1
24.0
8.0-14.0
57.1
4.0-7.0
57.1
0.0-0.0
0.0
1.0
6.0
7.0
3.0
1.0
0.0
0.0
1.0
20.0
Friday
3
25.3
6.3-10.3
61.3
2.3-6.0
38.9
0.7-1.3
50.0
0.3
2.7
3.0
2.3
0.0
0.7
1.0
1.3
15.7
Saturday
3
26.0
5.7-14.3
39.5
3.7-9.7
37.9
0.3-0.7
50.0
1.3
2.3
3.7
3.0
0.7
1.0
1.7
0.7
15.3
Sunday
1
24.0
3.0-7.0
42.9
1.0-5.0
20.0
0.0-0.0
0.0
0.0
3.0
3.0
3.0
0.0
1.0
1.0
4.0
7.0
Opponent
Split
GP
MIN
FG
FG%
3PT
3P%
FT
FT%
OR
DR
REB
AST
BLK
STL
PF
TO
PTS
Brooklyn Nets
1
26.0
7.0-19.0
36.8
5.0-13.0
38.5
1.0-2.0
50.0
2.0
2.0
4.0
6.0
0.0
1.0
1.0
0.0
20.0
Charlotte Hornets
1
22.0
7.0-9.0
77.8
3.0-5.0
60.0
2.0-4.0
50.0
0.0
1.0
1.0
1.0
0.0
2.0
1.0
1.0
19.0
Chicago Bulls
1
26.0
4.0-10.0
40.0
1.0-6.0
16.7
0.0-0.0
0.0
0.0
4.0
4.0
3.0
0.0
0.0
1.0
1.0
9.0
Cleveland Cavaliers
1
24.0
8.0-14.0
57.1
4.0-7.0
57.1
0.0-0.0
0.0
1.0
6.0
7.0
3.0
1.0
0.0
0.0
1.0
20.0
Houston Rockets
2
27.5
5.5-12.5
44.0
3.0-7.5
40.0
0.0-0.0
0.0
1.0
3.5
4.5
2.5
0.5
1.0
2.5
0.0
14.0
Indiana Pacers
1
24.0
3.0-12.0
25.0
1.0-6.0
16.7
0.0-1.0
0.0
0.0
3.0
3.0
2.0
0.0
1.0
2.0
2.0
7.0
Los Angeles Lakers
1
23.0
5.0-11.0
45.5
4.0-7.0
57.1
1.0-1.0
100.0
1.0
2.0
3.0
3.0
0.0
0.0
1.0
3.0
15.0
Miami Heat
1
24.0
4.0-11.0
36.4
2.0-7.0
28.6
0.0-0.0
0.0
0.0
4.0
4.0
3.0
0.0
0.0
3.0
1.0
10.0
Milwaukee Bucks
1
24.0
3.0-7.0
42.9
1.0-5.0
20.0
0.0-0.0
0.0
0.0
3.0
3.0
3.0
0.0
1.0
1.0
4.0
7.0
New Orleans Pelicans
1
23.0
4.0-11.0
36.4
2.0-7.0
28.6
0.0-0.0
0.0
0.0
2.0
2.0
1.0
1.0
1.0
2.0
2.0
10.0
Orlando Magic
1
32.0
5.0-9.0
55.6
3.0-5.0
60.0
3.0-3.0
100.0
1.0
2.0
3.0
0.0
0.0
2.0
4.0
2.0
16.0
Washington Wizards
2
29.0
7.0-13.0
53.8
3.0-7.0
42.9
0.0-0.0
0.0
0.5
3.5
4.0
2.5
0.5
1.0
1.0
2.0
17.0
07 / SEASON-BY-SEASON HISTORY
Career statistics
Regular Season Averages
Season
Team
GP
GS
MIN
FG
FG%
3PT
3P%
FT
FT%
OR
DR
REB
AST
BLK
STL
PF
TO
PTS
2021-22
Oklahoma City Thunder
50
35
24.2
3.1-6.7
46.3
0.8-2.8
30.4
1.2-1.7
72.9
1.0
2.5
3.6
1.4
0.2
0.6
1.9
1.1
8.3
2022-23
Oklahoma City Thunder
70
14
18.5
2.7-5.2
51.2
0.7-1.7
39.3
0.8-1.0
83.1
1.0
2.0
3.0
1.1
0.2
0.6
1.6
0.8
6.8
2023-24
Oklahoma City Thunder
78
4
15.7
2.7-4.8
56.2
0.8-1.6
49.2
0.7-0.9
78.9
0.8
1.6
2.4
1.1
0.2
0.7
1.2
0.7
6.9
2024-25
Oklahoma City Thunder
76
26
22.9
4.7-9.6
48.8
1.7-4.5
38.3
1.0-1.2
83.1
1.1
2.8
3.9
1.8
0.2
0.8
1.3
0.9
12.0
2025-26
Oklahoma City Thunder
65
21
21.8
3.6-8.2
43.1
1.5-4.2
35.6
0.8-1.1
73.6
0.6
2.4
3.1
1.7
0.4
0.9
1.3
1.2
9.4
2026-27
Atlanta Hawks
14
0
25.6
5.4-11.7
45.7
2.7-6.9
39.2
0.5-0.8
63.6
0.6
3.1
3.6
2.5
0.3
0.9
1.6
1.5
13.9
Career
—
353
100
20.5
3.4-7.1
48.5
1.2-3.1
38.1
0.9-1.1
77.9
0.9
2.3
3.2
1.5
0.3
0.7
1.4
1.0
8.9
Regular Season Totals
Season
Team
FG
FG%
3PT
3P%
FT
FT%
OR
DR
REB
AST
BLK
STL
PF
TO
PTS
2021-22
Oklahoma City Thunder
156-337
46.3
42-138
30.4
62-85
72.9
51
127
178
68
10
30
93
54
416
2022-23
Oklahoma City Thunder
186-363
51.2
48-122
39.3
59-71
83.1
68
143
211
80
15
39
110
56
479
2023-24
Oklahoma City Thunder
212-377
56.2
62-126
49.2
56-71
78.9
60
126
186
86
19
56
91
56
542
2024-25
Oklahoma City Thunder
355-728
48.8
130-339
38.3
74-89
83.1
81
214
295
134
18
60
101
69
914
2025-26
Oklahoma City Thunder
231-536
43.1
96-270
35.6
53-72
73.6
41
158
199
109
28
60
83
81
611
2026-27
Atlanta Hawks
75-164
45.7
38-97
39.2
7-11
63.6
8
43
51
35
4
12
23
21
195
Career
—
1215-2505
48.5
416-1092
38.1
311-399
77.9
309
811
1120
512
94
257
501
337
3157
Regular Season Misc Totals
Season
Team
DD2
TD3
DQ
EJECT
TECH
FLAG
AST/TO
STL/TO
SC-EFF
SH-EFF
2021-22
Oklahoma City Thunder
0
0
0
0
0
0
1.3
0.6
1.234
0.53
2022-23
Oklahoma City Thunder
1
0
0
0
0
0
1.4
0.7
1.320
0.58
2023-24
Oklahoma City Thunder
0
0
0
0
0
0
1.5
1.0
1.438
0.64
2024-25
Oklahoma City Thunder
2
0
0
0
1
0
1.9
0.9
1.255
0.58
2025-26
Oklahoma City Thunder
0
0
0
0
0
0
1.3
0.7
1.140
0.52
2026-27
Atlanta Hawks
0
0
0
0
0
0
1.7
0.6
1.189
0.57
Career
—
3
0
0
0
1
0
1.5
0.8
1.260
0.57
Scoring, rebounding and assist trend
08 / SHOT CHART AND ZONE SHOOTING
Shot profile
Shot-location data is not connected. Add a BALLDONTLIE GOAT-tier NBA API key in NBA Players → Settings to enable shot charts and zone shooting.
LATEST UPDATEWiggins accumulated 20 points (7-19 FG, 5-13 3Pt, 1-2 FT), six assists, four rebounds and one steal over 26 minutes during Saturday's 124-121 victory over the Nets.
Wiggins didn't deliver his most efficient shooting performance but still provided a major spark off Atlanta's bench. The 27-year-old led the second unit in scoring, tying his season-high mark in points. Additionally, he dished out a season-best six assists. In four appearances so far this month, Wiggins has averaged 15.3 points, 3.8 rebounds, 3.3 assists and 1.0 steals across 27.0 minutes per tilt.




 Asa NewellF #14
 Cameron CorhenF #32
 CJ McCollumG #3
 Corey KispertF #24
 Dorian Finney-SmithF #8
 Dyson DanielsG #5
 Gabe VincentG #4
 Giorgi BezhanishviliF
 Henri VeesaarC #13
 Isaac McKneelyG #15
 Jalen JohnsonF #1
 Jalen WilsonF #22
 Jock LandaleC #31
 Keaton WallaceG #2
 Keon JohnsonG
 Keshon GilbertG #00
 Keyshawn BryantF
 Kingston FlemingsG #4
 Kobe JohnsonG #12
 Lamont ButlerG
 Luguentz DortG
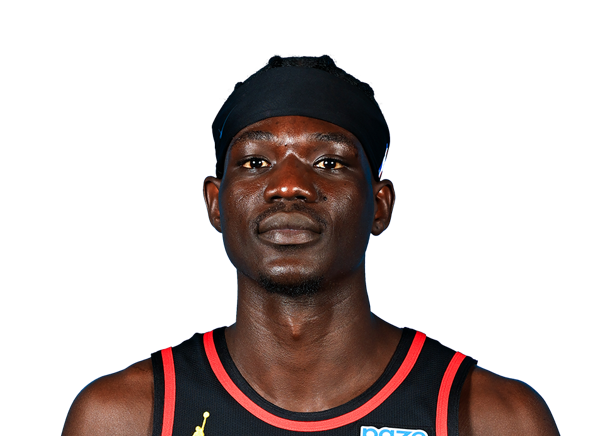 Mouhamed GueyeF #18
 Nickeil Alexander-WalkerG #7
 Onyeka OkongwuF #17
 RayJ DennisG #10
 Will BakerC #9
 Zuby EjioforF #20