Click a season to open this player’s full game log, splits and advanced stats for that year; click a team to open its page. A dash means no NBA games were recorded.
03 / EVERY CATEGORY THE PROVIDER REPORTS
Full statistical breakdown
Regular season 2026-27
Defensive
Metric
Total
NBA rank
Blocks
0
Tied-376th
Defensive Rebounds
2
Tied-408th
Steals
0
Tied-405th
Defensive Rebound Rate
0.0
—
Defensive Rebounds Per Game
0.7
—
Blocks Per Game
0.0
—
Steals Per Game
0.0
—
Defensive Rebounds Per 48
7.4
2,797th
Blocks Per 48
0.0
2,578th
Steals Per 48
0.0
2,777th
General
Metric
Total
NBA rank
Disqualifications
0
Tied-22nd
Flagrant Fouls
0
Tied-24th
Fouls
0
Tied-452nd
Player Efficiency Rating
12.56
—
Rebound Rate
0.0
—
Ejections
0
Tied-7th
Technical Fouls
0
Tied-104th
Rebounds
3
—
Value Over Replacement Player
0.0
—
Minutes
13
Tied-7th
Minutes Per Game
4.3
—
Rating
2.5
Tied-782nd
Plus-Minus
-5
Tied-1st
Rebounds Per Game
1.0
—
Fouls Per Game
0.0
—
Flagrant Fouls Per Game
0.0
—
Technical Fouls Per Game
0.0
—
Ejections Per Game
0.0
—
Disqualifications Per Game
0.0
—
Assist To Turnover Ratio
INF
—
Steal To Foul Ratio
0.0
—
Block To Foul Ratio
0.0
—
Team Rebounds Per Game
0.0
—
Rebounds
3
—
Total Technical Fouls
0
—
Assist To Turnover Ratio
0.0
—
Steal To Turnover Ratio
0.0
—
Rebounds Per 48 Minutes
11.1
—
Fouls Per 48 Minutes
0.0
3,099th
Flagrant Fouls Per 48 Minutes
0.0
164th
Technical Fouls Per 48 Minutes
0.0
713th
Ejections Per 48 Minutes
0.0
48th
Disqualifications Per 48 Minutes
0.0
150th
R/40
9.2
—
Games Played
3
3rd
Games Started
0
Tied-258th
Double Double
0
Tied-121st
Triple Double
0
Tied-13th
Offensive
Metric
Total
NBA rank
Assists
1
Tied-408th
Effective Field Goal Percentage
100.0
—
Field Goals
1/1
—
Field Goals Attempted
1
Tied-455th
Field Goals Made
1
Tied-435th
Field Goal Percentage
100.0
—
Free Throws
0/0
—
Free Throw Percentage
0.0
—
Free Throws Attempted
0
Tied-422nd
Free Throws Made
0
Tied-416th
Offensive Rebounds
1
Tied-392nd
Points
2
Tied-444th
Turnovers
0
Tied-438th
3-Point Field Goal Percentage
0.0
—
3-Point Field Goals Attempted
0
Tied-421st
3-Point Field Goals Made
0
Tied-379th
True Shooting Percentage
100.0
—
Total Turnovers
0
—
Assist Ratio
50.0
—
Points in the Paint
0
Tied-1st
Offensive Rebound Rate
0.0
—
Turnover Ratio
0.0
—
Brick Index
0.00
—
Usage Rate
0.0
—
Average Field Goals Made
0.3
—
Average Field Goals Attempted
0.3
—
Average 3-Point Field Goals Made
0.0
—
Average 3-Point Field Goals Attempted
0.0
—
Average Free Throws Made
0.0
—
Average Free Throws Attempted
0.0
—
Points Per Game
0.7
—
Offensive Rebounds Per Game
0.3
—
Assists Per Game
0.3
—
Turnovers Per Game
0.0
—
Offensive Rebound Percentage
0.0
—
Estimated Possessions
0.0
—
Estimated Possessions Per Game
0.0
—
Points Per Estimated Possession
0.0
—
Team Turnovers Per Game
0.0
—
Total Turnovers Per Game
0.0
—
3-Point Field Goal Percentage
0.0
—
2-Point Field Goals Made
1.0
Tied-56th
2-Point Field Goals Attempted
1.0
Tied-34th
2-Point Field Goals Made per Game
0.3
—
2-Point Field Goals Attempted per Game
0.3
—
2-Point Field Goal Percentage
100.0
—
Shooting Efficiency
1.00
—
Scoring Efficiency
2.000
—
Fieldgoals Made Per 48
3.7
2,982nd
Fieldgoals Attempted Per 48
3.7
3,120th
3-Point Fieldgoals Made Per 48
0.0
2,598th
3-Point Fieldgoals Attempted Per 48
0.0
2,886th
Freethrows Made Per 48
0.0
2,852nd
Freethrows Attempted Per 48
0.0
2,893rd
Points Scored Per 48
7.4
3,044th
Offensive Rebounds Per 48
3.7
2,688th
Assists Per 48
3.7
2,797th
Turnovers
0.0
3,003rd
P/40
6.2
—
A/40
3.1
—
04 / EFFICIENCY, SHOOTING PROFILE, PER-36
Advanced metrics
True shooting %116.7%
Effective FG %100.0%
2-point FG %100.0%
3-point attempt rate0.0%
Free throw rate0.0%
Points per shot attempt2.33
% of points from 3s0.0%
Points per 36 min5.9
Rebounds per 36 min8.4
Assists per 36 min2.5
Steals per 36 min0.00
Blocks per 36 min0.00
Turnovers per 36 min0.00
Stocks (STL + BLK) per game0.00
Pts + Reb + Ast per game2.0
Efficiency (EFF) per game2.0
Game Score per game (Hollinger)1.2
Minutes per game4.3
Calculated by BallersCulture from the supplied 2026-27 box-score totals using standard formulas (hover a tile to see the formula). Tracking-based metrics such as BPM, VORP, on/off and RAPTOR are not available from this data source.
05 / 3 GAMES IN 2026-27
Game log: Regular season
Date
Opp
Result
MIN
FG
FG%
3PT
3P%
FT
FT%
REB
AST
BLK
STL
PF
TO
PTS
Nov 12
vs LAL
L 123-112
4
0-0
0.0
0-0
0.0
0-0
0.0
0
0
0
0
0
0
0
Nov 11
@ NY
L 117-85
4
0-0
0.0
0-0
0.0
0-0
0.0
2
1
0
0
0
0
0
Oct 29
vs HOU
L 132-100
5
1-1
100.0
0-0
0.0
0-0
0.0
1
0
0
0
0
0
2
06 / 2026-27 HOME / AWAY, RESULTS, MONTHS AND OPPONENTS
Splits
split
Split
GP
MIN
FG
FG%
3PT
3P%
FT
FT%
OR
DR
REB
AST
BLK
STL
PF
TO
PTS
All Splits
3
4.3
0.3-0.3
100.0
0.0-0.0
0.0
0.0-0.0
0.0
0.3
0.7
1.0
0.3
0.0
0.0
0.0
0.0
0.7
Home
2
4.5
0.5-0.5
100.0
0.0-0.0
0.0
0.0-0.0
0.0
0.5
0.0
0.5
0.0
0.0
0.0
0.0
0.0
1.0
Road
1
4.0
0.0-0.0
0.0
0.0-0.0
0.0
0.0-0.0
0.0
0.0
2.0
2.0
1.0
0.0
0.0
0.0
0.0
0.0
vs. Conference
1
4.0
0.0-0.0
0.0
0.0-0.0
0.0
0.0-0.0
0.0
0.0
2.0
2.0
1.0
0.0
0.0
0.0
0.0
0.0
3+ Days Rest
2
4.5
0.5-0.5
100.0
0.0-0.0
0.0
0.0-0.0
0.0
0.5
1.0
1.5
0.5
0.0
0.0
0.0
0.0
1.0
Month
Split
GP
MIN
FG
FG%
3PT
3P%
FT
FT%
OR
DR
REB
AST
BLK
STL
PF
TO
PTS
October
1
5.0
1.0-1.0
100.0
0.0-0.0
0.0
0.0-0.0
0.0
1.0
0.0
1.0
0.0
0.0
0.0
0.0
0.0
2.0
November
2
4.0
0.0-0.0
0.0
0.0-0.0
0.0
0.0-0.0
0.0
0.0
1.0
1.0
0.5
0.0
0.0
0.0
0.0
0.0
Pre All-Star
3
4.3
0.3-0.3
100.0
0.0-0.0
0.0
0.0-0.0
0.0
0.3
0.7
1.0
0.3
0.0
0.0
0.0
0.0
0.7
Result
Split
GP
MIN
FG
FG%
3PT
3P%
FT
FT%
OR
DR
REB
AST
BLK
STL
PF
TO
PTS
Losses
3
4.3
0.3-0.3
100.0
0.0-0.0
0.0
0.0-0.0
0.0
0.3
0.7
1.0
0.3
0.0
0.0
0.0
0.0
0.7
Day
Split
GP
MIN
FG
FG%
3PT
3P%
FT
FT%
OR
DR
REB
AST
BLK
STL
PF
TO
PTS
Tuesday
1
4.0
0.0-0.0
0.0
0.0-0.0
0.0
0.0-0.0
0.0
0.0
2.0
2.0
1.0
0.0
0.0
0.0
0.0
0.0
Wednesday
2
4.5
0.5-0.5
100.0
0.0-0.0
0.0
0.0-0.0
0.0
0.5
0.0
0.5
0.0
0.0
0.0
0.0
0.0
1.0
Opponent
Split
GP
MIN
FG
FG%
3PT
3P%
FT
FT%
OR
DR
REB
AST
BLK
STL
PF
TO
PTS
Houston Rockets
1
5.0
1.0-1.0
100.0
0.0-0.0
0.0
0.0-0.0
0.0
1.0
0.0
1.0
0.0
0.0
0.0
0.0
0.0
2.0
Los Angeles Lakers
1
4.0
0.0-0.0
0.0
0.0-0.0
0.0
0.0-0.0
0.0
0.0
0.0
0.0
0.0
0.0
0.0
0.0
0.0
0.0
New York Knicks
1
4.0
0.0-0.0
0.0
0.0-0.0
0.0
0.0-0.0
0.0
0.0
2.0
2.0
1.0
0.0
0.0
0.0
0.0
0.0
07 / SEASON-BY-SEASON HISTORY
Career statistics
Regular Season Averages
Season
Team
GP
GS
MIN
FG
FG%
3PT
3P%
FT
FT%
OR
DR
REB
AST
BLK
STL
PF
TO
PTS
2026-27
Milwaukee Bucks
3
0
4.3
0.3-0.3
100.0
0.0-0.0
0.0
0.0-0.0
0.0
0.3
0.7
1.0
0.3
0.0
0.0
0.0
0.0
0.7
Career
—
3
0
4.3
0.3-0.3
100.0
0.0-0.0
0.0
0.0-0.0
0.0
0.3
0.7
1.0
0.3
0.0
0.0
0.0
0.0
0.7
Regular Season Totals
Season
Team
FG
FG%
3PT
3P%
FT
FT%
OR
DR
REB
AST
BLK
STL
PF
TO
PTS
2026-27
Milwaukee Bucks
1-1
100.0
0-0
0.0
0-0
0.0
1
2
3
1
0
0
0
0
2
Career
—
1-1
100.0
0-0
0.0
0-0
0.0
1
2
3
1
0
0
0
0
2
Regular Season Misc Totals
Season
Team
DD2
TD3
DQ
EJECT
TECH
FLAG
AST/TO
STL/TO
SC-EFF
SH-EFF
2026-27
Milwaukee Bucks
0
0
0
0
0
0
INF
0.0
2.000
1.00
Career
—
0
0
0
0
0
0
INF
0.0
2.000
1.00
08 / SHOT CHART AND ZONE SHOOTING
Shot profile
Shot-location data is not connected. Add a BALLDONTLIE GOAT-tier NBA API key in NBA Players → Settings to enable shot charts and zone shooting.
LATEST UPDATEMilwaukee recalled Markovic from the G League's Wisconsin Herd on Sunday.
Markovic could have the opportunity to compete at the top level now that he has returned to the NBA side, although his involvement would be limited off the bench if he plays. He has tallied just two points and one rebound over five minutes of action for the Bucks this season. His role is much more consistent at the G League level with Wisconsin, where he racked up 24 points and eight rebounds across his first couple of appearances.




 AJ GreenG #20
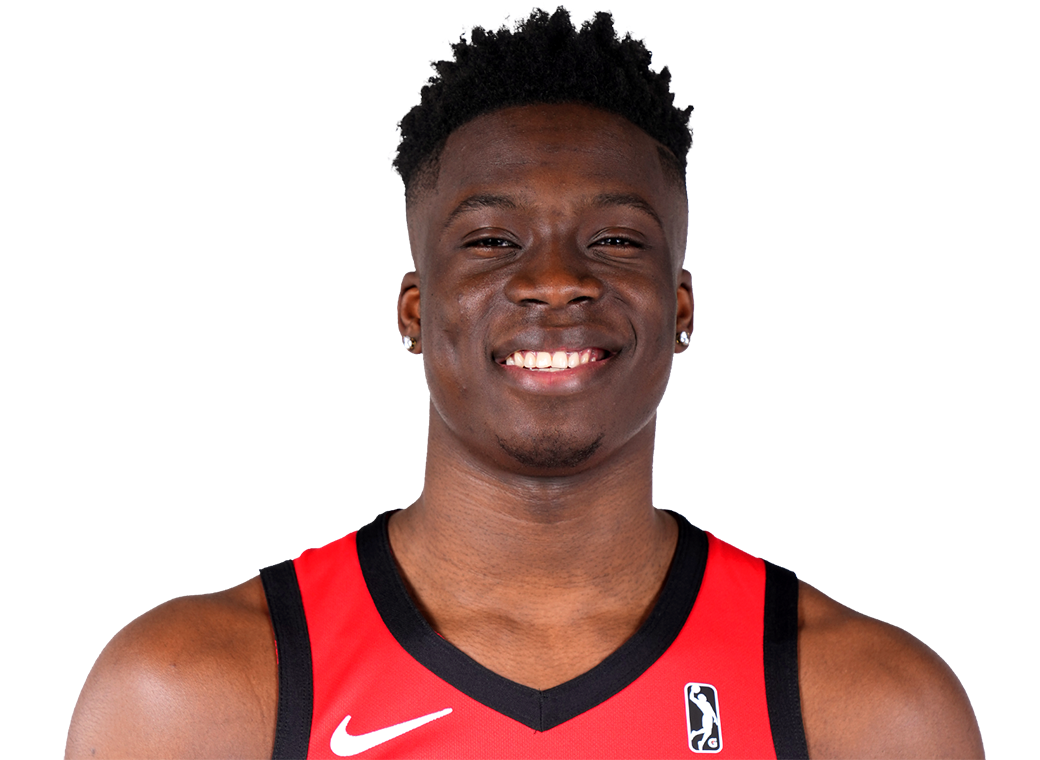 Alex AntetokounmpoF #29
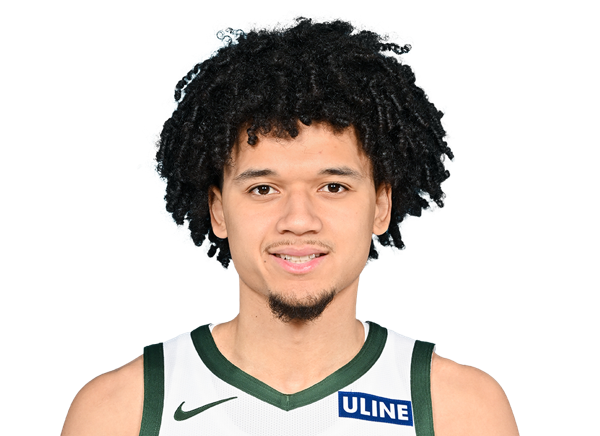 Brayden BurriesG
 Caris LeVertG #12
 Cormac RyanG #30
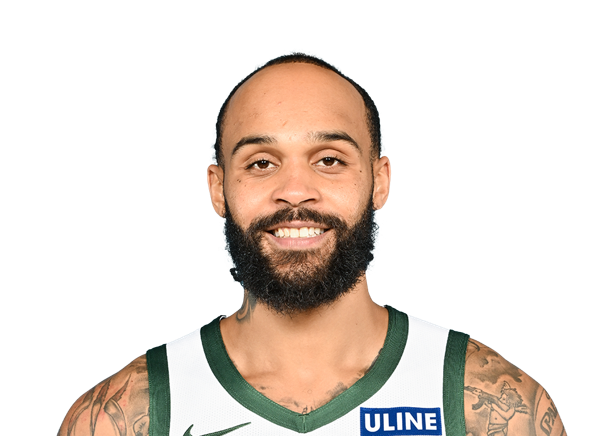 Gary Trent Jr.G #5
 Jaime Jaquez Jr.F #24
 Jake StephensC #88
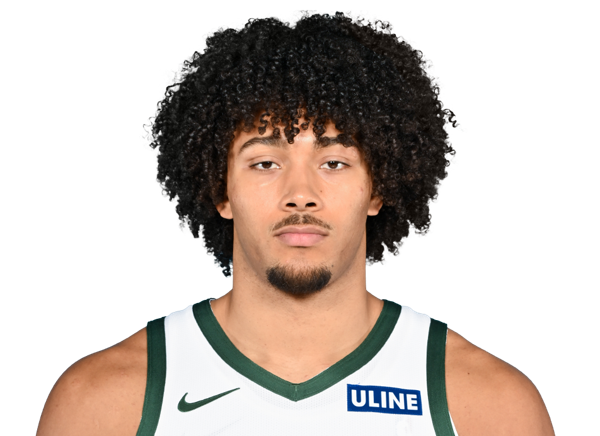 Jericho SimsC #00
 John Butler Jr.F #27
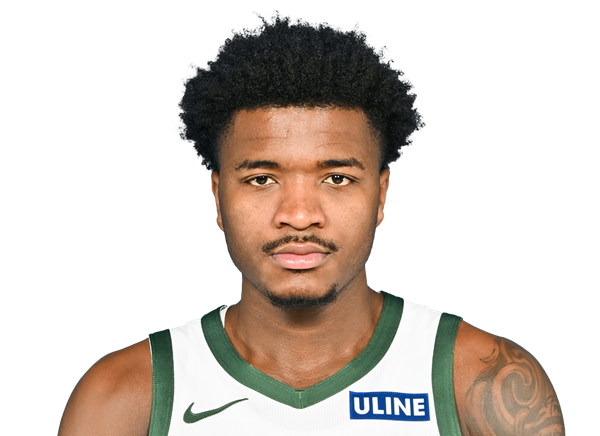 Kam JonesG #19
 Kasparas JakucionisG #25
 Kel’el WareC #9
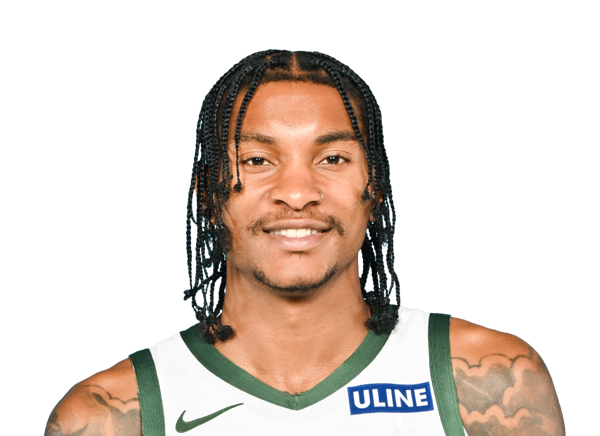 Kevin Porter Jr.G #7
 Kyle KuzmaF #18
 Myles TurnerC #3
 Nate AmentF #15
 Ousmane DiengF #21
 Pete NanceF #35
 Ryan RollinsG #13
 Thanasis AntetokounmpoF #43
 Tyler HerroG #11