Click a season to open this player’s full game log, splits and advanced stats for that year; click a team to open its page. A dash means no NBA games were recorded.
03 / EVERY CATEGORY THE PROVIDER REPORTS
Full statistical breakdown
Regular season 2026-27
Defensive
Metric
Total
NBA rank
Blocks
1
Tied-292nd
Defensive Rebounds
22
Tied-232nd
Steals
10
Tied-138th
Defensive Rebound Rate
0.0
—
Defensive Rebounds Per Game
1.7
Tied-225th
Blocks Per Game
0.1
Tied-255th
Steals Per Game
0.8
142nd
Defensive Rebounds Per 48
4.4
3,712th
Blocks Per 48
0.2
4,672nd
Steals Per 48
2.0
2,208th
General
Metric
Total
NBA rank
Disqualifications
0
Tied-22nd
Flagrant Fouls
0
Tied-24th
Fouls
30
Tied-114th
Player Efficiency Rating
13.63
163rd
Rebound Rate
0.0
—
Ejections
0
Tied-7th
Technical Fouls
0
Tied-104th
Rebounds
32
—
Value Over Replacement Player
10.1
—
Minutes
239
Tied-3rd
Minutes Per Game
18.4
—
Rating
15.4
Tied-84th
Plus-Minus
-99
Tied-1st
Rebounds Per Game
2.5
Tied-223rd
Fouls Per Game
2.3
Tied-117th
Flagrant Fouls Per Game
0.0
Tied-21st
Technical Fouls Per Game
0.0
Tied-84th
Ejections Per Game
0.0
Tied-6th
Disqualifications Per Game
0.0
Tied-21st
Assist To Turnover Ratio
2.0
—
Steal To Foul Ratio
0.3
—
Block To Foul Ratio
0.0
—
Team Rebounds Per Game
0.0
—
Rebounds
32
—
Total Technical Fouls
0
—
Assist To Turnover Ratio
0.0
—
Steal To Turnover Ratio
0.5
—
Rebounds Per 48 Minutes
6.4
—
Fouls Per 48 Minutes
6.0
1,824th
Flagrant Fouls Per 48 Minutes
0.0
384th
Technical Fouls Per 48 Minutes
0.0
1,664th
Ejections Per 48 Minutes
0.0
112th
Disqualifications Per 48 Minutes
0.0
352nd
R/40
5.4
—
Games Played
13
13th
Games Started
0
Tied-258th
Double Double
0
Tied-121st
Triple Double
0
Tied-13th
Offensive
Metric
Total
NBA rank
Assists
43
Tied-80th
Effective Field Goal Percentage
51.3
—
Field Goals
33/75
—
Field Goals Attempted
75
Tied-192nd
Field Goals Made
33
Tied-204th
Field Goal Percentage
44.0
—
Free Throws
27/31
—
Free Throw Percentage
87.1
57th
Free Throws Attempted
31
Tied-113th
Free Throws Made
27
Tied-95th
Offensive Rebounds
10
Tied-174th
Points
104
Tied-179th
Turnovers
22
Tied-93rd
3-Point Field Goal Percentage
27.5
Tied-219th
3-Point Field Goals Attempted
40
Tied-171st
3-Point Field Goals Made
11
Tied-202nd
True Shooting Percentage
58.7
—
Total Turnovers
22
—
Assist Ratio
28.0
—
Points in the Paint
0
Tied-1st
Offensive Rebound Rate
0.0
—
Turnover Ratio
14.3
—
Brick Index
0.00
—
Usage Rate
0.0
—
Average Field Goals Made
2.5
—
Average Field Goals Attempted
5.8
Tied-240th
Average 3-Point Field Goals Made
0.8
—
Average 3-Point Field Goals Attempted
3.1
Tied-169th
Average Free Throws Made
2.1
Tied-105th
Average Free Throws Attempted
2.4
114th
Points Per Game
8.0
183rd
Offensive Rebounds Per Game
0.8
Tied-170th
Assists Per Game
3.3
Tied-84th
Turnovers Per Game
1.7
101st
Offensive Rebound Percentage
0.2
—
Estimated Possessions
99.4
—
Estimated Possessions Per Game
7.6
—
Points Per Estimated Possession
1.0
—
Team Turnovers Per Game
0.0
—
Total Turnovers Per Game
1.7
—
3-Point Field Goal Percentage
27.5
—
2-Point Field Goals Made
22.0
Tied-2nd
2-Point Field Goals Attempted
35.0
Tied-21st
2-Point Field Goals Made per Game
1.7
—
2-Point Field Goals Attempted per Game
2.7
—
2-Point Field Goal Percentage
62.9
—
Shooting Efficiency
0.51
—
Scoring Efficiency
1.387
—
Fieldgoals Made Per 48
6.6
3,264th
Fieldgoals Attempted Per 48
15.1
3,072nd
3-Point Fieldgoals Made Per 48
2.2
3,232nd
3-Point Fieldgoals Attempted Per 48
8.0
2,736th
Freethrows Made Per 48
5.4
1,520th
Freethrows Attempted Per 48
6.2
1,808th
Points Scored Per 48
20.9
2,864th
Offensive Rebounds Per 48
2.0
2,784th
Assists Per 48
8.6
1,280th
Turnovers
4.4
1,488th
P/40
17.4
—
A/40
7.2
—
04 / EFFICIENCY, SHOOTING PROFILE, PER-36
Advanced metrics
True shooting %58.3%
Effective FG %50.0%
2-point FG %63.0%
3-point attempt rate53.4%
Free throw rate41.4%
Points per shot attempt1.38
% of points from 3s30.0%
Assist-to-turnover1.94
Points per 36 min15.7
Rebounds per 36 min4.9
Assists per 36 min6.5
Steals per 36 min1.57
Blocks per 36 min0.20
Turnovers per 36 min3.33
Stocks (STL + BLK) per game0.90
Pts + Reb + Ast per game13.8
Efficiency (EFF) per game9.4
Game Score per game (Hollinger)6.5
Minutes per game18.4
Calculated by BallersCulture from the supplied 2026-27 box-score totals using standard formulas (hover a tile to see the formula). Tracking-based metrics such as BPM, VORP, on/off and RAPTOR are not available from this data source.
05 / 13 GAMES IN 2026-27
Game log: Regular season
Date
Opp
Result
MIN
FG
FG%
3PT
3P%
FT
FT%
REB
AST
BLK
STL
PF
TO
PTS
Nov 16
vs ATL
L 113-106
26
9-16
56.3
4-10
40.0
3-3
100.0
5
5
0
3
2
2
25
Nov 12
vs LAL
L 123-112
4
1-2
50.0
0-0
0.0
2-2
100.0
2
0
0
1
0
0
4
Nov 11
@ NY
L 117-85
23
4-12
33.3
2-6
33.3
1-1
100.0
0
4
0
1
1
1
11
Nov 9
vs BOS
L 117-97
7
0-1
0.0
0-1
0.0
1-2
50.0
2
0
0
0
0
2
1
Nov 7
vs TOR
L 121-107
10
1-2
50.0
0-1
0.0
1-1
100.0
0
2
0
1
1
1
3
Nov 5
@ BOS
L 109-102
12
1-2
50.0
1-2
50.0
0-0
0.0
1
1
0
0
2
0
3
Nov 3
@ MIN
L 112-100
22
2-7
28.6
0-3
0.0
3-4
75.0
5
7
0
0
3
4
7
Nov 1
vs CLE
L 136-111
21
2-7
28.6
1-4
25.0
0-0
0.0
3
3
0
0
3
2
5
Oct 29
vs HOU
L 132-100
19
1-3
33.3
0-2
0.0
2-4
50.0
2
6
0
0
3
3
4
Oct 27
vs IND
W 110-102
21
2-4
50.0
1-3
33.3
2-2
100.0
4
5
0
0
3
2
7
Oct 25
@ PHI
L 127-116
25
4-8
50.0
0-3
0.0
4-4
100.0
3
2
0
2
4
3
12
Oct 24
vs CHI
L 132-125
23
2-4
50.0
1-2
50.0
2-2
100.0
2
5
0
2
3
1
7
Oct 22
@ WSH
L 128-116
26
4-7
57.1
1-3
33.3
6-6
100.0
3
3
1
0
5
1
15
06 / 2026-27 HOME / AWAY, RESULTS, MONTHS AND OPPONENTS
Splits
split
Split
GP
MIN
FG
FG%
3PT
3P%
FT
FT%
OR
DR
REB
AST
BLK
STL
PF
TO
PTS
All Splits
13
18.4
2.5-5.8
44.0
0.8-3.1
27.5
2.1-2.4
87.1
0.8
1.7
2.5
3.3
0.1
0.8
2.3
1.7
8.0
Home
8
16.4
2.3-4.9
46.2
0.9-2.9
30.4
1.6-2.0
81.3
1.0
1.5
2.5
3.3
0.0
0.9
1.9
1.6
7.0
Road
5
21.6
3.0-7.2
41.7
0.8-3.4
23.5
2.8-3.0
93.3
0.4
2.0
2.4
3.4
0.2
0.6
3.0
1.8
9.6
vs. Division
3
21.7
2.0-5.0
40.0
1.0-3.0
33.3
1.3-1.3
100.0
0.3
2.7
3.0
4.3
0.0
0.7
3.0
1.7
6.3
vs. Conference
10
19.4
2.9-6.3
46.0
1.1-3.5
31.4
2.0-2.1
95.2
0.8
1.5
2.3
3.0
0.1
0.9
2.4
1.5
8.9
3+ Days Rest
2
26.0
6.5-11.5
56.5
2.5-6.5
38.5
4.5-4.5
100.0
2.5
1.5
4.0
4.0
0.5
1.5
3.5
1.5
20.0
Month
Split
GP
MIN
FG
FG%
3PT
3P%
FT
FT%
OR
DR
REB
AST
BLK
STL
PF
TO
PTS
October
6
22.5
2.5-5.5
45.5
0.7-2.8
23.5
2.7-3.0
88.9
0.3
2.5
2.8
4.0
0.2
0.7
3.5
2.0
8.3
November
7
14.9
2.6-6.0
42.9
1.0-3.3
30.4
1.6-1.9
84.6
1.1
1.0
2.1
2.7
0.0
0.9
1.3
1.4
7.7
Pre All-Star
13
18.4
2.5-5.8
44.0
0.8-3.1
27.5
2.1-2.4
87.1
0.8
1.7
2.5
3.3
0.1
0.8
2.3
1.7
8.0
Result
Split
GP
MIN
FG
FG%
3PT
3P%
FT
FT%
OR
DR
REB
AST
BLK
STL
PF
TO
PTS
Wins
1
21.0
2.0-4.0
50.0
1.0-3.0
33.3
2.0-2.0
100.0
1.0
3.0
4.0
5.0
0.0
0.0
3.0
2.0
7.0
Losses
12
18.2
2.6-5.9
43.7
0.8-3.1
27.0
2.1-2.4
86.2
0.8
1.6
2.3
3.2
0.1
0.8
2.3
1.7
8.1
Day
Split
GP
MIN
FG
FG%
3PT
3P%
FT
FT%
OR
DR
REB
AST
BLK
STL
PF
TO
PTS
Monday
2
21.5
2.0-5.5
36.4
0.5-3.0
16.7
2.5-3.0
83.3
1.0
3.5
4.5
6.0
0.0
0.0
3.0
3.0
7.0
Tuesday
1
23.0
4.0-12.0
33.3
2.0-6.0
33.3
1.0-1.0
100.0
0.0
0.0
0.0
4.0
0.0
1.0
1.0
1.0
11.0
Wednesday
4
15.3
1.8-3.5
50.0
0.5-1.8
28.6
2.5-3.0
83.3
0.5
1.5
2.0
2.5
0.3
0.3
2.5
1.0
6.5
Friday
2
16.5
1.5-3.0
50.0
0.5-1.5
33.3
1.5-1.5
100.0
0.0
1.0
1.0
3.5
0.0
1.5
2.0
1.0
5.0
Saturday
2
23.0
3.0-7.5
40.0
0.5-3.5
14.3
2.0-2.0
100.0
0.0
3.0
3.0
2.5
0.0
1.0
3.5
2.5
8.5
Sunday
2
16.5
4.5-8.5
52.9
2.0-5.5
36.4
2.0-2.5
80.0
3.0
0.5
3.5
2.5
0.0
1.5
1.0
2.0
13.0
Opponent
Split
GP
MIN
FG
FG%
3PT
3P%
FT
FT%
OR
DR
REB
AST
BLK
STL
PF
TO
PTS
Atlanta Hawks
1
26.0
9.0-16.0
56.3
4.0-10.0
40.0
3.0-3.0
100.0
4.0
1.0
5.0
5.0
0.0
3.0
2.0
2.0
25.0
Boston Celtics
2
9.5
0.5-1.5
33.3
0.5-1.5
33.3
0.5-1.0
50.0
1.0
0.5
1.5
0.5
0.0
0.0
1.0
1.0
2.0
Chicago Bulls
1
23.0
2.0-4.0
50.0
1.0-2.0
50.0
2.0-2.0
100.0
0.0
2.0
2.0
5.0
0.0
2.0
3.0
1.0
7.0
Cleveland Cavaliers
1
21.0
2.0-7.0
28.6
1.0-4.0
25.0
0.0-0.0
0.0
0.0
3.0
3.0
3.0
0.0
0.0
3.0
2.0
5.0
Houston Rockets
1
19.0
1.0-3.0
33.3
0.0-2.0
0.0
2.0-4.0
50.0
0.0
2.0
2.0
6.0
0.0
0.0
3.0
3.0
4.0
Indiana Pacers
1
21.0
2.0-4.0
50.0
1.0-3.0
33.3
2.0-2.0
100.0
1.0
3.0
4.0
5.0
0.0
0.0
3.0
2.0
7.0
Los Angeles Lakers
1
4.0
1.0-2.0
50.0
0.0-0.0
0.0
2.0-2.0
100.0
1.0
1.0
2.0
0.0
0.0
1.0
0.0
0.0
4.0
Minnesota Timberwolves
1
22.0
2.0-7.0
28.6
0.0-3.0
0.0
3.0-4.0
75.0
1.0
4.0
5.0
7.0
0.0
0.0
3.0
4.0
7.0
New York Knicks
1
23.0
4.0-12.0
33.3
2.0-6.0
33.3
1.0-1.0
100.0
0.0
0.0
0.0
4.0
0.0
1.0
1.0
1.0
11.0
Philadelphia 76ers
1
25.0
4.0-8.0
50.0
0.0-3.0
0.0
4.0-4.0
100.0
0.0
3.0
3.0
2.0
0.0
2.0
4.0
3.0
12.0
Toronto Raptors
1
10.0
1.0-2.0
50.0
0.0-1.0
0.0
1.0-1.0
100.0
0.0
0.0
0.0
2.0
0.0
1.0
1.0
1.0
3.0
Washington Wizards
1
26.0
4.0-7.0
57.1
1.0-3.0
33.3
6.0-6.0
100.0
1.0
2.0
3.0
3.0
1.0
0.0
5.0
1.0
15.0
07 / SEASON-BY-SEASON HISTORY
Career statistics
Regular Season Averages
Season
Team
GP
GS
MIN
FG
FG%
3PT
3P%
FT
FT%
OR
DR
REB
AST
BLK
STL
PF
TO
PTS
2025-26
Miami Heat
53
12
17.8
1.9-4.5
42.9
1.2-2.9
42.3
1.1-1.2
87.9
0.8
1.8
2.6
2.6
0.1
0.6
1.9
0.9
6.2
2026-27
Milwaukee Bucks
13
0
18.4
2.5-5.8
44.0
0.8-3.1
27.5
2.1-2.4
87.1
0.8
1.7
2.5
3.3
0.1
0.8
2.3
1.7
8.0
Career
—
66
12
17.9
2.0-4.7
43.1
1.2-3.0
39.3
1.3-1.5
87.6
0.8
1.8
2.6
2.7
0.1
0.7
2.0
1.1
6.5
Regular Season Totals
Season
Team
FG
FG%
3PT
3P%
FT
FT%
OR
DR
REB
AST
BLK
STL
PF
TO
PTS
2025-26
Miami Heat
102-238
42.9
66-156
42.3
58-66
87.9
43
95
138
137
7
33
99
50
328
2026-27
Milwaukee Bucks
33-75
44.0
11-40
27.5
27-31
87.1
10
22
32
43
1
10
30
22
104
Career
—
135-313
43.1
77-196
39.3
85-97
87.6
53
117
170
180
8
43
129
72
432
Regular Season Misc Totals
Season
Team
DD2
TD3
DQ
EJECT
TECH
FLAG
AST/TO
STL/TO
SC-EFF
SH-EFF
2025-26
Miami Heat
0
0
0
0
0
0
2.7
0.7
1.378
0.57
2026-27
Milwaukee Bucks
0
0
0
0
0
0
2.0
0.5
1.387
0.51
Career
—
0
0
0
0
0
0
2.5
0.6
1.380
0.55
Scoring, rebounding and assist trend
08 / SHOT CHART AND ZONE SHOOTING
Shot profile
Shot-location data is not connected. Add a BALLDONTLIE GOAT-tier NBA API key in NBA Players → Settings to enable shot charts and zone shooting.
LATEST UPDATEJakucionis finished with 25 points (9-16 FG, 4-10 3Pt, 3-3 FT), five rebounds, five assists and three steals across 26 minutes off the bench during Sunday's 113-106 loss to Atlanta.
The 25 points led the Bucks on the night and were a career high for Jakucionis by a wide margin, shattering his previous best of 16 points. The second-year guard has had trouble finding consistent minutes when the roster is healthy. Sunday's opportunity came with Ryan Rollins (illness) unavailable, but this performance could earn him a bigger role. Jakucionis' usage has been curious anyway, considering he was viewed as a key part of the return from the Heat for Giannis Antetokounmpo.




 AJ GreenG #20
 Alex AntetokounmpoF #29
 Bogoljub MarkovicF #23
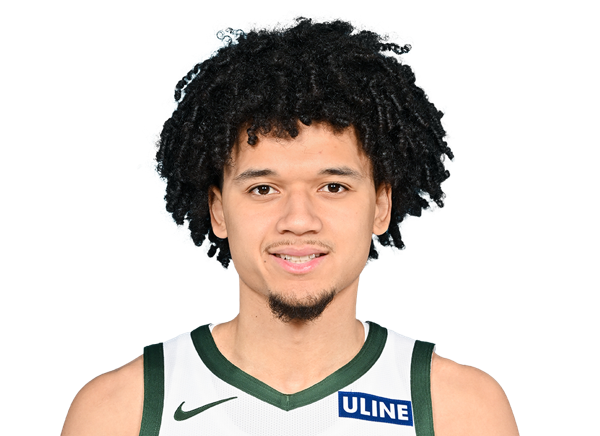 Brayden BurriesG
 Caris LeVertG #12
 Cormac RyanG #30
 Gary Trent Jr.G #5
 Jaime Jaquez Jr.F #24
 Jake StephensC #88
 Jericho SimsC #00
 John Butler Jr.F #27
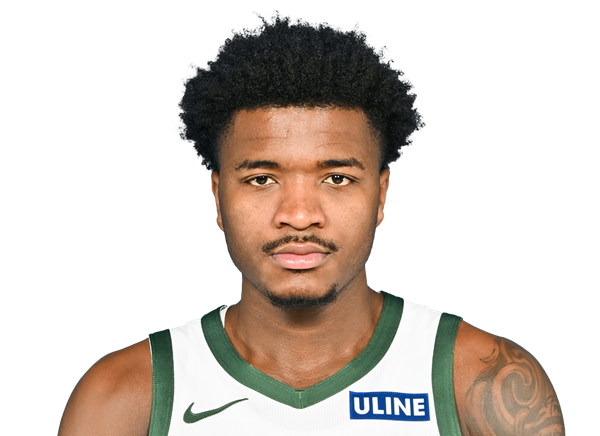 Kam JonesG #19
 Kel’el WareC #9
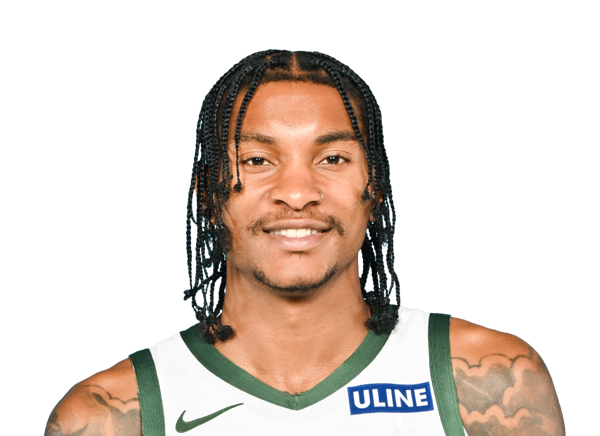 Kevin Porter Jr.G #7
 Kyle KuzmaF #18
 Myles TurnerC #3
 Nate AmentF #15
 Ousmane DiengF #21
 Pete NanceF #35
 Ryan RollinsG #13
 Thanasis AntetokounmpoF #43
 Tyler HerroG #11