


BALLERSCULTURE PLAYER PROFILE · 2026-27
Caris LeVert
Milwaukee Bucks · G • #12 • 6' 7" 205 lbs

01 / 2026-27 PER-GAME AVERAGES
Season snapshot
No regular-season 2026-27 statistics are recorded for this player. Career history is shown further down.
02 / EVERY SEASON SINCE 2022-23, SIDE BY SIDE
2022-23 to 2026-27
Per game
| Season | Team | GP | GS | MIN | PTS | REB | AST | STL | BLK | TO | FG% | 3P% | FT% |
|---|---|---|---|---|---|---|---|---|---|---|---|---|---|
| 2022-23 | Cleveland Cavaliers | 74 | 30 | 30.2 | 12.1 | 3.8 | 3.9 | 1.0 | 0.3 | 1.6 | 43.1 | 39.2 | 72.2 |
| 2023-24 | Cleveland Cavaliers | 68 | 10 | 28.8 | 14.0 | 4.1 | 5.1 | 1.1 | 0.5 | 1.7 | 42.1 | 32.5 | 76.6 |
| 2024-25 | Cleveland Cavaliers | 64 | 3 | 24.9 | 12.1 | 3.2 | 3.4 | 0.9 | 0.5 | 1.2 | 46.7 | 37.3 | 71.0 |
| 2025-26 | Detroit Pistons | 60 | 0 | 19.2 | 7.4 | 2.0 | 2.7 | 0.9 | 0.7 | 1.4 | 41.7 | 33.3 | 67.9 |
| 2026-27 | — | — | — | — | — | — | — | — | — | — | — | — | — |
Season totals
| Season | Team | GP | GS | MIN | PTS | REB | AST | STL | BLK | TO | FG% | 3P% | FT% |
|---|---|---|---|---|---|---|---|---|---|---|---|---|---|
| 2022-23 | Cleveland Cavaliers | — | — | — | 897 | 282 | 287 | 72 | 24 | 116 | 43.1 | 39.2 | 72.2 |
| 2023-24 | Cleveland Cavaliers | — | — | — | 952 | 280 | 346 | 76 | 34 | 117 | 42.1 | 32.5 | 76.6 |
| 2024-25 | Cleveland Cavaliers | — | — | — | 388 | 107 | 140 | 33 | 19 | 51 | 45.3 | 40.5 | 69.9 |
| 2025-26 | Detroit Pistons | — | — | — | 443 | 117 | 159 | 51 | 41 | 82 | 41.7 | 33.3 | 67.9 |
| 2026-27 | — | — | — | — | — | — | — | — | — | — | — | — | — |
Click a season to open this player’s full game log, splits and advanced stats for that year; click a team to open its page. A dash means no NBA games were recorded.
03 / SEASON-BY-SEASON HISTORY
Career statistics
Regular Season Averages
| Season | Team | GP | GS | MIN | FG | FG% | 3PT | 3P% | FT | FT% | OR | DR | REB | AST | BLK | STL | PF | TO | PTS |
|---|---|---|---|---|---|---|---|---|---|---|---|---|---|---|---|---|---|---|---|
| 2016-17 | Brooklyn Nets | 57 | 26 | 21.7 | 3.0-6.7 | 45.0 | 1.0-3.2 | 32.1 | 1.2-1.6 | 72.0 | 0.4 | 2.9 | 3.3 | 1.9 | 0.1 | 0.9 | 1.6 | 1.0 | 8.2 |
| 2017-18 | Brooklyn Nets | 71 | 10 | 26.3 | 4.5-10.4 | 43.5 | 1.2-3.5 | 34.7 | 1.9-2.6 | 71.1 | 0.7 | 2.9 | 3.7 | 4.2 | 0.3 | 1.2 | 2.2 | 2.2 | 12.1 |
| 2018-19 | Brooklyn Nets | 40 | 25 | 26.6 | 5.2-12.1 | 42.9 | 1.2-3.9 | 31.2 | 2.1-3.1 | 69.1 | 0.9 | 2.9 | 3.8 | 3.9 | 0.4 | 1.1 | 1.9 | 1.7 | 13.7 |
| 2019-20 | Brooklyn Nets | 45 | 31 | 29.6 | 6.9-16.3 | 42.5 | 1.8-4.9 | 36.4 | 3.1-4.4 | 71.1 | 1.1 | 3.1 | 4.2 | 4.4 | 0.2 | 1.2 | 1.8 | 2.6 | 18.7 |
| 2020-21 | Brooklyn Nets | 12 | 4 | 27.8 | 7.3-16.7 | 43.5 | 1.8-5.3 | 34.9 | 2.2-2.8 | 76.5 | 0.8 | 3.5 | 4.3 | 6.0 | 0.5 | 1.1 | 1.7 | 2.2 | 18.5 |
| 2020-21 | Indiana Pacers | 35 | 35 | 32.9 | 7.8-17.5 | 44.3 | 1.8-5.6 | 31.8 | 3.4-4.2 | 82.2 | 0.7 | 4.0 | 4.6 | 4.9 | 0.7 | 1.5 | 2.4 | 2.2 | 20.7 |
| 2020-21 | 2020 21 Totals | 47 | 39 | 31.6 | 7.6-17.3 | 44.1 | 1.8-5.5 | 32.6 | 3.1-3.8 | 81.1 | 0.7 | 3.9 | 4.6 | 5.2 | 0.6 | 1.4 | 2.2 | 2.2 | 20.2 |
| 2021-22 | Indiana Pacers | 39 | 39 | 31.1 | 7.1-15.9 | 44.7 | 1.6-4.8 | 32.3 | 2.8-3.7 | 76.0 | 0.8 | 3.1 | 3.8 | 4.4 | 0.5 | 0.9 | 2.3 | 1.9 | 18.7 |
| 2021-22 | Cleveland Cavaliers | 19 | 10 | 29.8 | 5.3-12.2 | 43.5 | 1.1-3.5 | 31.3 | 1.8-2.5 | 74.5 | 0.7 | 2.7 | 3.4 | 3.9 | 0.3 | 0.8 | 2.1 | 1.7 | 13.6 |
| 2021-22 | 2021 22 Totals | 58 | 49 | 30.7 | 6.5-14.7 | 44.4 | 1.4-4.4 | 32.0 | 2.5-3.3 | 75.6 | 0.7 | 2.9 | 3.7 | 4.3 | 0.4 | 0.9 | 2.3 | 1.9 | 17.0 |
| 2022-23 | Cleveland Cavaliers | 74 | 30 | 30.2 | 4.3-10.0 | 43.1 | 1.7-4.4 | 39.2 | 1.8-2.4 | 72.2 | 0.7 | 3.1 | 3.8 | 3.9 | 0.3 | 1.0 | 2.3 | 1.6 | 12.1 |
| 2023-24 | Cleveland Cavaliers | 68 | 10 | 28.8 | 5.1-12.1 | 42.1 | 1.6-4.9 | 32.5 | 2.3-3.0 | 76.6 | 0.6 | 3.5 | 4.1 | 5.1 | 0.5 | 1.1 | 1.8 | 1.7 | 14.0 |
| 2024-25 | Cleveland Cavaliers | 38 | 3 | 23.8 | 3.6-7.8 | 45.3 | 1.6-3.9 | 40.5 | 1.5-2.2 | 69.9 | 0.6 | 2.2 | 2.8 | 3.7 | 0.5 | 0.9 | 1.3 | 1.3 | 10.2 |
| 2024-25 | Atlanta Hawks | 26 | 0 | 26.6 | 5.6-11.6 | 48.2 | 1.8-5.2 | 33.8 | 2.0-2.8 | 72.2 | 0.7 | 3.0 | 3.7 | 2.9 | 0.5 | 0.9 | 2.0 | 1.0 | 14.9 |
| 2024-25 | 2024 25 Totals | 64 | 3 | 24.9 | 4.4-9.4 | 46.7 | 1.7-4.4 | 37.3 | 1.7-2.4 | 71.0 | 0.6 | 2.5 | 3.2 | 3.4 | 0.5 | 0.9 | 1.5 | 1.2 | 12.1 |
| 2025-26 | Detroit Pistons | 60 | 0 | 19.2 | 2.7-6.5 | 41.7 | 1.0-3.0 | 33.3 | 1.0-1.4 | 67.9 | 0.4 | 1.6 | 2.0 | 2.7 | 0.7 | 0.9 | 1.5 | 1.4 | 7.4 |
| Career | — | 584 | 223 | 26.9 | 4.9-11.2 | 43.6 | 1.4-4.2 | 34.4 | 2.0-2.7 | 73.3 | 0.7 | 2.9 | 3.6 | 3.9 | 0.4 | 1.0 | 1.9 | 1.7 | 13.2 |
Regular Season Totals
| Season | Team | FG | FG% | 3PT | 3P% | FT | FT% | OR | DR | REB | AST | BLK | STL | PF | TO | PTS |
|---|---|---|---|---|---|---|---|---|---|---|---|---|---|---|---|---|
| 2016-17 | Brooklyn Nets | 171-380 | 45.0 | 59-184 | 32.1 | 67-93 | 72.0 | 23 | 165 | 188 | 110 | 8 | 49 | 91 | 59 | 468 |
| 2017-18 | Brooklyn Nets | 320-735 | 43.5 | 85-245 | 34.7 | 133-187 | 71.1 | 53 | 207 | 260 | 299 | 22 | 82 | 159 | 153 | 858 |
| 2018-19 | Brooklyn Nets | 207-483 | 42.9 | 48-154 | 31.2 | 85-123 | 69.1 | 35 | 116 | 151 | 156 | 14 | 42 | 77 | 69 | 547 |
| 2019-20 | Brooklyn Nets | 311-732 | 42.5 | 80-220 | 36.4 | 140-197 | 71.1 | 49 | 140 | 189 | 199 | 10 | 53 | 81 | 118 | 842 |
| 2020-21 | Brooklyn Nets | 87-200 | 43.5 | 22-63 | 34.9 | 26-34 | 76.5 | 10 | 42 | 52 | 72 | 6 | 13 | 20 | 26 | 222 |
| 2020-21 | Indiana Pacers | 272-614 | 44.3 | 62-195 | 31.8 | 120-146 | 82.2 | 23 | 139 | 162 | 173 | 24 | 53 | 85 | 76 | 726 |
| 2020-21 | 2020 21 Totals | 359-814 | 44.1 | 84-258 | 32.6 | 146-180 | 81.1 | 33 | 181 | 214 | 245 | 30 | 66 | 105 | 102 | 948 |
| 2021-22 | Indiana Pacers | 278-622 | 44.7 | 61-189 | 32.3 | 111-146 | 76.0 | 30 | 120 | 150 | 173 | 18 | 35 | 91 | 75 | 728 |
| 2021-22 | Cleveland Cavaliers | 101-232 | 43.5 | 21-67 | 31.3 | 35-47 | 74.5 | 13 | 51 | 64 | 75 | 5 | 16 | 40 | 33 | 258 |
| 2021-22 | 2021 22 Totals | 379-854 | 44.4 | 82-256 | 32.0 | 146-193 | 75.6 | 43 | 171 | 214 | 248 | 23 | 51 | 131 | 108 | 986 |
| 2022-23 | Cleveland Cavaliers | 320-742 | 43.1 | 127-324 | 39.2 | 130-180 | 72.2 | 53 | 229 | 282 | 287 | 24 | 72 | 170 | 116 | 897 |
| 2023-24 | Cleveland Cavaliers | 345-820 | 42.1 | 108-332 | 32.5 | 154-201 | 76.6 | 39 | 241 | 280 | 346 | 34 | 76 | 121 | 117 | 952 |
| 2024-25 | Cleveland Cavaliers | 135-298 | 45.3 | 60-148 | 40.5 | 58-83 | 69.9 | 22 | 85 | 107 | 140 | 19 | 33 | 48 | 51 | 388 |
| 2024-25 | Atlanta Hawks | 145-301 | 48.2 | 46-136 | 33.8 | 52-72 | 72.2 | 19 | 77 | 96 | 75 | 14 | 24 | 51 | 25 | 388 |
| 2024-25 | 2024 25 Totals | 280-599 | 46.7 | 106-284 | 37.3 | 110-155 | 71.0 | 41 | 162 | 203 | 215 | 33 | 57 | 99 | 76 | 776 |
| 2025-26 | Detroit Pistons | 163-391 | 41.7 | 60-180 | 33.3 | 57-84 | 67.9 | 23 | 94 | 117 | 159 | 41 | 51 | 91 | 82 | 443 |
| Career | — | 2855-6550 | 43.6 | 839-2437 | 34.4 | 1168-1593 | 73.3 | 392 | 1706 | 2098 | 2264 | 239 | 599 | 1125 | 1000 | 7717 |
Regular Season Misc Totals
| Season | Team | DD2 | TD3 | DQ | EJECT | TECH | FLAG | AST/TO | STL/TO | SC-EFF | SH-EFF |
|---|---|---|---|---|---|---|---|---|---|---|---|
| 2016-17 | Brooklyn Nets | 0 | 0 | 1 | 0 | 0 | 0 | 1.9 | 0.8 | 1.232 | 0.53 |
| 2017-18 | Brooklyn Nets | 3 | 0 | 0 | 0 | 0 | 0 | 2.0 | 0.5 | 1.167 | 0.49 |
| 2018-19 | Brooklyn Nets | 0 | 0 | 0 | 0 | 2 | 0 | 2.3 | 0.6 | 1.133 | 0.48 |
| 2019-20 | Brooklyn Nets | 2 | 1 | 0 | 0 | 0 | 0 | 1.7 | 0.4 | 1.150 | 0.48 |
| 2020-21 | Brooklyn Nets | 2 | 0 | 0 | 0 | 1 | 0 | 2.8 | 0.5 | 1.110 | 0.49 |
| 2020-21 | Indiana Pacers | 4 | 0 | 0 | 0 | 4 | 0 | 2.3 | 0.7 | 1.182 | 0.49 |
| 2020-21 | 2020 21 Totals | 6 | 0 | 0 | 0 | 5 | 0 | 2.4 | 0.6 | 1.165 | 0.49 |
| 2021-22 | Indiana Pacers | 1 | 0 | 1 | 0 | 0 | 0 | 2.3 | 0.5 | 1.170 | 0.50 |
| 2021-22 | Cleveland Cavaliers | 0 | 0 | 0 | 0 | 0 | 0 | 2.3 | 0.5 | 1.112 | 0.48 |
| 2021-22 | 2021 22 Totals | 1 | 0 | 1 | 0 | 0 | 0 | 2.3 | 0.5 | 1.155 | 0.49 |
| 2022-23 | Cleveland Cavaliers | 1 | 0 | 1 | 0 | 4 | 1 | 2.5 | 0.6 | 1.209 | 0.52 |
| 2023-24 | Cleveland Cavaliers | 6 | 0 | 0 | 1 | 2 | 0 | 3.0 | 0.6 | 1.161 | 0.49 |
| 2024-25 | Cleveland Cavaliers | 0 | 0 | 0 | 0 | 1 | 0 | 2.7 | 0.6 | 1.302 | 0.55 |
| 2024-25 | Atlanta Hawks | 1 | 0 | 0 | 0 | 0 | 0 | 3.0 | 1.0 | 1.289 | 0.56 |
| 2024-25 | 2024 25 Totals | 1 | 0 | 0 | 0 | 1 | 0 | 2.8 | 0.8 | 1.295 | 0.56 |
| 2025-26 | Detroit Pistons | 0 | 0 | 0 | 0 | 1 | 0 | 1.9 | 0.6 | 1.133 | 0.49 |
| Career | — | 20 | 1 | 3 | 1 | 15 | 1 | 2.3 | 0.6 | 1.178 | 0.50 |
Scoring, rebounding and assist trend
04 / SHOT CHART AND ZONE SHOOTING
Shot profile
Shot-location data is not connected. Add a BALLDONTLIE GOAT-tier NBA API key in NBA Players → Settings to enable shot charts and zone shooting.
05 / RECORD, TEAM STATS AND TEAMMATES
Team
Overall1-13
Home1-7
Road0-6
DIV1-2
CONF1-10
Last Ten Games0-10
Team records for 2026-27 (regular season).
Team statistics 2026-27
Defensive
| Metric | Total | Per game | NBA rank |
|---|---|---|---|
| Blocks | 65 | 4.643 | 4th |
| Defensive Rebounds | 445 | 31.786 | 3rd |
| Steals | 96 | 6.857 | 5th |
| Points Conceded Off Turnovers | 0 | 21 | — |
| Defensive Rebound Rate | 0.0 | — | — |
| Defensive Rebounds Per Game | 31.8 | — | — |
| Blocks Per Game | 4.6 | — | — |
| Steals Per Game | 6.9 | — | — |
| Defensive Rebounds Per 48 | 0.0 | — | — |
| Blocks Per 48 | 0.0 | — | — |
| Steals Per 48 | 0.0 | — | — |
General
| Metric | Total | Per game | NBA rank |
|---|---|---|---|
| Disqualifications | 2 | — | Tied-2nd |
| Flagrant Fouls | 1 | 0.071 | Tied-3rd |
| Fouls | 316 | 22.571 | 2nd |
| Rebound Rate | 48.1 | — | 4th |
| Ejections | 0 | — | — |
| Technical Fouls | 10 | 0.357 | 4th |
| Rebounds | 635 | 45.357 | — |
| Minutes | 0 | — | — |
| Minutes Per Game | 0.0 | — | — |
| Fantasy Rating | 0.0 | — | — |
| Rating | 192.0 | — | — |
| Plus-Minus | -1 | -1 | Tied-1st |
| Game Day of Year | 0 | — | — |
| Rebounds Per Game | 45.4 | — | — |
| Fouls Per Game | 22.6 | — | — |
| Flagrant Fouls Per Game | 0.1 | — | — |
| Technical Fouls Per Game | 0.7 | — | — |
| Ejections Per Game | 0.0 | — | — |
| Disqualifications Per Game | 0.1 | — | — |
| Assist To Turnover Ratio | 1.5 | 1.533 | — |
| Steal To Foul Ratio | 0.3 | 0.304 | — |
| Block To Foul Ratio | 0.2 | 0.206 | — |
| Team Rebounds Per Game | 0.0 | — | — |
| Rebounds | 635 | 45.357 | — |
| Total Technical Fouls | 10 | 0.357 | — |
| Assist To Turnover Ratio | 31.4 | — | — |
| Team Rebounds | 0 | — | — |
| Steal To Turnover Ratio | 0.4 | 0.427 | — |
| Rebounds Per 48 Minutes | 0.0 | — | — |
| Fouls Per 48 Minutes | 0.0 | — | — |
| Flagrant Fouls Per 48 Minutes | 0.0 | — | — |
| Technical Fouls Per 48 Minutes | 0.0 | — | — |
| Ejections Per 48 Minutes | 0.0 | — | — |
| Disqualifications Per 48 Minutes | 0.0 | — | — |
| Games Played | 14 | — | Tied-2nd |
| Games Started | 0 | — | — |
| Double Double | 0 | — | — |
| Triple Double | 0 | — | — |
Offensive
| Metric | Total | Per game | NBA rank |
|---|---|---|---|
| Assists | 345 | 24.643 | 4th |
| Effective Field Goal Percentage | 50.9 | — | 5th |
| Field Goals | 528/1244 | 0.424 | — |
| Field Goals Attempted | 1244 | 88.857 | 2nd |
| Field Goals Made | 528 | 37.714 | 3rd |
| Field Goal Percentage | 42.4 | 0.424 | 5th |
| Free Throws | 220/296 | 0.743 | — |
| Free Throw Percentage | 74.3 | 0.743 | 5th |
| Free Throws Attempted | 296 | 21.143 | 5th |
| Free Throws Made | 220 | 15.714 | 5th |
| Offensive Rebounds | 190 | 13.571 | 1st |
| Points | 1486 | 106.143 | 4th |
| Turnovers | 225 | 16.071 | 1st |
| 3-Point Field Goal Percentage | 34.1 | 0.341 | 3rd |
| 3-Point Field Goals Attempted | 616 | 44 | Tied-1st |
| 3-Point Field Goals Made | 210 | 15 | 2nd |
| True Shooting Percentage | 54.1 | — | 5th |
| Team Turnovers | 11 | — | 1st |
| Total Turnovers | 236 | 16.071 | — |
| Assist Ratio | 17.6 | — | 5th |
| Points in the Paint | 572 | 40 | 4th |
| Offensive Rebound Rate | 28.3 | — | 2nd |
| Turnover Ratio | 14.7 | — | 1st |
| Fast Break Points | 186 | — | — |
| Possessions | 1420 | — | 3rd |
| Pace Factor | 102.0 | — | 3rd |
| Average Field Goals Made | 37.7 | — | — |
| Average Field Goals Attempted | 88.9 | — | — |
| Average 3-Point Field Goals Made | 15.0 | — | — |
| Average 3-Point Field Goals Attempted | 44.0 | — | — |
| Average Free Throws Made | 15.7 | — | — |
| Average Free Throws Attempted | 21.1 | — | — |
| Points Per Game | 106.1 | — | — |
| Offensive Rebounds Per Game | 13.6 | — | — |
| Assists Per Game | 24.6 | — | — |
| Turnovers Per Game | 16.1 | — | — |
| Offensive Rebound Percentage | 0.3 | 0.265 | — |
| Estimated Possessions | 1408.4 | 99.814 | — |
| Estimated Possessions Per Game | 100.6 | — | — |
| Points Per Estimated Possession | 1.1 | 1.063 | — |
| Team Turnovers Per Game | 0.8 | — | — |
| Total Turnovers Per Game | 16.9 | — | — |
| 3-Point Field Goal Percentage | 34.1 | 0.341 | — |
| 2-Point Field Goals Made | 318.0 | 22.714 | 1st |
| 2-Point Field Goals Attempted | 628.0 | 44.857 | 3rd |
| 2-Point Field Goals Made per Game | 22.7 | — | — |
| 2-Point Field Goals Attempted per Game | 44.9 | — | — |
| 2-Point Field Goal Percentage | 50.6 | 0.506 | — |
| Shooting Efficiency | 0.51 | 0.509 | — |
| Scoring Efficiency | 1.195 | 1.195 | — |
| Fieldgoals Made Per 48 | 0.0 | — | — |
| Fieldgoals Attempted Per 48 | 0.0 | — | — |
| 3-Point Fieldgoals Made Per 48 | 0.0 | — | — |
| 3-Point Fieldgoals Attempted Per 48 | 0.0 | — | — |
| Freethrows Made Per 48 | 0.0 | — | — |
| Freethrows Attempted Per 48 | 0.0 | — | — |
| Points Scored Per 48 | 0.0 | — | — |
| Offensive Rebounds Per 48 | 0.0 | — | — |
| Assists Per 48 | 0.0 | — | — |
| Turnovers | 0.0 | — | — |
Teammates
 AJ GreenG #20
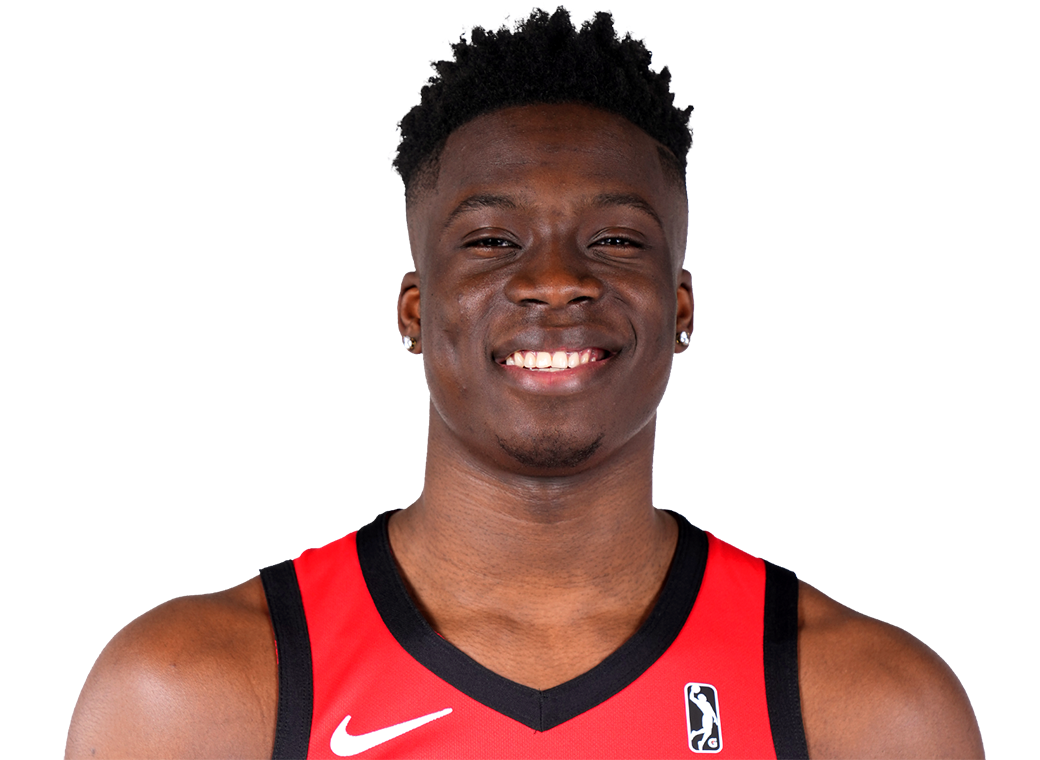 Alex AntetokounmpoF #29
 Bogoljub MarkovicF #23
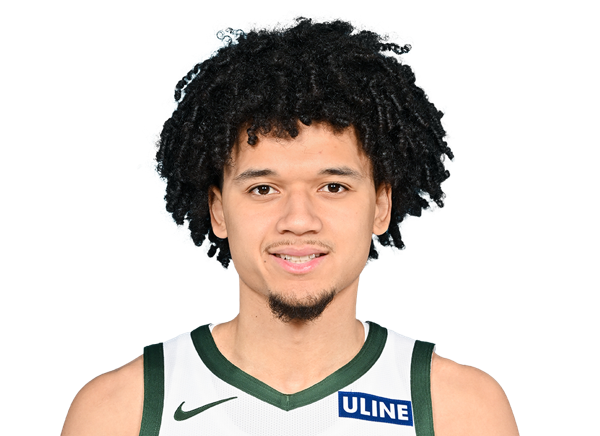 Brayden BurriesG
 Cormac RyanG #30
 Gary Trent Jr.G #5
 Jaime Jaquez Jr.F #24
 Jake StephensC #88
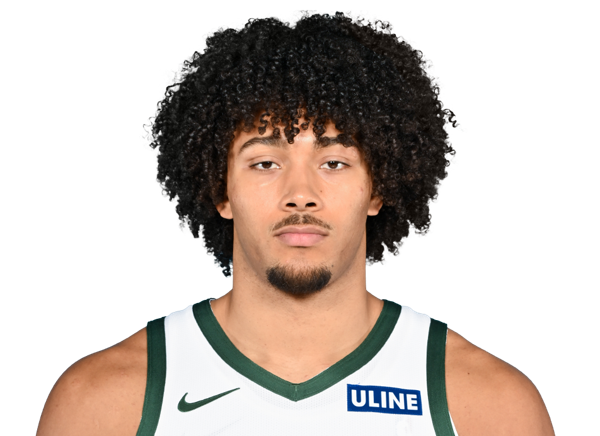 Jericho SimsC #00
 John Butler Jr.F #27
 Kam JonesG #19
 Kasparas JakucionisG #25
 Kel’el WareC #9
 Kevin Porter Jr.G #7
 Kyle KuzmaF #18
 Myles TurnerC #3
 Nate AmentF #15
 Ousmane DiengF #21
 Pete NanceF #35
 Ryan RollinsG #13
 Thanasis AntetokounmpoF #43
 Tyler HerroG #11
06 / SALARY BY SEASON
Contract
| Season | Salary |
|---|---|
| 2016-17 | $1.56M |
| 2017-18 | $1.7M |
| 2018-19 | $1.7M |
| 2019-20 | $2.63M |
| 2020-21 | $16.2M |
| 2021-22 | $17.5M |
| 2022-23 | $18.8M |
| 2023-24 | $15.38M |
| 2024-25 | $16.62M |
| 2025-26 | $14.1M |
| 2026-27 | $14.81M |
Total listed: $121.01M · source: espn.
07 / LATEST REPORT
Injury status
No current injury report entry for this player.
08 / SIGNINGS, TRADES AND ROSTER MOVES
Transactions
No recorded transactions for this player.
09 / LATEST COVERAGE
Player news
LATEST UPDATELeVert (coach's decision) did not play in Wednesday's 128-116 loss to Washington.
LeVert opened his Milwaukee tenure outside the rotation, a disappointing development for a veteran capable of providing scoring and secondary playmaking. He'll need to work his way into a meaningful role before warranting consideration in most fantasy leagues.
8 July 2026Sources: Pistons trade LeVert to Bucks for Prince, Harris↗
13 January 2026Are blockbuster NBA trades worth it? Lessons from 14 since 2013↗
18 November 2026Miami Heat unveil 'A Night in Vice City' court, activities ahead of GTA VI release↗
18 November 202676ers' LeBron James sues makers of AI sports-betting app 'Bron'↗
18 November 2026Raptors say Kawhi Leonard progressing but out at least another week↗
18 November 2026Terry Rozier co-defendant signals intent to change plea in NBA betting case↗
18 November 202676ers' Jaylen Brown (hamstring) to miss Wednesday's game vs. Magic↗
18 November 2026NBA buzz: Latest on trades, news, roster moves and intel↗
10 / BIO, DRAFT AND CONTACT DETAILS
Biography & profile
TeamMilwaukee Bucks
PositionGuard
Jersey12
Height6' 7"
Weight205 lbs
Age32
Date of birthAug 25, 1994
BirthplacePickerington, OH, USA
CollegeMichigan
Experience11 yrs
StatusActive