


BALLERSCULTURE PLAYER PROFILE · 2026-27
Doug McDermott
Sacramento Kings · F • #7 • 6' 7" 225 lbs

01 / 2026-27 PER-GAME AVERAGES
Season snapshot
No regular-season 2026-27 statistics are recorded for this player. Career history is shown further down.
02 / EVERY SEASON SINCE 2022-23, SIDE BY SIDE
2022-23 to 2026-27
Per game
| Season | Team | GP | GS | MIN | PTS | REB | AST | STL | BLK | TO | FG% | 3P% | FT% |
|---|---|---|---|---|---|---|---|---|---|---|---|---|---|
| 2022-23 | San Antonio Spurs | 64 | 0 | 20.5 | 10.2 | 2.2 | 1.4 | 0.2 | 0.1 | 0.9 | 45.7 | 41.3 | 75.7 |
| 2023-24 | San Antonio Spurs | 64 | 0 | 14.1 | 5.5 | 0.9 | 1.1 | 0.3 | 0.0 | 0.4 | 43.3 | 41.0 | 57.9 |
| 2024-25 | Sacramento Kings | 42 | 3 | 8.1 | 3.5 | 0.5 | 0.2 | 0.1 | 0.0 | 0.1 | 42.7 | 43.6 | 60.0 |
| 2025-26 | Sacramento Kings | 29 | 0 | 15.1 | 5.7 | 1.3 | 0.8 | 0.2 | 0.1 | 0.4 | 38.8 | 39.0 | 88.9 |
| 2026-27 | — | — | — | — | — | — | — | — | — | — | — | — | — |
Season totals
| Season | Team | GP | GS | MIN | PTS | REB | AST | STL | BLK | TO | FG% | 3P% | FT% |
|---|---|---|---|---|---|---|---|---|---|---|---|---|---|
| 2022-23 | San Antonio Spurs | — | — | — | 654 | 138 | 91 | 13 | 6 | 58 | 45.7 | 41.3 | 75.7 |
| 2023-24 | San Antonio Spurs | — | — | — | 276 | 48 | 57 | 11 | 2 | 24 | 44.2 | 43.9 | 58.8 |
| 2024-25 | Sacramento Kings | — | — | — | 147 | 22 | 7 | 4 | 2 | 6 | 42.7 | 43.6 | 60.0 |
| 2025-26 | Sacramento Kings | — | — | — | 164 | 37 | 22 | 6 | 4 | 13 | 38.8 | 39.0 | 88.9 |
| 2026-27 | — | — | — | — | — | — | — | — | — | — | — | — | — |
Click a season to open this player’s full game log, splits and advanced stats for that year; click a team to open its page. A dash means no NBA games were recorded.
03 / SEASON-BY-SEASON HISTORY
Career statistics
Regular Season Averages
| Season | Team | GP | GS | MIN | FG | FG% | 3PT | 3P% | FT | FT% | OR | DR | REB | AST | BLK | STL | PF | TO | PTS |
|---|---|---|---|---|---|---|---|---|---|---|---|---|---|---|---|---|---|---|---|
| 2014-15 | Chicago Bulls | 36 | 0 | 8.9 | 1.2-3.0 | 40.2 | 0.4-1.1 | 31.7 | 0.3-0.4 | 66.7 | 0.2 | 1.0 | 1.2 | 0.2 | 0.0 | 0.1 | 0.8 | 0.5 | 3.0 |
| 2015-16 | Chicago Bulls | 81 | 4 | 23.0 | 3.6-8.0 | 45.2 | 1.4-3.2 | 42.5 | 0.9-1.0 | 85.7 | 0.5 | 2.0 | 2.4 | 0.7 | 0.1 | 0.2 | 1.6 | 0.7 | 9.4 |
| 2016-17 | Chicago Bulls | 44 | 4 | 24.5 | 3.8-8.5 | 44.5 | 1.3-3.4 | 37.3 | 1.3-1.5 | 88.1 | 0.3 | 2.6 | 3.0 | 1.0 | 0.1 | 0.3 | 1.3 | 0.7 | 10.2 |
| 2016-17 | Oklahoma City Thunder | 22 | 1 | 19.5 | 2.5-5.6 | 45.2 | 1.0-2.6 | 36.2 | 0.5-0.8 | 70.6 | 0.3 | 2.0 | 2.2 | 0.6 | 0.0 | 0.1 | 1.0 | 0.3 | 6.6 |
| 2016-17 | 2016 17 Totals | 66 | 5 | 22.8 | 3.4-7.5 | 44.7 | 1.2-3.2 | 37.0 | 1.1-1.3 | 84.5 | 0.3 | 2.4 | 2.7 | 0.9 | 0.1 | 0.2 | 1.2 | 0.6 | 9.0 |
| 2017-18 | New York Knicks | 55 | 1 | 21.3 | 2.7-6.0 | 46.0 | 1.0-2.5 | 38.7 | 0.7-1.0 | 75.5 | 0.6 | 1.8 | 2.4 | 0.9 | 0.2 | 0.2 | 1.3 | 0.6 | 7.2 |
| 2017-18 | Dallas Mavericks | 26 | 3 | 22.9 | 3.3-6.9 | 47.8 | 1.5-3.0 | 49.4 | 0.9-1.1 | 85.7 | 0.3 | 2.3 | 2.5 | 1.1 | 0.2 | 0.3 | 1.9 | 0.8 | 9.0 |
| 2017-18 | 2017 18 Totals | 81 | 4 | 21.8 | 2.9-6.3 | 46.7 | 1.1-2.7 | 42.6 | 0.8-1.0 | 79.0 | 0.5 | 2.0 | 2.5 | 1.0 | 0.2 | 0.2 | 1.5 | 0.7 | 7.8 |
| 2018-19 | Indiana Pacers | 77 | 1 | 17.4 | 2.7-5.5 | 49.1 | 1.1-2.7 | 40.8 | 0.9-1.0 | 83.5 | 0.2 | 1.2 | 1.4 | 0.9 | 0.1 | 0.2 | 1.4 | 0.5 | 7.3 |
| 2019-20 | Indiana Pacers | 69 | 0 | 19.9 | 3.9-7.9 | 48.8 | 1.9-4.3 | 43.5 | 0.7-0.8 | 82.8 | 0.4 | 2.1 | 2.5 | 1.1 | 0.1 | 0.2 | 1.7 | 0.6 | 10.3 |
| 2020-21 | Indiana Pacers | 66 | 29 | 24.5 | 5.4-10.1 | 53.2 | 1.7-4.3 | 38.8 | 1.2-1.5 | 81.6 | 0.9 | 2.4 | 3.3 | 1.3 | 0.1 | 0.3 | 1.8 | 0.8 | 13.6 |
| 2021-22 | San Antonio Spurs | 51 | 51 | 24.0 | 4.2-9.1 | 46.2 | 2.1-5.0 | 42.2 | 0.8-1.0 | 78.4 | 0.4 | 1.9 | 2.3 | 1.3 | 0.1 | 0.3 | 1.5 | 0.8 | 11.3 |
| 2022-23 | San Antonio Spurs | 64 | 0 | 20.5 | 3.7-8.2 | 45.7 | 1.9-4.7 | 41.3 | 0.8-1.1 | 75.7 | 0.4 | 1.8 | 2.2 | 1.4 | 0.1 | 0.2 | 1.8 | 0.9 | 10.2 |
| 2023-24 | San Antonio Spurs | 46 | 0 | 15.2 | 2.1-4.7 | 44.2 | 1.7-3.8 | 43.9 | 0.2-0.4 | 58.8 | 0.2 | 0.9 | 1.0 | 1.2 | 0.0 | 0.2 | 1.0 | 0.5 | 6.0 |
| 2023-24 | Indiana Pacers | 18 | 0 | 11.3 | 1.6-3.8 | 40.6 | 1.0-3.1 | 32.1 | 0.1-0.1 | 50.0 | 0.1 | 0.5 | 0.6 | 0.7 | 0.0 | 0.3 | 0.9 | 0.2 | 4.2 |
| 2023-24 | 2023 24 Totals | 64 | 0 | 14.1 | 1.9-4.4 | 43.3 | 1.5-3.6 | 41.0 | 0.2-0.3 | 57.9 | 0.2 | 0.8 | 0.9 | 1.1 | 0.0 | 0.3 | 1.0 | 0.4 | 5.5 |
| 2024-25 | Sacramento Kings | 42 | 3 | 8.1 | 1.2-2.8 | 42.7 | 1.0-2.4 | 43.6 | 0.1-0.1 | 60.0 | 0.1 | 0.5 | 0.5 | 0.2 | 0.0 | 0.1 | 0.7 | 0.1 | 3.5 |
| 2025-26 | Sacramento Kings | 29 | 0 | 15.1 | 1.9-4.8 | 38.8 | 1.7-4.2 | 39.0 | 0.3-0.3 | 88.9 | 0.2 | 1.0 | 1.3 | 0.8 | 0.1 | 0.2 | 1.0 | 0.4 | 5.7 |
| Career | — | 726 | 97 | 19.3 | 3.2-6.8 | 46.8 | 1.4-3.5 | 41.0 | 0.7-0.9 | 80.6 | 0.4 | 1.7 | 2.1 | 0.9 | 0.1 | 0.2 | 1.4 | 0.6 | 8.5 |
Regular Season Totals
| Season | Team | FG | FG% | 3PT | 3P% | FT | FT% | OR | DR | REB | AST | BLK | STL | PF | TO | PTS |
|---|---|---|---|---|---|---|---|---|---|---|---|---|---|---|---|---|
| 2014-15 | Chicago Bulls | 43-107 | 40.2 | 13-41 | 31.7 | 10-15 | 66.7 | 6 | 37 | 43 | 6 | 1 | 4 | 29 | 17 | 109 |
| 2015-16 | Chicago Bulls | 291-644 | 45.2 | 110-259 | 42.5 | 72-84 | 85.7 | 37 | 158 | 195 | 59 | 6 | 14 | 127 | 53 | 764 |
| 2016-17 | Chicago Bulls | 166-373 | 44.5 | 56-150 | 37.3 | 59-67 | 88.1 | 14 | 116 | 130 | 45 | 4 | 11 | 57 | 32 | 447 |
| 2016-17 | Oklahoma City Thunder | 56-124 | 45.2 | 21-58 | 36.2 | 12-17 | 70.6 | 6 | 43 | 49 | 13 | 1 | 2 | 22 | 6 | 145 |
| 2016-17 | 2016 17 Totals | 222-497 | 44.7 | 77-208 | 37.0 | 71-84 | 84.5 | 20 | 159 | 179 | 58 | 5 | 13 | 79 | 38 | 592 |
| 2017-18 | New York Knicks | 151-328 | 46.0 | 53-137 | 38.7 | 40-53 | 75.5 | 33 | 101 | 134 | 50 | 12 | 10 | 73 | 34 | 395 |
| 2017-18 | Dallas Mavericks | 86-180 | 47.8 | 39-79 | 49.4 | 24-28 | 85.7 | 7 | 59 | 66 | 29 | 4 | 9 | 49 | 22 | 235 |
| 2017-18 | 2017 18 Totals | 237-508 | 46.7 | 92-216 | 42.6 | 64-81 | 79.0 | 40 | 160 | 200 | 79 | 16 | 19 | 122 | 56 | 630 |
| 2018-19 | Indiana Pacers | 207-422 | 49.1 | 84-206 | 40.8 | 66-79 | 83.5 | 17 | 92 | 109 | 67 | 8 | 18 | 104 | 42 | 564 |
| 2019-20 | Indiana Pacers | 267-547 | 48.8 | 128-294 | 43.5 | 48-58 | 82.8 | 26 | 148 | 174 | 78 | 5 | 12 | 117 | 42 | 710 |
| 2020-21 | Indiana Pacers | 354-665 | 53.2 | 111-286 | 38.8 | 80-98 | 81.6 | 60 | 161 | 221 | 85 | 6 | 20 | 117 | 53 | 899 |
| 2021-22 | San Antonio Spurs | 215-465 | 46.2 | 108-256 | 42.2 | 40-51 | 78.4 | 18 | 97 | 115 | 64 | 6 | 13 | 79 | 43 | 578 |
| 2022-23 | San Antonio Spurs | 239-523 | 45.7 | 123-298 | 41.3 | 53-70 | 75.7 | 23 | 115 | 138 | 91 | 6 | 13 | 118 | 58 | 654 |
| 2023-24 | San Antonio Spurs | 95-215 | 44.2 | 76-173 | 43.9 | 10-17 | 58.8 | 8 | 40 | 48 | 57 | 2 | 11 | 48 | 24 | 276 |
| 2023-24 | Indiana Pacers | 28-69 | 40.6 | 18-56 | 32.1 | 1-2 | 50.0 | 2 | 9 | 11 | 13 | 0 | 5 | 16 | 4 | 75 |
| 2023-24 | 2023 24 Totals | 123-284 | 43.3 | 94-229 | 41.0 | 11-19 | 57.9 | 10 | 49 | 59 | 70 | 2 | 16 | 64 | 28 | 351 |
| 2024-25 | Sacramento Kings | 50-117 | 42.7 | 44-101 | 43.6 | 3-5 | 60.0 | 3 | 19 | 22 | 7 | 2 | 4 | 30 | 6 | 147 |
| 2025-26 | Sacramento Kings | 54-139 | 38.8 | 48-123 | 39.0 | 8-9 | 88.9 | 7 | 30 | 37 | 22 | 4 | 6 | 28 | 13 | 164 |
| Career | — | 2302-4918 | 46.8 | 1032-2517 | 41.0 | 526-653 | 80.6 | 267 | 1225 | 1492 | 686 | 67 | 152 | 1014 | 449 | 6162 |
Regular Season Misc Totals
| Season | Team | DD2 | TD3 | DQ | EJECT | TECH | FLAG | AST/TO | STL/TO | SC-EFF | SH-EFF |
|---|---|---|---|---|---|---|---|---|---|---|---|
| 2014-15 | Chicago Bulls | 0 | 0 | 0 | 0 | 0 | 0 | 0.4 | 0.2 | 1.019 | 0.46 |
| 2015-16 | Chicago Bulls | 0 | 0 | 0 | 0 | 0 | 1 | 1.1 | 0.3 | 1.186 | 0.54 |
| 2016-17 | Chicago Bulls | 1 | 0 | 0 | 0 | 2 | 0 | 1.4 | 0.3 | 1.198 | 0.52 |
| 2016-17 | Oklahoma City Thunder | 0 | 0 | 0 | 0 | 0 | 0 | 2.2 | 0.3 | 1.169 | 0.54 |
| 2016-17 | 2016 17 Totals | 1 | 0 | 0 | 0 | 2 | 0 | 1.5 | 0.3 | 1.191 | 0.52 |
| 2017-18 | New York Knicks | 0 | 0 | 0 | 0 | 0 | 1 | 1.5 | 0.3 | 1.204 | 0.54 |
| 2017-18 | Dallas Mavericks | 0 | 0 | 0 | 0 | 0 | 0 | 1.3 | 0.4 | 1.306 | 0.59 |
| 2017-18 | 2017 18 Totals | 0 | 0 | 0 | 0 | 0 | 1 | 1.4 | 0.3 | 1.240 | 0.56 |
| 2018-19 | Indiana Pacers | 0 | 0 | 0 | 0 | 0 | 0 | 1.6 | 0.4 | 1.336 | 0.59 |
| 2019-20 | Indiana Pacers | 0 | 0 | 0 | 0 | 0 | 0 | 1.9 | 0.3 | 1.298 | 0.61 |
| 2020-21 | Indiana Pacers | 0 | 0 | 1 | 0 | 2 | 1 | 1.6 | 0.4 | 1.352 | 0.62 |
| 2021-22 | San Antonio Spurs | 0 | 0 | 1 | 0 | 0 | 0 | 1.5 | 0.3 | 1.243 | 0.58 |
| 2022-23 | San Antonio Spurs | 0 | 0 | 0 | 0 | 0 | 0 | 1.6 | 0.2 | 1.250 | 0.57 |
| 2023-24 | San Antonio Spurs | 0 | 0 | 0 | 0 | 0 | 0 | 2.4 | 0.5 | 1.284 | 0.62 |
| 2023-24 | Indiana Pacers | 0 | 0 | 0 | 0 | 0 | 0 | 3.3 | 1.3 | 1.087 | 0.54 |
| 2023-24 | 2023 24 Totals | 0 | 0 | 0 | 0 | 0 | 0 | 2.5 | 0.6 | 1.236 | 0.60 |
| 2024-25 | Sacramento Kings | 0 | 0 | 0 | 0 | 0 | 0 | 1.2 | 0.7 | 1.256 | 0.62 |
| 2025-26 | Sacramento Kings | 0 | 0 | 0 | 0 | 0 | 0 | 1.7 | 0.5 | 1.180 | 0.56 |
| Career | — | 1 | 0 | 2 | 0 | 4 | 3 | 1.5 | 0.3 | 1.253 | 0.57 |
Scoring, rebounding and assist trend
04 / SHOT CHART AND ZONE SHOOTING
Shot profile
Shot-location data is not connected. Add a BALLDONTLIE GOAT-tier NBA API key in NBA Players → Settings to enable shot charts and zone shooting.
05 / RECORD, TEAM STATS AND TEAMMATES
Team
Overall1-12
Home0-8
Road1-4
DIV0-2
CONF1-10
Last Ten Games1-9
Team records for 2026-27 (regular season).
Team statistics 2026-27
Defensive
| Metric | Total | Per game | NBA rank |
|---|---|---|---|
| Blocks | 45 | 3.462 | 5th |
| Defensive Rebounds | 389 | 29.923 | 3rd |
| Steals | 102 | 7.846 | 5th |
| Points Conceded Off Turnovers | 0 | 20 | — |
| Defensive Rebound Rate | 0.0 | — | — |
| Defensive Rebounds Per Game | 29.9 | — | — |
| Blocks Per Game | 3.5 | — | — |
| Steals Per Game | 7.8 | — | — |
| Defensive Rebounds Per 48 | 0.0 | — | — |
| Blocks Per 48 | 0.0 | — | — |
| Steals Per 48 | 0.0 | — | — |
General
| Metric | Total | Per game | NBA rank |
|---|---|---|---|
| Disqualifications | 1 | — | Tied-4th |
| Flagrant Fouls | 2 | 0.154 | Tied-2nd |
| Fouls | 298 | 22.923 | 3rd |
| Rebound Rate | 47.8 | — | 5th |
| Ejections | 0 | — | — |
| Technical Fouls | 6 | 0.231 | Tied-4th |
| Rebounds | 516 | 39.692 | — |
| Minutes | 0 | — | — |
| Minutes Per Game | 0.0 | — | — |
| Fantasy Rating | 0.0 | — | — |
| Rating | 192.0 | — | — |
| Plus-Minus | -1 | -1 | Tied-1st |
| Game Day of Year | 0 | — | — |
| Rebounds Per Game | 39.7 | — | — |
| Fouls Per Game | 22.9 | — | — |
| Flagrant Fouls Per Game | 0.2 | — | — |
| Technical Fouls Per Game | 0.5 | — | — |
| Ejections Per Game | 0.0 | — | — |
| Disqualifications Per Game | 0.1 | — | — |
| Assist To Turnover Ratio | 1.6 | 1.557 | — |
| Steal To Foul Ratio | 0.3 | 0.342 | — |
| Block To Foul Ratio | 0.2 | 0.151 | — |
| Team Rebounds Per Game | 0.0 | — | — |
| Rebounds | 516 | 39.692 | — |
| Total Technical Fouls | 6 | 0.231 | — |
| Assist To Turnover Ratio | 19.2 | 25.154 | — |
| Team Rebounds | 0 | — | — |
| Steal To Turnover Ratio | 0.5 | 0.486 | — |
| Rebounds Per 48 Minutes | 0.0 | — | — |
| Fouls Per 48 Minutes | 0.0 | — | — |
| Flagrant Fouls Per 48 Minutes | 0.0 | — | — |
| Technical Fouls Per 48 Minutes | 0.0 | — | — |
| Ejections Per 48 Minutes | 0.0 | — | — |
| Disqualifications Per 48 Minutes | 0.0 | — | — |
| Games Played | 13 | — | Tied-3rd |
| Games Started | 0 | — | — |
| Double Double | 0 | — | — |
| Triple Double | 0 | — | — |
Offensive
| Metric | Total | Per game | NBA rank |
|---|---|---|---|
| Assists | 327 | 25.154 | Tied-4th |
| Effective Field Goal Percentage | 52.7 | — | 5th |
| Field Goals | 508/1117 | 0.455 | — |
| Field Goals Attempted | 1117 | 85.923 | 4th |
| Field Goals Made | 508 | 39.077 | 4th |
| Field Goal Percentage | 45.5 | 0.455 | 4th |
| Free Throws | 224/292 | 0.767 | — |
| Free Throw Percentage | 76.7 | 0.767 | 4th |
| Free Throws Attempted | 292 | 22.462 | 4th |
| Free Throws Made | 224 | 17.231 | 4th |
| Offensive Rebounds | 127 | 9.769 | 4th |
| Points | 1401 | 107.769 | 4th |
| Turnovers | 210 | 16.154 | 3rd |
| 3-Point Field Goal Percentage | 34.3 | 0.343 | 5th |
| 3-Point Field Goals Attempted | 469 | 36.077 | 4th |
| 3-Point Field Goals Made | 161 | 12.385 | 5th |
| True Shooting Percentage | 56.2 | — | 5th |
| Team Turnovers | 17 | 1 | 1st |
| Total Turnovers | 227 | 17.154 | — |
| Assist Ratio | 18.2 | — | 4th |
| Points in the Paint | 586 | 45 | 4th |
| Offensive Rebound Rate | 22.8 | — | 5th |
| Turnover Ratio | 15.4 | — | 2nd |
| Fast Break Points | 187 | — | — |
| Possessions | 1345 | — | 3rd |
| Pace Factor | 103.0 | — | 1st |
| Average Field Goals Made | 39.1 | — | — |
| Average Field Goals Attempted | 85.9 | — | — |
| Average 3-Point Field Goals Made | 12.4 | — | — |
| Average 3-Point Field Goals Attempted | 36.1 | — | — |
| Average Free Throws Made | 17.2 | — | — |
| Average Free Throws Attempted | 22.5 | — | — |
| Points Per Game | 107.8 | — | — |
| Offensive Rebounds Per Game | 9.8 | — | — |
| Assists Per Game | 25.2 | — | — |
| Turnovers Per Game | 16.2 | — | — |
| Offensive Rebound Percentage | 0.2 | 0.209 | — |
| Estimated Possessions | 1333.8 | 102.293 | — |
| Estimated Possessions Per Game | 102.6 | — | — |
| Points Per Estimated Possession | 1.1 | 1.054 | — |
| Team Turnovers Per Game | 1.3 | — | — |
| Total Turnovers Per Game | 17.5 | — | — |
| 3-Point Field Goal Percentage | 34.3 | 0.343 | 1st |
| 2-Point Field Goals Made | 347.0 | 26.692 | Tied-1st |
| 2-Point Field Goals Attempted | 648.0 | 49.846 | — |
| 2-Point Field Goals Made per Game | 26.7 | — | — |
| 2-Point Field Goals Attempted per Game | 49.8 | — | — |
| 2-Point Field Goal Percentage | 53.5 | 0.535 | — |
| Shooting Efficiency | 0.53 | 0.527 | — |
| Scoring Efficiency | 1.254 | 1.254 | — |
| Fieldgoals Made Per 48 | 0.0 | — | — |
| Fieldgoals Attempted Per 48 | 0.0 | — | — |
| 3-Point Fieldgoals Made Per 48 | 0.0 | — | — |
| 3-Point Fieldgoals Attempted Per 48 | 0.0 | — | — |
| Freethrows Made Per 48 | 0.0 | — | — |
| Freethrows Attempted Per 48 | 0.0 | — | — |
| Points Scored Per 48 | 0.0 | — | — |
| Offensive Rebounds Per 48 | 0.0 | — | — |
| Assists Per 48 | 0.0 | — | — |
| Turnovers | 0.0 | — | — |
Teammates
 Aaron NkrumahG
 Adam FlaglerG #20
 Alex KarabanF #33
 Ben SimmonsG #25
 Daeqwon PlowdenG #29
 Damari MonsantoG
 Darius Acuff Jr.G #5
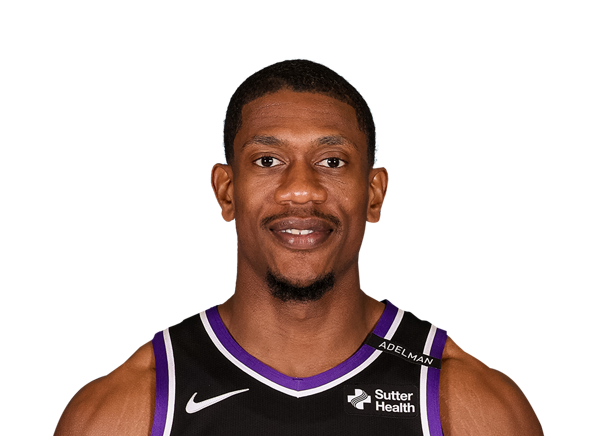 De’Andre HunterF #15
 Domantas SabonisF #11
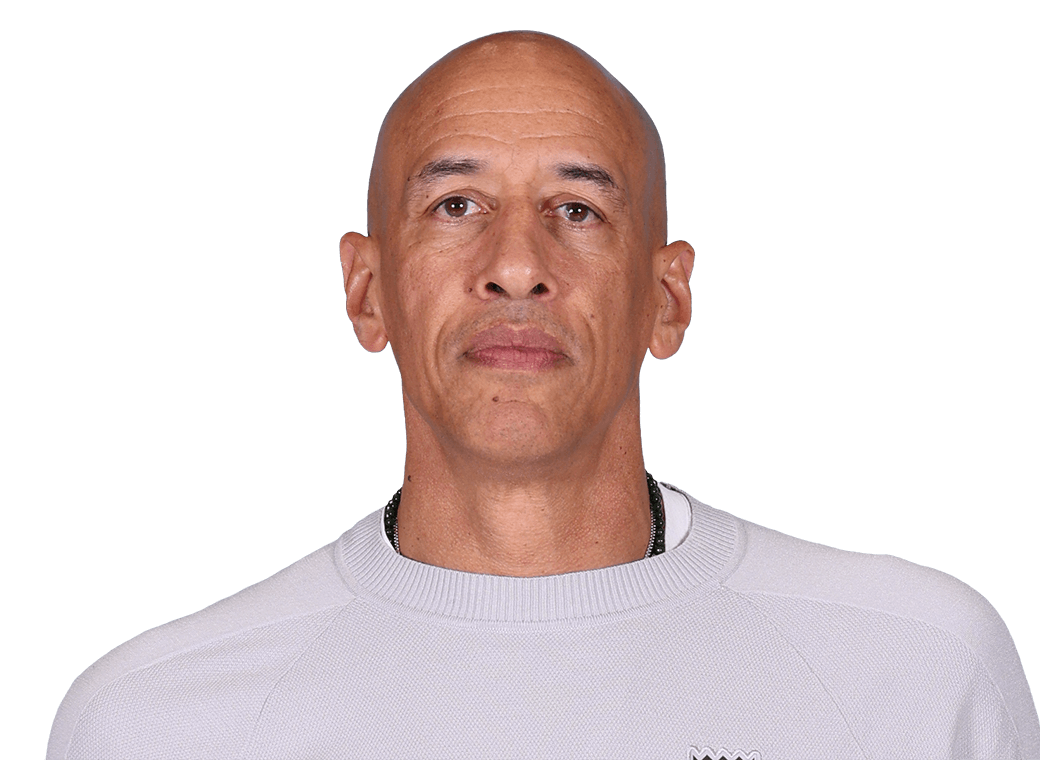 Doug ChristieG
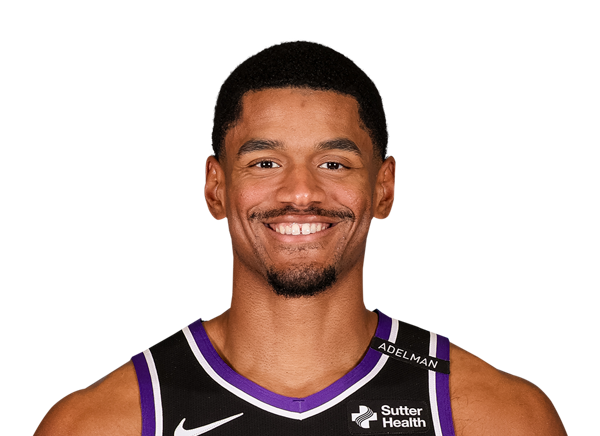 Dylan CardwellC #32
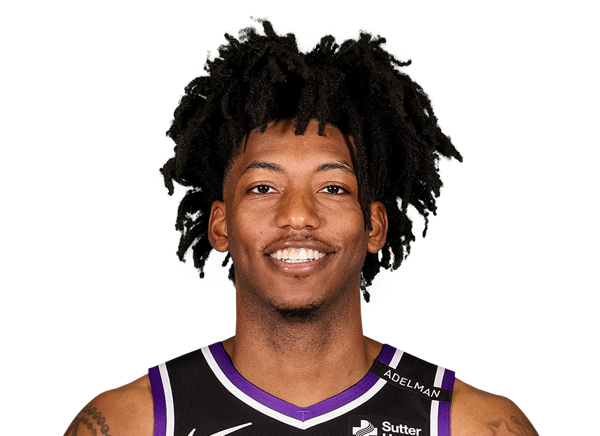 Elfrid PaytonG #3
 Emanuel SharpG #34
 Jonathan MogboF #22
 Keegan MurrayF #13
 Killian HayesG #3
 Leaky BlackF #19
 Malik MonkG
 Mason PlumleeC
 Maxime RaynaudC #42
 Patrick Baldwin Jr.G #23
 Precious AchiuwaF #9
 Russell WestbrookG #18
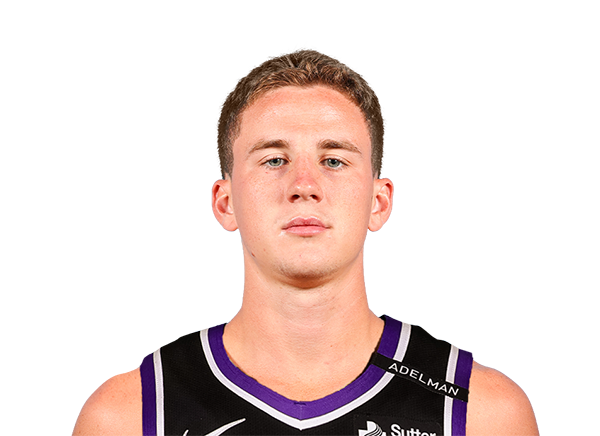 Sean PedullaG #3
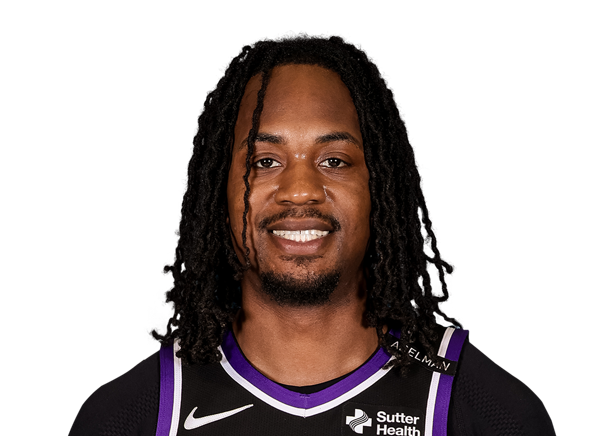 Tristen NewtonG #00
 Viktor LakhinF
 Zach LaVineG #8
06 / SALARY BY SEASON
Contract
| Season | Salary |
|---|---|
| 2014-15 | $2.28M |
| 2015-16 | $2.38M |
| 2016-17 | $2.48M |
| 2017-18 | $3.29M |
| 2018-19 | $7.33M |
| 2019-20 | $7.33M |
| 2020-21 | $7.33M |
| 2021-22 | $13.75M |
| 2022-23 | $13.75M |
| 2023-24 | $13.75M |
| 2024-25 | $2.09M |
| 2025-26 | $2.3M |
Total listed: $78.07M · source: espn.
07 / LATEST REPORT
Injury status
No current injury report entry for this player.
08 / SIGNINGS, TRADES AND ROSTER MOVES
Transactions
No recorded transactions for this player.
09 / LATEST COVERAGE
Player news
LATEST UPDATEMcDermott announced his retirement Friday.
McDermott spent 12 seasons in the NBA, suiting up for the Bulls, Thunder, Mavericks, Knicks, Pacers, Spurs and Kings throughout his career. McDermott had his best season in 2020-21, averaging 13.6 points per game and shooting 38.8 percent from deep. Over 726 regular-season appearances, McDermott averaged 8.5 points, 2.1 rebounds and 0.9 assists per game while shooting 41 percent from three-point range.
14 November 2026Ex-lottery pick Doug McDermott retires after 12 NBA seasons↗
22 July 2025Doug McDermott to return to Kings on one-year, $3.6M deal↗
9 June 2025NBA Finals: High school teammates who made the NBA↗
17 October 2024Forward Doug McDermott agrees to deal with Kings↗
9 February 2024Sources: Sixers trade for guard Buddy Hield from Pacers↗
10 January 2024The top 25 men's college basketball players of the past 25 years↗
3 August 2021San Antonio Spurs open free agency with flurry, adding Doug McDermott, Zach Collins with three-year contracts, sources say↗
23 April 2024Source: Kyle O'Quinn agrees to 1-year, $4.5 million contract with Pacers↗
10 / BIO, DRAFT AND CONTACT DETAILS
Biography & profile
TeamSacramento Kings
PositionForward
Jersey7
Height6' 7"
Weight225 lbs
Age34
CollegeCreighton
StatusFree Agent