Click a season to open this player’s full game log, splits and advanced stats for that year; click a team to open its page. A dash means no NBA games were recorded.
03 / EVERY CATEGORY THE PROVIDER REPORTS
Full statistical breakdown
Regular season 2026-27
Defensive
Metric
Total
NBA rank
Blocks
16
Tied-15th
Defensive Rebounds
77
21st
Steals
8
Tied-174th
Defensive Rebound Rate
0.0
—
Defensive Rebounds Per Game
5.1
38th
Blocks Per Game
1.1
32nd
Steals Per Game
0.5
207th
Defensive Rebounds Per 48
7.4
—
Blocks Per 48
1.5
—
Steals Per 48
0.8
—
General
Metric
Total
NBA rank
Disqualifications
0
Tied-22nd
Flagrant Fouls
1
Tied-4th
Fouls
27
Tied-143rd
Player Efficiency Rating
19.54
42nd
Rebound Rate
0.0
—
Ejections
0
Tied-7th
Technical Fouls
1
Tied-31st
Rebounds
82
—
Value Over Replacement Player
0.0
—
Minutes
502
—
Minutes Per Game
33.5
—
Rating
34.7
Tied-12th
Plus-Minus
+96
Tied-1st
Rebounds Per Game
5.5
74th
Fouls Per Game
1.8
194th
Flagrant Fouls Per Game
0.1
Tied-15th
Technical Fouls Per Game
0.1
Tied-78th
Ejections Per Game
0.0
Tied-6th
Disqualifications Per Game
0.0
Tied-21st
Assist To Turnover Ratio
1.3
—
Steal To Foul Ratio
0.3
—
Block To Foul Ratio
0.6
—
Team Rebounds Per Game
0.0
—
Rebounds
82
—
Total Technical Fouls
1
—
Assist To Turnover Ratio
0.0
—
Steal To Turnover Ratio
0.2
—
Rebounds Per 48 Minutes
7.8
—
Fouls Per 48 Minutes
2.6
—
Flagrant Fouls Per 48 Minutes
0.1
—
Technical Fouls Per 48 Minutes
0.1
—
Ejections Per 48 Minutes
0.0
—
Disqualifications Per 48 Minutes
0.0
—
R/40
6.5
—
Games Played
15
15th
Games Started
15
Tied-1st
Double Double
2
Tied-44th
Triple Double
0
Tied-13th
Offensive
Metric
Total
NBA rank
Assists
57
43rd
Effective Field Goal Percentage
53.9
—
Field Goals
99/204
—
Field Goals Attempted
204
Tied-28th
Field Goals Made
99
Tied-24th
Field Goal Percentage
48.5
46th
Free Throws
100/114
—
Free Throw Percentage
87.7
52nd
Free Throws Attempted
114
3rd
Free Throws Made
100
2nd
Offensive Rebounds
5
Tied-280th
Points
320
10th
Turnovers
44
Tied-12th
3-Point Field Goal Percentage
37.3
107th
3-Point Field Goals Attempted
59
Tied-94th
3-Point Field Goals Made
22
Tied-92nd
True Shooting Percentage
63.0
—
Total Turnovers
44
—
Assist Ratio
16.0
—
Points in the Paint
0
Tied-1st
Offensive Rebound Rate
0.0
—
Turnover Ratio
12.4
—
Brick Index
0.00
—
Usage Rate
0.0
—
Average Field Goals Made
6.6
47th
Average Field Goals Attempted
13.6
414th
Average 3-Point Field Goals Made
1.5
124th
Average 3-Point Field Goals Attempted
3.9
Tied-126th
Average Free Throws Made
6.7
Tied-5th
Average Free Throws Attempted
7.6
Tied-8th
Points Per Game
21.3
31st
Offensive Rebounds Per Game
0.3
Tied-253rd
Assists Per Game
3.8
66th
Turnovers Per Game
2.9
21st
Offensive Rebound Percentage
0.0
—
Estimated Possessions
288.6
—
Estimated Possessions Per Game
19.2
—
Points Per Estimated Possession
1.1
—
Team Turnovers Per Game
0.0
—
Total Turnovers Per Game
2.9
—
3-Point Field Goal Percentage
37.3
90th
2-Point Field Goals Made
77.0
68th
2-Point Field Goals Attempted
145.0
66th
2-Point Field Goals Made per Game
5.1
—
2-Point Field Goals Attempted per Game
9.7
—
2-Point Field Goal Percentage
53.1
46th
Shooting Efficiency
0.54
—
Scoring Efficiency
1.569
—
Fieldgoals Made Per 48
9.5
—
Fieldgoals Attempted Per 48
19.5
—
3-Point Fieldgoals Made Per 48
2.1
—
3-Point Fieldgoals Attempted Per 48
5.6
—
Freethrows Made Per 48
9.6
—
Freethrows Attempted Per 48
10.9
—
Points Scored Per 48
30.6
—
Offensive Rebounds Per 48
0.5
—
Assists Per 48
5.5
—
Turnovers
4.2
—
P/40
25.5
—
A/40
4.5
—
04 / EFFICIENCY, SHOOTING PROFILE, PER-36
Advanced metrics
True shooting %62.9%
Effective FG %54.0%
2-point FG %52.6%
3-point attempt rate28.7%
Free throw rate55.9%
Points per shot attempt1.57
% of points from 3s21.1%
Assist-to-turnover1.31
Points per 36 min22.9
Rebounds per 36 min5.9
Assists per 36 min4.1
Steals per 36 min0.54
Blocks per 36 min1.18
Turnovers per 36 min3.12
Stocks (STL + BLK) per game1.60
Pts + Reb + Ast per game30.6
Efficiency (EFF) per game21.4
Game Score per game (Hollinger)16.1
Minutes per game33.5
Calculated by BallersCulture from the supplied 2026-27 box-score totals using standard formulas (hover a tile to see the formula). Tracking-based metrics such as BPM, VORP, on/off and RAPTOR are not available from this data source.
05 / 15 GAMES IN 2026-27
Game log: Regular season
Date
Opp
Result
MIN
FG
FG%
3PT
3P%
FT
FT%
REB
AST
BLK
STL
PF
TO
PTS
Nov 17
@ MIA
L 128-110
29
8-19
42.1
2-6
33.3
4-4
100.0
2
3
1
0
0
1
22
Nov 16
@ WSH
W 147-119
30
8-13
61.5
2-3
66.7
7-8
87.5
4
5
0
1
0
2
25
Nov 14
vs UTAH
W 125-118
33
5-14
35.7
2-4
50.0
10-10
100.0
3
6
0
0
1
2
22
Nov 12
vs GS
W 115-108
34
8-17
47.1
1-4
25.0
3-4
75.0
4
5
0
0
2
2
20
Nov 10
vs DEN
W 110-100
36
6-15
40.0
1-3
33.3
10-10
100.0
12
8
1
0
4
6
23
Nov 8
@ PHX
L 102-99
38
5-14
35.7
1-7
14.3
10-11
90.9
10
3
0
1
0
2
21
Nov 5
vs MIN
L 117-107
35
7-14
50.0
2-5
40.0
5-6
83.3
5
2
1
1
3
5
21
Nov 3
vs BOS
W 109-93
33
5-6
83.3
0-0
0.0
2-3
66.7
3
3
1
2
2
4
12
Nov 1
vs OKC
W 119-98
27
4-9
44.4
0-1
0.0
6-6
100.0
3
4
3
1
1
1
14
Oct 31
@ DAL
L 116-111
37
9-20
45.0
1-6
16.7
9-13
69.2
5
1
0
0
2
3
28
Oct 29
@ MIL
W 132-100
31
5-9
55.6
2-3
66.7
6-7
85.7
5
4
3
0
1
3
18
Oct 27
vs ATL
W 120-110
30
6-13
46.2
1-4
25.0
9-10
90.0
9
3
4
1
4
4
22
Oct 25
@ ATL
W 121-114
37
8-15
53.3
3-7
42.9
3-3
100.0
4
2
1
0
3
2
22
Oct 24
@ SA
W 114-110
37
5-10
50.0
2-2
100.0
8-8
100.0
7
5
0
0
2
3
20
Oct 22
vs DAL
W 128-110
37
10-16
62.5
2-4
50.0
8-11
72.7
6
3
1
1
2
4
30
06 / 2026-27 HOME / AWAY, RESULTS, MONTHS AND OPPONENTS
Splits
split
Split
GP
MIN
FG
FG%
3PT
3P%
FT
FT%
OR
DR
REB
AST
BLK
STL
PF
TO
PTS
All Splits
15
33.5
6.6-13.6
48.5
1.5-3.9
37.3
6.7-7.6
87.7
0.3
5.1
5.5
3.8
1.1
0.5
1.8
2.9
21.3
Home
8
33.1
6.4-13.0
49.0
1.1-3.1
36.0
6.6-7.5
88.3
0.1
5.5
5.6
4.3
1.4
0.8
2.4
3.5
20.5
Road
7
33.9
6.9-14.3
48.0
1.9-4.9
38.2
6.7-7.7
87.0
0.6
4.7
5.3
3.3
0.7
0.3
1.1
2.3
22.3
vs. Division
3
37.0
8.0-15.3
52.2
1.7-4.0
41.7
8.3-10.7
78.1
0.7
5.3
6.0
3.0
0.3
0.3
2.0
3.3
26.0
vs. Conference
9
34.9
6.6-14.3
45.7
1.3-4.0
33.3
7.7-8.8
87.3
0.3
5.8
6.1
4.1
0.7
0.4
1.9
3.1
22.1
3+ Days Rest
1
37.0
10.0-16.0
62.5
2.0-4.0
50.0
8.0-11.0
72.7
0.0
6.0
6.0
3.0
1.0
1.0
2.0
4.0
30.0
Month
Split
GP
MIN
FG
FG%
3PT
3P%
FT
FT%
OR
DR
REB
AST
BLK
STL
PF
TO
PTS
October
7
33.7
6.7-13.1
51.1
1.6-3.9
40.7
7.0-8.3
84.5
0.4
5.1
5.6
3.1
1.7
0.4
2.1
2.9
22.0
November
8
33.4
6.5-14.0
46.4
1.4-4.0
34.4
6.4-7.0
91.1
0.3
5.1
5.4
4.4
0.5
0.6
1.5
3.0
20.8
Pre All-Star
15
33.5
6.6-13.6
48.5
1.5-3.9
37.3
6.7-7.6
87.7
0.3
5.1
5.5
3.8
1.1
0.5
1.8
2.9
21.3
Result
Split
GP
MIN
FG
FG%
3PT
3P%
FT
FT%
OR
DR
REB
AST
BLK
STL
PF
TO
PTS
Wins
11
33.2
6.4-12.5
51.1
1.5-3.2
45.7
6.5-7.3
90.0
0.3
5.2
5.5
4.4
1.3
0.5
2.0
3.0
20.7
Losses
4
34.5
7.3-16.8
43.3
1.5-6.0
25.0
7.0-8.5
82.4
0.5
5.0
5.5
2.3
0.5
0.5
1.3
2.8
23.0
Position
Split
GP
MIN
FG
FG%
3PT
3P%
FT
FT%
OR
DR
REB
AST
BLK
STL
PF
TO
PTS
As Starter
15
33.5
6.6-13.6
48.5
1.5-3.9
37.3
6.7-7.6
87.7
0.3
5.1
5.5
3.8
1.1
0.5
1.8
2.9
21.3
Day
Split
GP
MIN
FG
FG%
3PT
3P%
FT
FT%
OR
DR
REB
AST
BLK
STL
PF
TO
PTS
Monday
4
31.8
6.3-13.3
47.2
1.0-3.3
30.8
6.3-6.8
92.6
0.0
6.5
6.5
4.3
1.8
0.8
2.5
3.8
19.8
Wednesday
4
34.3
7.5-14.0
53.6
1.8-4.0
43.8
5.5-7.0
78.6
0.5
4.5
5.0
3.5
1.3
0.5
2.0
3.5
22.3
Friday
3
35.7
6.3-14.7
43.2
1.7-4.0
41.7
9.0-10.3
87.1
0.7
4.3
5.0
4.0
0.0
0.0
1.7
2.7
23.3
Saturday
3
34.0
5.7-12.7
44.7
1.3-5.0
26.7
6.3-6.7
95.0
0.0
5.7
5.7
3.0
1.3
0.7
1.3
1.7
19.0
Sunday
1
30.0
8.0-13.0
61.5
2.0-3.0
66.7
7.0-8.0
87.5
1.0
3.0
4.0
5.0
0.0
1.0
0.0
2.0
25.0
Opponent
Split
GP
MIN
FG
FG%
3PT
3P%
FT
FT%
OR
DR
REB
AST
BLK
STL
PF
TO
PTS
Atlanta Hawks
2
33.0
7.0-14.0
50.0
2.0-5.5
36.4
6.0-6.5
92.3
0.0
6.5
6.5
2.5
2.5
0.5
3.5
3.0
22.0
Boston Celtics
1
33.0
5.0-6.0
83.3
0.0-0.0
0.0
2.0-3.0
66.7
0.0
3.0
3.0
3.0
1.0
2.0
2.0
4.0
12.0
Dallas Mavericks
2
37.0
9.5-18.0
52.8
1.5-5.0
30.0
8.5-12.0
70.8
0.5
5.0
5.5
2.0
0.5
0.5
2.0
3.5
29.0
Denver Nuggets
1
36.0
6.0-15.0
40.0
1.0-3.0
33.3
10.0-10.0
100.0
0.0
12.0
12.0
8.0
1.0
0.0
4.0
6.0
23.0
Golden State Warriors
1
34.0
8.0-17.0
47.1
1.0-4.0
25.0
3.0-4.0
75.0
0.0
4.0
4.0
5.0
0.0
0.0
2.0
2.0
20.0
Miami Heat
1
29.0
8.0-19.0
42.1
2.0-6.0
33.3
4.0-4.0
100.0
0.0
2.0
2.0
3.0
1.0
0.0
0.0
1.0
22.0
Milwaukee Bucks
1
31.0
5.0-9.0
55.6
2.0-3.0
66.7
6.0-7.0
85.7
1.0
4.0
5.0
4.0
3.0
0.0
1.0
3.0
18.0
Minnesota Timberwolves
1
35.0
7.0-14.0
50.0
2.0-5.0
40.0
5.0-6.0
83.3
1.0
4.0
5.0
2.0
1.0
1.0
3.0
5.0
21.0
Phoenix Suns
1
38.0
5.0-14.0
35.7
1.0-7.0
14.3
10.0-11.0
90.9
0.0
10.0
10.0
3.0
0.0
1.0
0.0
2.0
21.0
San Antonio Spurs
1
37.0
5.0-10.0
50.0
2.0-2.0
100.0
8.0-8.0
100.0
1.0
6.0
7.0
5.0
0.0
0.0
2.0
3.0
20.0
Oklahoma City Thunder
1
27.0
4.0-9.0
44.4
0.0-1.0
0.0
6.0-6.0
100.0
0.0
3.0
3.0
4.0
3.0
1.0
1.0
1.0
14.0
Utah Jazz
1
33.0
5.0-14.0
35.7
2.0-4.0
50.0
10.0-10.0
100.0
0.0
3.0
3.0
6.0
0.0
0.0
1.0
2.0
22.0
Washington Wizards
1
30.0
8.0-13.0
61.5
2.0-3.0
66.7
7.0-8.0
87.5
1.0
3.0
4.0
5.0
0.0
1.0
0.0
2.0
25.0
07 / SEASON-BY-SEASON HISTORY
Career statistics
Regular Season Averages
Season
Team
GP
GS
MIN
FG
FG%
3PT
3P%
FT
FT%
OR
DR
REB
AST
BLK
STL
PF
TO
PTS
2007-08
Seattle Supersonics
80
80
34.6
7.3-17.1
43.0
0.7-2.6
28.8
4.9-5.6
87.3
0.9
3.5
4.4
2.4
0.9
1.0
1.5
2.9
20.3
2008-09
Oklahoma City Thunder
74
74
39.0
8.9-18.8
47.6
1.3-3.1
42.2
6.1-7.1
86.3
1.0
5.5
6.5
2.8
0.7
1.3
1.8
3.0
25.3
2009-10
Oklahoma City Thunder
82
82
39.5
9.7-20.3
47.6
1.6-4.3
36.5
9.2-10.2
90.0
1.3
6.3
7.6
2.8
1.0
1.4
2.1
3.3
30.1
2010-11
Oklahoma City Thunder
78
78
38.9
9.1-19.7
46.2
1.9-5.3
35.0
7.6-8.7
88.0
0.7
6.1
6.8
2.7
1.0
1.1
2.0
2.8
27.7
2011-12
Oklahoma City Thunder
66
66
38.6
9.7-19.7
49.6
2.0-5.2
38.7
6.5-7.6
86.0
0.6
7.4
8.0
3.5
1.2
1.3
2.0
3.8
28.0
2012-13
Oklahoma City Thunder
81
81
38.5
9.0-17.7
51.0
1.7-4.1
41.6
8.4-9.3
90.5
0.6
7.3
7.9
4.6
1.3
1.4
1.8
3.5
28.1
2013-14
Oklahoma City Thunder
81
81
38.5
10.5-20.8
50.3
2.4-6.1
39.1
8.7-9.9
87.3
0.7
6.7
7.4
5.5
0.7
1.3
2.1
3.5
32.0
2014-15
Oklahoma City Thunder
27
27
33.8
8.8-17.3
51.0
2.4-5.9
40.3
5.4-6.3
85.4
0.6
6.0
6.6
4.1
0.9
0.9
1.5
2.7
25.4
2015-16
Oklahoma City Thunder
72
72
35.8
9.7-19.2
50.5
2.6-6.7
38.6
6.2-6.9
89.8
0.6
7.6
8.2
5.0
1.2
1.0
1.9
3.5
28.2
2016-17
Golden State Warriors
62
62
33.4
8.9-16.5
53.7
1.9-5.0
37.5
5.4-6.2
87.5
0.6
7.6
8.3
4.8
1.6
1.1
1.9
2.2
25.1
2017-18
Golden State Warriors
68
68
34.2
9.3-18.0
51.6
2.5-6.1
41.9
5.3-5.9
88.9
0.5
6.4
6.8
5.4
1.8
0.7
2.0
3.0
26.4
2018-19
Golden State Warriors
78
78
34.6
9.2-17.7
52.1
1.8-5.0
35.3
5.7-6.5
88.5
0.4
5.9
6.4
5.9
1.1
0.7
2.0
2.9
26.0
2020-21
Brooklyn Nets
35
32
33.1
9.3-17.2
53.7
2.4-5.4
45.0
6.0-6.8
88.2
0.4
6.7
7.1
5.6
1.3
0.7
2.0
3.4
26.9
2021-22
Brooklyn Nets
55
55
37.2
10.5-20.3
51.8
2.1-5.5
38.3
6.8-7.4
91.0
0.5
6.9
7.4
6.4
0.9
0.9
2.1
3.5
29.9
2022-23
Brooklyn Nets
39
39
36.0
10.5-18.8
55.9
1.8-4.8
37.6
6.8-7.3
93.4
0.4
6.4
6.7
5.3
1.5
0.8
2.4
3.5
29.7
2022-23
Phoenix Suns
8
8
33.6
9.1-16.0
57.0
2.8-5.1
53.7
5.0-6.0
83.3
0.4
6.0
6.4
3.5
1.3
0.3
0.9
2.5
26.0
2022-23
2022 23 Totals
47
47
35.6
10.3-18.3
56.0
2.0-4.9
40.4
6.5-7.1
91.9
0.4
6.3
6.7
5.0
1.4
0.7
2.1
3.3
29.1
2023-24
Phoenix Suns
75
75
37.2
10.0-19.1
52.3
2.2-5.4
41.3
4.8-5.6
85.6
0.5
6.1
6.6
5.0
1.2
0.9
1.8
3.3
27.1
2024-25
Phoenix Suns
62
62
36.5
9.5-18.1
52.7
2.6-6.0
43.0
4.9-5.8
83.9
0.4
5.7
6.0
4.2
1.2
0.8
1.7
3.1
26.6
2025-26
Houston Rockets
78
78
36.4
9.2-17.6
52.0
2.4-5.8
41.3
5.2-6.0
87.4
0.5
4.9
5.5
4.8
0.9
0.8
1.8
3.2
26.0
2026-27
Houston Rockets
15
15
33.5
6.6-13.6
48.5
1.5-3.9
37.3
6.7-7.6
87.7
0.3
5.1
5.5
3.8
1.1
0.5
1.8
2.9
21.3
Career
—
1216
1213
36.7
9.3-18.6
50.3
2.0-5.0
39.1
6.4-7.3
88.2
0.6
6.2
6.9
4.4
1.1
1.0
1.9
3.2
27.1
Regular Season Totals
Season
Team
FG
FG%
3PT
3P%
FT
FT%
OR
DR
REB
AST
BLK
STL
PF
TO
PTS
2007-08
Seattle Supersonics
587-1366
43.0
59-205
28.8
391-448
87.3
70
278
348
192
75
78
122
232
1624
2008-09
Oklahoma City Thunder
661-1390
47.6
97-230
42.2
452-524
86.3
77
405
482
205
53
96
134
225
1871
2009-10
Oklahoma City Thunder
794-1668
47.6
128-351
36.5
756-840
90.0
105
518
623
231
84
112
171
271
2472
2010-11
Oklahoma City Thunder
711-1538
46.2
145-414
35.0
594-675
88.0
57
476
533
214
76
88
159
218
2161
2011-12
Oklahoma City Thunder
643-1297
49.6
133-344
38.7
431-501
86.0
40
487
527
231
77
88
133
248
1850
2012-13
Oklahoma City Thunder
731-1433
51.0
139-334
41.6
679-750
90.5
46
594
640
374
105
116
143
280
2280
2013-14
Oklahoma City Thunder
849-1688
50.3
192-491
39.1
703-805
87.3
58
540
598
445
59
103
174
285
2593
2014-15
Oklahoma City Thunder
238-467
51.0
64-159
40.3
146-171
85.4
16
162
178
110
25
24
40
74
686
2015-16
Oklahoma City Thunder
698-1381
50.5
186-482
38.6
447-498
89.8
45
544
589
361
85
69
137
250
2029
2016-17
Golden State Warriors
551-1026
53.7
117-312
37.5
336-384
87.5
39
474
513
300
99
66
117
138
1555
2017-18
Golden State Warriors
630-1222
51.6
173-413
41.9
359-404
88.9
31
433
464
366
119
50
133
207
1792
2018-19
Golden State Warriors
721-1383
52.1
137-388
35.3
448-506
88.5
33
464
497
457
84
58
155
225
2027
2020-21
Brooklyn Nets
324-603
53.7
85-189
45.0
210-238
88.2
13
234
247
195
45
25
70
120
943
2021-22
Brooklyn Nets
578-1115
51.8
115-300
38.3
372-409
91.0
29
378
407
351
52
48
113
191
1643
2022-23
Brooklyn Nets
410-734
55.9
71-189
37.6
267-286
93.4
14
248
262
207
57
32
92
136
1158
2022-23
Phoenix Suns
73-128
57.0
22-41
53.7
40-48
83.3
3
48
51
28
10
2
7
20
208
2022-23
2022 23 Totals
483-862
56.0
93-230
40.4
307-334
91.9
17
296
313
235
67
34
99
156
1366
2023-24
Phoenix Suns
751-1436
52.3
168-407
41.3
362-423
85.6
41
454
495
378
91
69
133
244
2032
2024-25
Phoenix Suns
592-1124
52.7
160-372
43.0
303-361
83.9
23
351
374
263
77
50
104
190
1647
2025-26
Houston Rockets
716-1376
52.0
186-450
41.3
408-467
87.4
41
385
426
372
71
62
142
246
2026
2026-27
Houston Rockets
99-204
48.5
22-59
37.3
100-114
87.7
5
77
82
57
16
8
27
44
320
Career
—
11357-22579
50.3
2399-6130
39.1
7804-8852
88.2
786
7550
8336
5337
1360
1244
2306
3844
32917
Regular Season Misc Totals
Season
Team
DD2
TD3
DQ
EJECT
TECH
FLAG
AST/TO
STL/TO
SC-EFF
SH-EFF
2007-08
Seattle Supersonics
1
0
0
0
0
0
0.8
0.3
1.189
0.45
2008-09
Oklahoma City Thunder
15
0
0
0
1
0
0.9
0.4
1.346
0.51
2009-10
Oklahoma City Thunder
25
0
1
0
3
0
0.9
0.4
1.482
0.51
2010-11
Oklahoma City Thunder
14
0
1
0
3
0
1.0
0.4
1.405
0.51
2011-12
Oklahoma City Thunder
18
0
0
0
5
0
0.9
0.4
1.426
0.55
2012-13
Oklahoma City Thunder
19
3
1
1
12
1
1.3
0.4
1.591
0.56
2013-14
Oklahoma City Thunder
27
3
0
0
16
0
1.6
0.4
1.536
0.56
2014-15
Oklahoma City Thunder
5
0
0
0
4
1
1.5
0.3
1.469
0.58
2015-16
Oklahoma City Thunder
27
1
1
0
8
0
1.4
0.3
1.469
0.57
2016-17
Golden State Warriors
23
1
0
0
8
1
2.2
0.5
1.516
0.59
2017-18
Golden State Warriors
15
2
0
5
14
0
1.8
0.2
1.466
0.59
2018-19
Golden State Warriors
16
2
1
1
17
0
2.0
0.3
1.466
0.57
2020-21
Brooklyn Nets
12
0
0
0
1
0
1.6
0.2
1.564
0.61
2021-22
Brooklyn Nets
18
4
0
1
8
2
1.8
0.3
1.474
0.57
2022-23
Brooklyn Nets
5
1
1
0
11
1
1.5
0.2
1.578
0.61
2022-23
Phoenix Suns
0
0
0
0
0
0
1.4
0.1
1.625
0.66
2022-23
2022 23 Totals
5
1
1
0
11
1
1.5
0.2
1.585
0.61
2023-24
Phoenix Suns
14
1
0
0
6
2
1.5
0.3
1.415
0.58
2024-25
Phoenix Suns
5
0
0
0
7
0
1.4
0.3
1.465
0.60
2025-26
Houston Rockets
7
0
0
0
9
1
1.5
0.3
1.472
0.59
2026-27
Houston Rockets
2
0
0
0
1
1
1.3
0.2
1.569
0.54
Career
—
268
18
6
8
134
10
1.4
0.3
1.458
0.56
Scoring, rebounding and assist trend
08 / SHOT CHART AND ZONE SHOOTING
Shot profile
Shot-location data is not connected. Add a BALLDONTLIE GOAT-tier NBA API key in NBA Players → Settings to enable shot charts and zone shooting.
LATEST UPDATEDurant closed with 25 points (8-13 FG, 2-3 3Pt, 7-8 FT), four rebounds, five assists and one steal across 30 minutes during Sunday's 147-119 victory over Washington.
Durant needed just 13 field-goal attempts to reach 25 points, highlighting his efficiency in a Houston offense that produced 147 points and 40 assists. The veteran has remained a reliable scoring option despite sharing offensive responsibilities with Alperen Sengun and Amen Thompson. Sunday's relatively modest playing time was a consequence of the lopsided score rather than any apparent limitation, and Durant's ability to contribute efficiently across several categories continues to support his high fantasy floor. He has scored at least 20 points in his last six games, averaging 22.0 points, 6.3 rebounds and 4.8 assists per game in that span.




 Aaron HolidayG
 Alperen SengunC #28
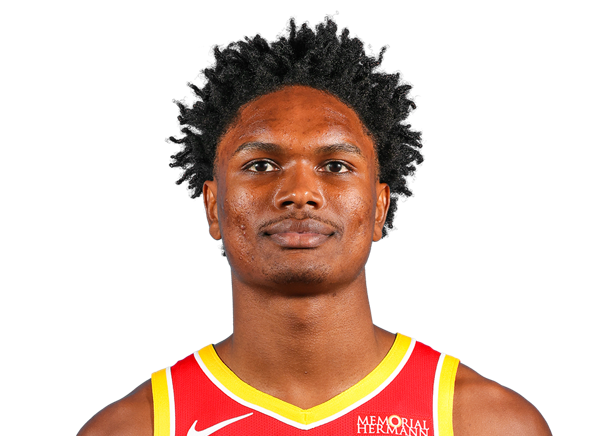 Amen ThompsonG #1
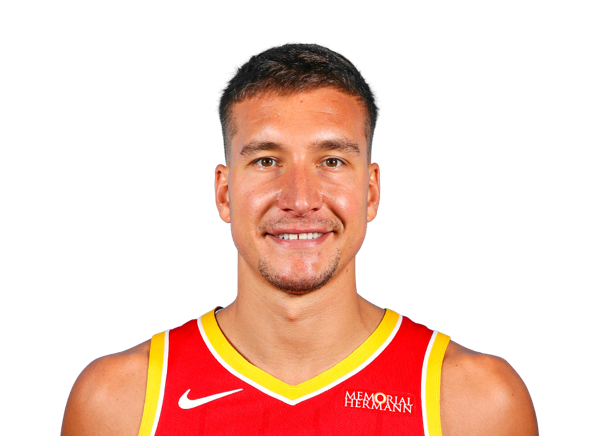 Bogdan BogdanovicG #31
 Bruce ThorntonG #2
 Cameron MatthewsF
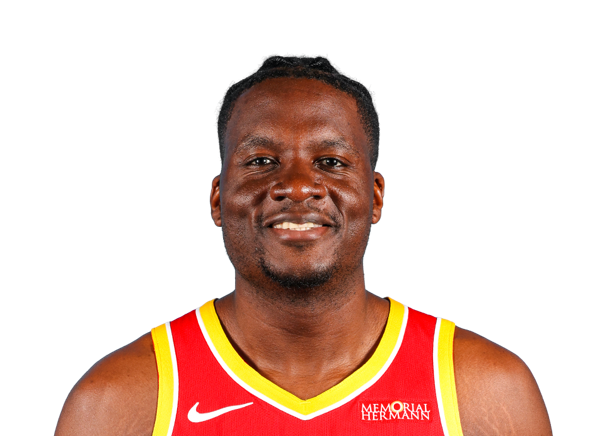 Clint CapelaC #30
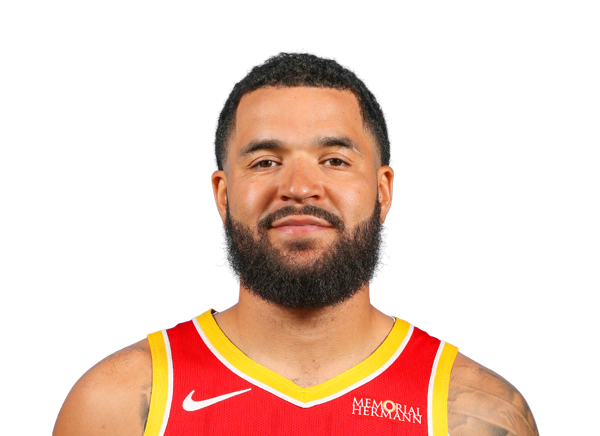 Fred VanVleetG #5
 Isaiah CrawfordF #27
 Jabari Smith Jr.F #10
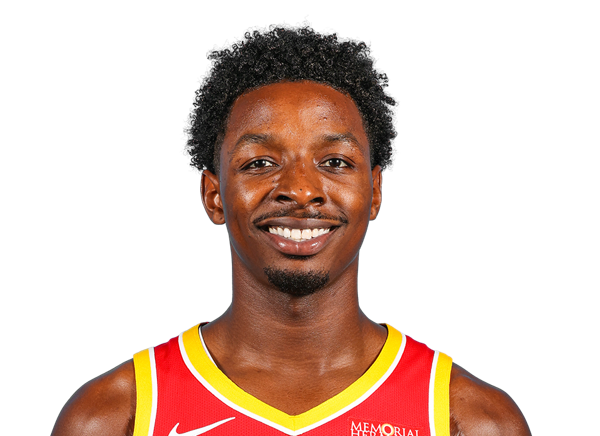 Jae’Sean TateF #8
 Jeff GreenF #32
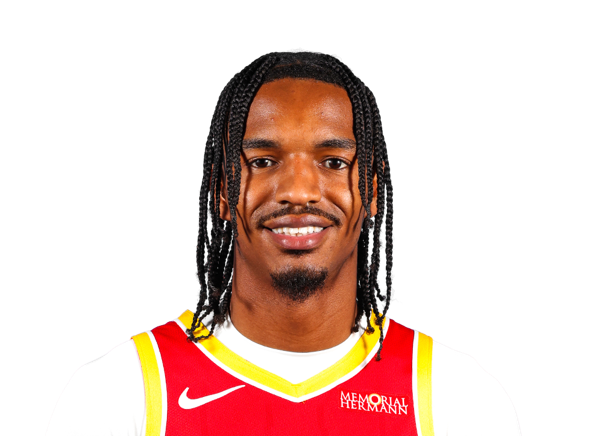 Julian PhillipsF #3
 Marcus SmartG #36
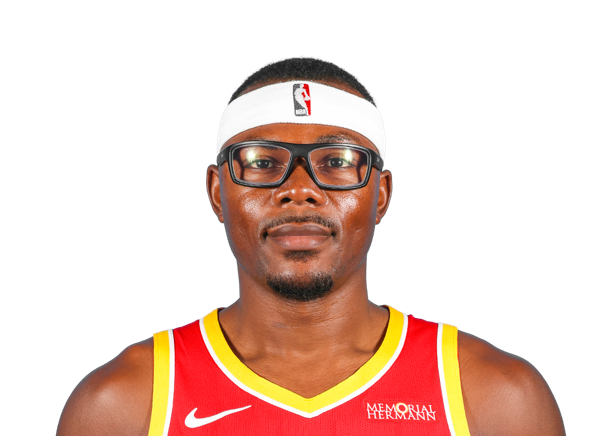 Oscar TshiebweC #9
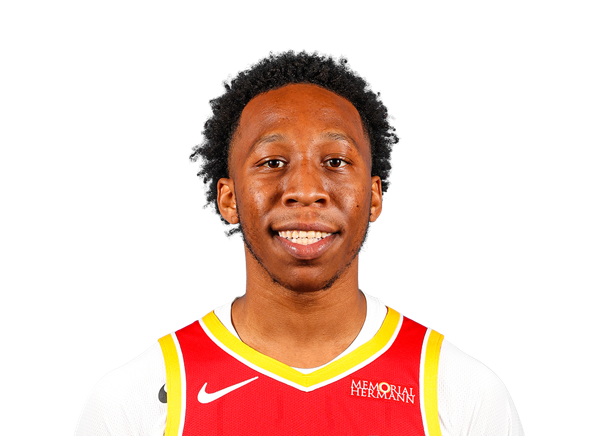 Quadir CopelandG #25
 Reed SheppardG #15
 Steven AdamsC #12
 Tari EasonF #17