Click a season to open this player’s full game log, splits and advanced stats for that year; click a team to open its page. A dash means no NBA games were recorded.
03 / EVERY CATEGORY THE PROVIDER REPORTS
Full statistical breakdown
Regular season 2026-27
Defensive
Metric
Total
NBA rank
Blocks
13
Tied-26th
Defensive Rebounds
101
Tied-8th
Steals
22
13th
Defensive Rebound Rate
0.0
—
Defensive Rebounds Per Game
8.4
5th
Blocks Per Game
1.1
Tied-25th
Steals Per Game
1.8
12th
Defensive Rebounds Per 48
11.0
—
Blocks Per 48
1.4
—
Steals Per 48
2.4
—
General
Metric
Total
NBA rank
Disqualifications
0
Tied-22nd
Flagrant Fouls
0
Tied-24th
Fouls
33
Tied-78th
Player Efficiency Rating
27.62
5th
Rebound Rate
0.0
—
Ejections
0
Tied-7th
Technical Fouls
0
Tied-104th
Rebounds
131
—
Value Over Replacement Player
111.5
—
Minutes
439
—
Minutes Per Game
36.6
—
Rating
52.0
Tied-4th
Plus-Minus
+31
Tied-1st
Rebounds Per Game
10.9
7th
Fouls Per Game
2.8
Tied-62nd
Flagrant Fouls Per Game
0.0
Tied-21st
Technical Fouls Per Game
0.0
Tied-84th
Ejections Per Game
0.0
Tied-6th
Disqualifications Per Game
0.0
Tied-21st
Assist To Turnover Ratio
2.6
—
Steal To Foul Ratio
0.7
—
Block To Foul Ratio
0.4
—
Team Rebounds Per Game
0.0
—
Rebounds
131
—
Total Technical Fouls
0
—
Assist To Turnover Ratio
0.0
—
Steal To Turnover Ratio
0.5
—
Rebounds Per 48 Minutes
14.3
—
Fouls Per 48 Minutes
3.6
—
Flagrant Fouls Per 48 Minutes
0.0
—
Technical Fouls Per 48 Minutes
0.0
—
Ejections Per 48 Minutes
0.0
—
Disqualifications Per 48 Minutes
0.0
—
R/40
11.9
—
Games Played
12
12th
Games Started
12
Tied-72nd
Double Double
10
Tied-3rd
Triple Double
3
1st
Offensive
Metric
Total
NBA rank
Assists
107
5th
Effective Field Goal Percentage
54.6
—
Field Goals
113/219
—
Field Goals Attempted
219
17th
Field Goals Made
113
12th
Field Goal Percentage
51.6
23rd
Free Throws
50/56
—
Free Throw Percentage
89.3
39th
Free Throws Attempted
56
Tied-48th
Free Throws Made
50
Tied-40th
Offensive Rebounds
30
Tied-31st
Points
289
25th
Turnovers
41
Tied-18th
3-Point Field Goal Percentage
26.0
231st
3-Point Field Goals Attempted
50
Tied-126th
3-Point Field Goals Made
13
Tied-168th
True Shooting Percentage
59.3
—
Total Turnovers
41
—
Assist Ratio
27.3
—
Points in the Paint
0
Tied-1st
Offensive Rebound Rate
0.0
—
Turnover Ratio
10.5
—
Brick Index
0.00
—
Usage Rate
0.0
—
Average Field Goals Made
9.4
6th
Average Field Goals Attempted
18.3
457th
Average 3-Point Field Goals Made
1.1
Tied-160th
Average 3-Point Field Goals Attempted
4.2
Tied-111th
Average Free Throws Made
4.2
38th
Average Free Throws Attempted
4.7
43rd
Points Per Game
24.1
19th
Offensive Rebounds Per Game
2.5
Tied-25th
Assists Per Game
8.9
3rd
Turnovers Per Game
3.4
9th
Offensive Rebound Percentage
0.3
—
Estimated Possessions
252.4
—
Estimated Possessions Per Game
21.0
—
Points Per Estimated Possession
1.1
—
Team Turnovers Per Game
0.0
—
Total Turnovers Per Game
3.4
—
3-Point Field Goal Percentage
26.0
172nd
2-Point Field Goals Made
100.0
180th
2-Point Field Goals Attempted
169.0
143rd
2-Point Field Goals Made per Game
8.3
—
2-Point Field Goals Attempted per Game
14.1
—
2-Point Field Goal Percentage
59.2
23rd
Shooting Efficiency
0.55
—
Scoring Efficiency
1.320
—
Fieldgoals Made Per 48
12.4
—
Fieldgoals Attempted Per 48
23.9
—
3-Point Fieldgoals Made Per 48
1.4
—
3-Point Fieldgoals Attempted Per 48
5.5
—
Freethrows Made Per 48
5.5
—
Freethrows Attempted Per 48
6.1
—
Points Scored Per 48
31.6
—
Offensive Rebounds Per 48
3.3
—
Assists Per 48
11.7
—
Turnovers
4.5
—
P/40
26.3
—
A/40
9.7
—
04 / EFFICIENCY, SHOOTING PROFILE, PER-36
Advanced metrics
True shooting %59.2%
Effective FG %54.4%
2-point FG %58.9%
3-point attempt rate23.0%
Free throw rate25.7%
Points per shot attempt1.32
% of points from 3s13.7%
Assist-to-turnover2.62
Points per 36 min23.7
Rebounds per 36 min10.7
Assists per 36 min8.8
Steals per 36 min1.77
Blocks per 36 min1.08
Turnovers per 36 min3.34
Stocks (STL + BLK) per game2.90
Pts + Reb + Ast per game43.9
Efficiency (EFF) per game34.0
Game Score per game (Hollinger)23.4
Minutes per game36.6
Calculated by BallersCulture from the supplied 2026-27 box-score totals using standard formulas (hover a tile to see the formula). Tracking-based metrics such as BPM, VORP, on/off and RAPTOR are not available from this data source.
05 / 12 GAMES IN 2026-27
Game log: Regular season
Date
Opp
Result
MIN
FG
FG%
3PT
3P%
FT
FT%
REB
AST
BLK
STL
PF
TO
PTS
Nov 17
vs PHX
L 117-105
38
12-21
57.1
2-6
33.3
2-2
100.0
15
7
1
1
3
7
28
Nov 15
@ NO
W 116-108
37
9-14
64.3
1-1
100.0
7-7
100.0
8
10
0
3
1
4
26
Nov 12
@ MEM
W 123-118
37
10-16
62.5
1-3
33.3
6-8
75.0
11
8
1
1
3
1
27
Nov 10
@ HOU
L 110-100
39
11-21
52.4
1-5
20.0
2-2
100.0
16
9
2
1
4
3
25
Nov 8
vs IND
W 114-102
36
7-20
35.0
1-3
33.3
4-4
100.0
13
8
1
1
1
1
19
Nov 5
vs TOR
W 128-109
30
13-19
68.4
0-1
0.0
6-7
85.7
10
11
0
3
3
2
32
Nov 3
vs POR
L 118-110
36
10-22
45.5
2-7
28.6
4-4
100.0
9
8
1
4
3
2
26
Oct 31
@ PHX
W 127-120
37
8-13
61.5
0-1
0.0
2-2
100.0
7
10
0
3
2
5
18
Oct 29
@ NO
W 104-91
34
8-13
61.5
0-0
0.0
5-5
100.0
13
10
0
1
4
7
21
Oct 27
vs GS
L 134-114
35
8-18
44.4
1-6
16.7
2-3
66.7
7
11
3
1
1
1
19
Oct 25
vs NO
W 141-135 OT
44
12-23
52.2
3-10
30.0
8-8
100.0
15
10
3
2
5
6
35
Oct 23
@ OKC
L 96-84
35
5-19
26.3
1-7
14.3
2-4
50.0
7
5
1
1
3
2
13
06 / 2026-27 HOME / AWAY, RESULTS, MONTHS AND OPPONENTS
Splits
split
Split
GP
MIN
FG
FG%
3PT
3P%
FT
FT%
OR
DR
REB
AST
BLK
STL
PF
TO
PTS
All Splits
12
36.6
9.4-18.3
51.6
1.1-4.2
26.0
4.2-4.7
89.3
2.5
8.4
10.9
8.9
1.1
1.8
2.8
3.4
24.1
Home
5
36.6
11.0-20.6
53.4
1.6-6.0
26.7
4.4-4.8
91.7
2.6
8.6
11.2
9.4
1.6
2.2
3.0
3.6
28.0
Road
6
36.7
8.5-16.0
53.1
0.7-2.8
23.5
4.0-4.7
85.7
1.8
8.5
10.3
8.7
0.7
1.7
2.8
3.7
21.7
vs. Division
2
35.5
7.5-20.5
36.6
1.5-7.0
21.4
3.0-4.0
75.0
1.0
7.0
8.0
6.5
1.0
2.5
3.0
2.0
19.5
vs. Conference
10
37.2
9.3-18.0
51.7
1.2-4.6
26.1
4.0-4.5
88.9
2.1
8.7
10.8
8.8
1.2
1.8
2.9
3.8
23.8
3+ Days Rest
1
35.0
5.0-19.0
26.3
1.0-7.0
14.3
2.0-4.0
50.0
1.0
6.0
7.0
5.0
1.0
1.0
3.0
2.0
13.0
Month
Split
GP
MIN
FG
FG%
3PT
3P%
FT
FT%
OR
DR
REB
AST
BLK
STL
PF
TO
PTS
October
5
37.2
8.2-17.2
47.7
1.0-4.8
20.8
3.8-4.4
86.4
2.4
7.4
9.8
9.2
1.4
1.6
3.0
4.2
21.2
November
7
36.1
10.3-19.0
54.1
1.1-3.7
30.8
4.4-4.9
91.2
2.6
9.1
11.7
8.7
0.9
2.0
2.6
2.9
26.1
Pre All-Star
12
36.6
9.4-18.3
51.6
1.1-4.2
26.0
4.2-4.7
89.3
2.5
8.4
10.9
8.9
1.1
1.8
2.8
3.4
24.1
Result
Split
GP
MIN
FG
FG%
3PT
3P%
FT
FT%
OR
DR
REB
AST
BLK
STL
PF
TO
PTS
Wins
7
36.4
9.6-16.9
56.8
0.9-2.7
31.6
5.4-5.9
92.7
3.0
8.0
11.0
9.6
0.7
2.0
2.7
3.7
25.4
Losses
5
36.6
9.2-20.2
45.5
1.4-6.2
22.6
2.4-3.0
80.0
1.8
9.0
10.8
8.0
1.6
1.6
2.8
3.0
22.2
Position
Split
GP
MIN
FG
FG%
3PT
3P%
FT
FT%
OR
DR
REB
AST
BLK
STL
PF
TO
PTS
As Starter
12
36.6
9.4-18.3
51.6
1.1-4.2
26.0
4.2-4.7
89.3
2.5
8.4
10.9
8.9
1.1
1.8
2.8
3.4
24.1
Day
Split
GP
MIN
FG
FG%
3PT
3P%
FT
FT%
OR
DR
REB
AST
BLK
STL
PF
TO
PTS
Monday
4
37.0
10.3-20.5
50.0
1.5-6.0
25.0
2.5-2.8
90.9
2.0
9.8
11.8
8.8
1.8
1.8
2.8
3.3
24.5
Wednesday
3
33.7
10.3-16.0
64.6
0.3-1.3
25.0
5.7-6.7
85.0
2.3
9.0
11.3
9.7
0.3
1.7
3.3
3.3
26.7
Thursday
1
35.0
5.0-19.0
26.3
1.0-7.0
14.3
2.0-4.0
50.0
1.0
6.0
7.0
5.0
1.0
1.0
3.0
2.0
13.0
Friday
1
37.0
8.0-13.0
61.5
0.0-1.0
0.0
2.0-2.0
100.0
3.0
4.0
7.0
10.0
0.0
3.0
2.0
5.0
18.0
Saturday
3
39.0
9.3-19.0
49.1
1.7-4.7
35.7
6.3-6.3
100.0
3.7
8.3
12.0
9.3
1.3
2.0
2.3
3.7
26.7
Opponent
Split
GP
MIN
FG
FG%
3PT
3P%
FT
FT%
OR
DR
REB
AST
BLK
STL
PF
TO
PTS
Golden State Warriors
1
35.0
8.0-18.0
44.4
1.0-6.0
16.7
2.0-3.0
66.7
2.0
5.0
7.0
11.0
3.0
1.0
1.0
1.0
19.0
Houston Rockets
1
39.0
11.0-21.0
52.4
1.0-5.0
20.0
2.0-2.0
100.0
2.0
14.0
16.0
9.0
2.0
1.0
4.0
3.0
25.0
Indiana Pacers
1
36.0
7.0-20.0
35.0
1.0-3.0
33.3
4.0-4.0
100.0
6.0
7.0
13.0
8.0
1.0
1.0
1.0
1.0
19.0
Memphis Grizzlies
1
37.0
10.0-16.0
62.5
1.0-3.0
33.3
6.0-8.0
75.0
2.0
9.0
11.0
8.0
1.0
1.0
3.0
1.0
27.0
New Orleans Pelicans
3
38.3
9.7-16.7
58.0
1.3-3.7
36.4
6.7-6.7
100.0
2.3
9.7
12.0
10.0
1.0
2.0
3.3
5.7
27.3
Phoenix Suns
2
37.5
10.0-17.0
58.8
1.0-3.5
28.6
2.0-2.0
100.0
3.0
8.0
11.0
8.5
0.5
2.0
2.5
6.0
23.0
Portland Trail Blazers
1
36.0
10.0-22.0
45.5
2.0-7.0
28.6
4.0-4.0
100.0
1.0
8.0
9.0
8.0
1.0
4.0
3.0
2.0
26.0
Oklahoma City Thunder
1
35.0
5.0-19.0
26.3
1.0-7.0
14.3
2.0-4.0
50.0
1.0
6.0
7.0
5.0
1.0
1.0
3.0
2.0
13.0
Toronto Raptors
1
30.0
13.0-19.0
68.4
0.0-1.0
0.0
6.0-7.0
85.7
3.0
7.0
10.0
11.0
0.0
3.0
3.0
2.0
32.0
07 / SEASON-BY-SEASON HISTORY
Career statistics
Regular Season Averages
Season
Team
GP
GS
MIN
FG
FG%
3PT
3P%
FT
FT%
OR
DR
REB
AST
BLK
STL
PF
TO
PTS
2015-16
Denver Nuggets
80
55
21.7
3.8-7.5
51.2
0.4-1.1
33.3
1.9-2.4
81.1
2.3
4.7
7.0
2.4
0.6
1.0
2.6
1.3
10.0
2016-17
Denver Nuggets
73
59
27.9
6.8-11.7
57.8
0.6-1.9
32.4
2.6-3.1
82.5
2.9
6.9
9.8
4.9
0.8
0.8
2.9
2.3
16.7
2017-18
Denver Nuggets
75
73
32.5
6.7-13.5
49.9
1.5-3.7
39.6
3.5-4.2
85.0
2.6
8.1
10.7
6.1
0.8
1.2
2.8
2.8
18.5
2018-19
Denver Nuggets
80
80
31.3
7.7-15.1
51.1
1.0-3.4
30.7
3.6-4.4
82.1
2.9
8.0
10.8
7.3
0.7
1.4
2.9
3.1
20.1
2019-20
Denver Nuggets
73
73
32.0
7.7-14.7
52.8
1.1-3.5
31.4
3.4-4.1
81.7
2.3
7.5
9.7
7.0
0.6
1.2
3.0
3.1
19.9
2020-21
Denver Nuggets
72
72
34.6
10.2-18.0
56.6
1.3-3.3
38.8
4.8-5.5
86.8
2.8
8.0
10.8
8.3
0.7
1.3
2.7
3.1
26.4
2021-22
Denver Nuggets
74
74
33.5
10.3-17.7
58.3
1.3-3.9
33.7
5.1-6.3
81.0
2.8
11.0
13.8
7.9
0.9
1.5
2.6
3.8
27.1
2022-23
Denver Nuggets
69
69
33.7
9.4-14.8
63.2
0.8-2.2
38.3
4.9-6.0
82.2
2.4
9.4
11.8
9.8
0.7
1.3
2.5
3.6
24.5
2023-24
Denver Nuggets
79
79
34.6
10.4-17.9
58.3
1.1-2.9
35.9
4.5-5.5
81.7
2.8
9.5
12.4
9.0
0.9
1.4
2.5
3.0
26.4
2024-25
Denver Nuggets
70
70
36.7
11.2-19.5
57.6
2.0-4.7
41.7
5.2-6.4
80.0
2.9
9.9
12.7
10.2
0.6
1.8
2.3
3.3
29.6
2025-26
Denver Nuggets
65
65
34.8
9.9-17.4
56.9
1.7-4.5
38.0
6.1-7.4
83.1
3.0
9.9
12.9
10.7
0.8
1.4
2.7
3.7
27.7
2026-27
Denver Nuggets
12
12
36.6
9.4-18.3
51.6
1.1-4.2
26.0
4.2-4.7
89.3
2.5
8.4
10.9
8.9
1.1
1.8
2.8
3.4
24.1
Career
—
822
781
32.1
8.5-15.2
56.0
1.1-3.2
36.0
4.1-5.0
82.6
2.7
8.4
11.1
7.5
0.7
1.3
2.7
3.0
22.3
Regular Season Totals
Season
Team
FG
FG%
3PT
3P%
FT
FT%
OR
DR
REB
AST
BLK
STL
PF
TO
PTS
2015-16
Denver Nuggets
307-600
51.2
28-84
33.3
154-190
81.1
181
379
560
189
50
79
208
104
796
2016-17
Denver Nuggets
494-854
57.8
45-139
32.4
188-228
82.5
212
506
718
359
55
61
214
171
1221
2017-18
Denver Nuggets
504-1010
49.9
111-280
39.6
266-313
85.0
195
608
803
458
61
90
212
210
1385
2018-19
Denver Nuggets
616-1206
51.1
83-270
30.7
289-352
82.1
228
637
865
580
55
108
228
248
1604
2019-20
Denver Nuggets
565-1071
52.8
80-255
31.4
246-301
81.7
166
545
711
512
44
85
222
226
1456
2020-21
Denver Nuggets
732-1293
56.6
92-237
38.8
342-394
86.8
205
575
780
599
48
95
192
222
1898
2021-22
Denver Nuggets
764-1311
58.3
97-288
33.7
379-468
81.0
206
813
1019
584
63
109
191
281
2004
2022-23
Denver Nuggets
646-1022
63.2
57-149
38.3
341-415
82.2
167
650
817
678
47
87
174
247
1690
2023-24
Denver Nuggets
822-1411
58.3
83-231
35.9
358-438
81.7
223
753
976
708
68
108
194
237
2085
2024-25
Denver Nuggets
786-1364
57.6
138-331
41.7
361-451
80.0
200
692
892
716
45
127
160
230
2071
2025-26
Denver Nuggets
644-1132
56.9
112-295
38.0
399-480
83.1
192
644
836
697
53
92
173
243
1799
2026-27
Denver Nuggets
113-219
51.6
13-50
26.0
50-56
89.3
30
101
131
107
13
22
33
41
289
Career
—
6993-12493
56.0
939-2609
36.0
3373-4086
82.6
2205
6903
9108
6187
602
1063
2201
2460
18298
Regular Season Misc Totals
Season
Team
DD2
TD3
DQ
EJECT
TECH
FLAG
AST/TO
STL/TO
SC-EFF
SH-EFF
2015-16
Denver Nuggets
16
0
3
0
2
0
1.8
0.8
1.327
0.54
2016-17
Denver Nuggets
39
6
1
0
3
1
2.1
0.4
1.430
0.60
2017-18
Denver Nuggets
38
10
2
2
5
1
2.2
0.4
1.371
0.55
2018-19
Denver Nuggets
56
12
2
3
9
0
2.3
0.4
1.330
0.55
2019-20
Denver Nuggets
43
13
1
0
4
0
2.3
0.4
1.359
0.56
2020-21
Denver Nuggets
60
16
0
0
6
0
2.7
0.4
1.468
0.60
2021-22
Denver Nuggets
66
19
0
2
11
0
2.1
0.4
1.529
0.62
2022-23
Denver Nuggets
58
29
0
0
4
0
2.7
0.4
1.654
0.66
2023-24
Denver Nuggets
68
25
1
2
7
1
3.0
0.5
1.478
0.61
2024-25
Denver Nuggets
59
34
0
0
1
0
3.1
0.6
1.518
0.63
2025-26
Denver Nuggets
55
34
0
0
4
2
2.9
0.4
1.589
0.62
2026-27
Denver Nuggets
10
3
0
0
0
0
2.6
0.5
1.320
0.55
Career
—
568
201
10
9
56
5
2.5
0.4
1.465
0.60
Scoring, rebounding and assist trend
08 / SHOT CHART AND ZONE SHOOTING
Shot profile
Shot-location data is not connected. Add a BALLDONTLIE GOAT-tier NBA API key in NBA Players → Settings to enable shot charts and zone shooting.
LATEST UPDATEJokic produced 28 points (12-21 FG, 2-6 3Pt, 2-2 FT), 15 rebounds, seven assists, one steal and one block in 38 minutes during Monday's 117-105 loss to Phoenix.
Jokic tied with Jamal Murray for the team lead in scoring, and the big man led Denver in rebounds on the way to a double-double. However, his stellar effort wasn't enough to carry the Nuggets to a victory. Jokic continues to put up strong numbers across the board and is averaging 25.0 points, 12.6 rebounds, 8.4 assists, 1.4 steals and 1.0 blocks over his last five games.




 Aaron GordonF #32
 Alpha DialloF #11
 Au’Diese ToneyG
 Bryce HopkinsF #13
 Cam WhitmoreF #00
 Cameron JohnsonF #23
 Christian BraunG
 Coleman HawkinsF #43
 Dane GoodwinG #20
 DaRon Holmes IIF #14
 David RoddyF #45
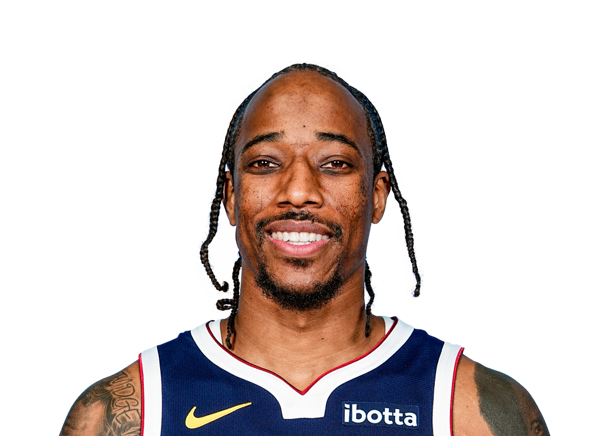 DeMar DeRozanG #10
 Emanuel MillerF #8
 Jamal MurrayG #27
 Jonas ValanciunasC #17
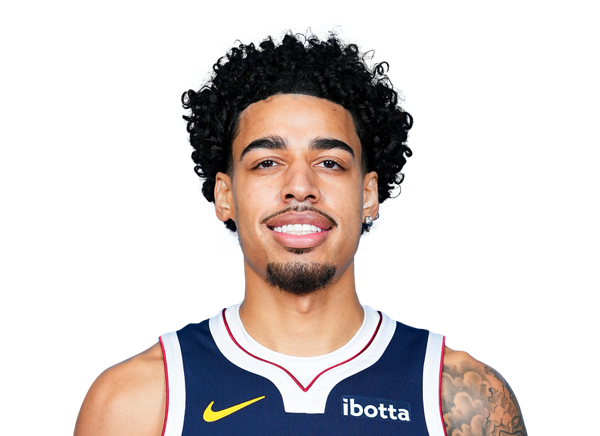 Julian StrawtherG #1
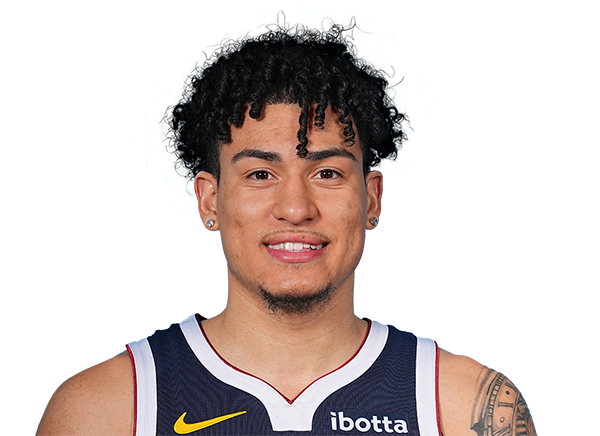 KJ SimpsonG #25
 Lonnie Walker IVG #4
 Marvin Bagley IIIF #3
 Popeye JonesC
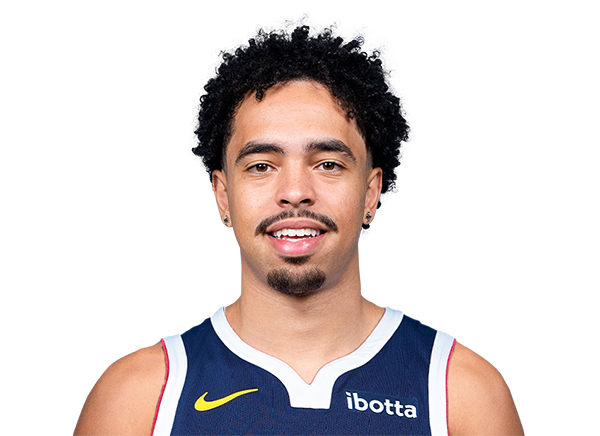 Ryan NembhardG #9
 Spencer JonesF #21
 Steven CrowlC
 Trevon BrazileF #7
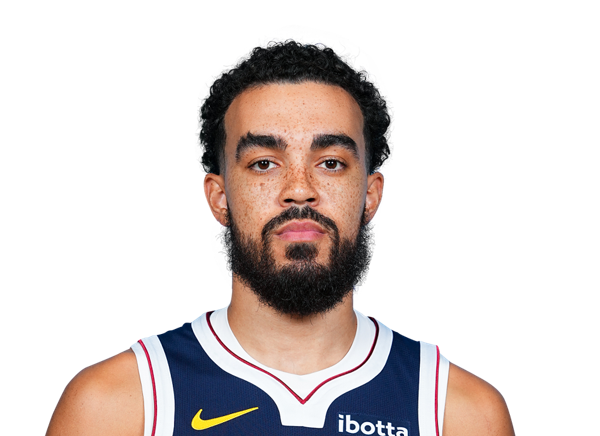 Tyus JonesG #5
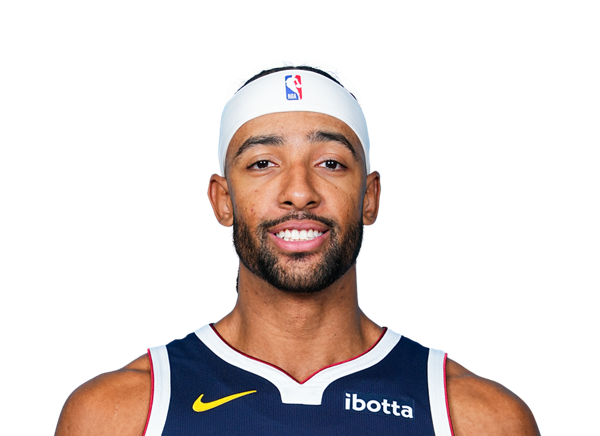 Zeke NnajiF #22