Click a season to open this player’s full game log, splits and advanced stats for that year; click a team to open its page. A dash means no NBA games were recorded.
03 / EVERY CATEGORY THE PROVIDER REPORTS
Full statistical breakdown
Regular season 2026-27
Defensive
Metric
Total
NBA rank
Blocks
0
Tied-376th
Defensive Rebounds
1
Tied-435th
Steals
0
Tied-405th
Defensive Rebound Rate
0.0
—
Defensive Rebounds Per Game
0.5
—
Blocks Per Game
0.0
—
Steals Per Game
0.0
—
Defensive Rebounds Per 48
6.9
2,610th
Blocks Per 48
0.0
2,256th
Steals Per 48
0.0
2,430th
General
Metric
Total
NBA rank
Disqualifications
0
Tied-22nd
Flagrant Fouls
0
Tied-24th
Fouls
1
Tied-425th
Player Efficiency Rating
41.51
—
Rebound Rate
0.0
—
Ejections
0
Tied-7th
Technical Fouls
0
Tied-104th
Rebounds
1
—
Value Over Replacement Player
0.0
—
Minutes
7
Tied-8th
Minutes Per Game
3.5
—
Rating
5.3
Tied-1,152nd
Plus-Minus
-6
Tied-1st
Rebounds Per Game
0.5
—
Fouls Per Game
0.5
—
Flagrant Fouls Per Game
0.0
—
Technical Fouls Per Game
0.0
—
Ejections Per Game
0.0
—
Disqualifications Per Game
0.0
—
Assist To Turnover Ratio
0.0
—
Steal To Foul Ratio
0.0
—
Block To Foul Ratio
0.0
—
Team Rebounds Per Game
0.0
—
Rebounds
1
—
Total Technical Fouls
0
—
Assist To Turnover Ratio
0.0
—
Steal To Turnover Ratio
0.0
—
Rebounds Per 48 Minutes
6.9
—
Fouls Per 48 Minutes
6.9
2,550th
Flagrant Fouls Per 48 Minutes
0.0
144th
Technical Fouls Per 48 Minutes
0.0
624th
Ejections Per 48 Minutes
0.0
42nd
Disqualifications Per 48 Minutes
0.0
132nd
R/40
5.7
—
Games Played
2
2nd
Games Started
0
Tied-258th
Double Double
0
Tied-121st
Triple Double
0
Tied-13th
Offensive
Metric
Total
NBA rank
Assists
0
Tied-434th
Effective Field Goal Percentage
150.0
—
Field Goals
1/1
—
Field Goals Attempted
1
Tied-455th
Field Goals Made
1
Tied-435th
Field Goal Percentage
100.0
—
Free Throws
4/4
—
Free Throw Percentage
100.0
—
Free Throws Attempted
4
Tied-338th
Free Throws Made
4
Tied-312th
Offensive Rebounds
0
Tied-427th
Points
7
Tied-419th
Turnovers
0
Tied-438th
3-Point Field Goal Percentage
100.0
—
3-Point Field Goals Attempted
1
Tied-397th
3-Point Field Goals Made
1
Tied-353rd
True Shooting Percentage
126.8
—
Total Turnovers
0
—
Assist Ratio
0.0
—
Points in the Paint
0
Tied-1st
Offensive Rebound Rate
0.0
—
Turnover Ratio
0.0
—
Brick Index
0.00
—
Usage Rate
0.0
—
Average Field Goals Made
0.5
—
Average Field Goals Attempted
0.5
—
Average 3-Point Field Goals Made
0.5
—
Average 3-Point Field Goals Attempted
0.5
—
Average Free Throws Made
2.0
—
Average Free Throws Attempted
2.0
—
Points Per Game
3.5
—
Offensive Rebounds Per Game
0.0
—
Assists Per Game
0.0
—
Turnovers Per Game
0.0
—
Offensive Rebound Percentage
0.0
—
Estimated Possessions
2.6
—
Estimated Possessions Per Game
1.3
—
Points Per Estimated Possession
2.7
—
Team Turnovers Per Game
0.0
—
Total Turnovers Per Game
0.0
—
3-Point Field Goal Percentage
100.0
—
2-Point Field Goals Made
0.0
Tied-82nd
2-Point Field Goals Attempted
0.0
Tied-58th
2-Point Field Goals Made per Game
0.0
—
2-Point Field Goals Attempted per Game
0.0
—
2-Point Field Goal Percentage
0.0
—
Shooting Efficiency
1.50
—
Scoring Efficiency
7.000
—
Fieldgoals Made Per 48
6.9
2,610th
Fieldgoals Attempted Per 48
6.9
2,730th
3-Point Fieldgoals Made Per 48
6.9
2,118th
3-Point Fieldgoals Attempted Per 48
6.9
2,382nd
Freethrows Made Per 48
27.4
1,872nd
Freethrows Attempted Per 48
27.4
2,028th
Points Scored Per 48
48.0
2,514th
Offensive Rebounds Per 48
0.0
2,562nd
Assists Per 48
0.0
2,604th
Turnovers
0.0
2,628th
P/40
40.0
—
A/40
0.0
—
04 / EFFICIENCY, SHOOTING PROFILE, PER-36
Advanced metrics
True shooting %126.8%
Effective FG %150.0%
3-point attempt rate100.0%
Free throw rate400.0%
Points per shot attempt7.00
% of points from 3s42.9%
Points per 36 min36.0
Rebounds per 36 min5.1
Assists per 36 min0.0
Steals per 36 min0.00
Blocks per 36 min0.00
Turnovers per 36 min0.00
Stocks (STL + BLK) per game0.00
Pts + Reb + Ast per game4.0
Efficiency (EFF) per game4.0
Game Score per game (Hollinger)3.3
Minutes per game3.5
Calculated by BallersCulture from the supplied 2026-27 box-score totals using standard formulas (hover a tile to see the formula). Tracking-based metrics such as BPM, VORP, on/off and RAPTOR are not available from this data source.
05 / 2 GAMES IN 2026-27
Game log: Regular season
Date
Opp
Result
MIN
FG
FG%
3PT
3P%
FT
FT%
REB
AST
BLK
STL
PF
TO
PTS
Nov 5
vs TOR
W 128-109
4
0-0
0.0
0-0
0.0
2-2
100.0
0
0
0
0
1
0
2
Oct 27
vs GS
L 134-114
4
1-1
100.0
1-1
100.0
2-2
100.0
1
0
0
0
0
0
5
06 / 2026-27 HOME / AWAY, RESULTS, MONTHS AND OPPONENTS
Splits
split
Split
GP
MIN
FG
FG%
3PT
3P%
FT
FT%
OR
DR
REB
AST
BLK
STL
PF
TO
PTS
All Splits
2
3.5
0.5-0.5
100.0
0.5-0.5
100.0
2.0-2.0
100.0
0.0
0.5
0.5
0.0
0.0
0.0
0.5
0.0
3.5
Home
2
3.5
0.5-0.5
100.0
0.5-0.5
100.0
2.0-2.0
100.0
0.0
0.5
0.5
0.0
0.0
0.0
0.5
0.0
3.5
vs. Conference
1
4.0
1.0-1.0
100.0
1.0-1.0
100.0
2.0-2.0
100.0
0.0
1.0
1.0
0.0
0.0
0.0
0.0
0.0
5.0
3+ Days Rest
2
3.5
0.5-0.5
100.0
0.5-0.5
100.0
2.0-2.0
100.0
0.0
0.5
0.5
0.0
0.0
0.0
0.5
0.0
3.5
Month
Split
GP
MIN
FG
FG%
3PT
3P%
FT
FT%
OR
DR
REB
AST
BLK
STL
PF
TO
PTS
October
1
4.0
1.0-1.0
100.0
1.0-1.0
100.0
2.0-2.0
100.0
0.0
1.0
1.0
0.0
0.0
0.0
0.0
0.0
5.0
November
1
4.0
0.0-0.0
0.0
0.0-0.0
0.0
2.0-2.0
100.0
0.0
0.0
0.0
0.0
0.0
0.0
1.0
0.0
2.0
Pre All-Star
2
3.5
0.5-0.5
100.0
0.5-0.5
100.0
2.0-2.0
100.0
0.0
0.5
0.5
0.0
0.0
0.0
0.5
0.0
3.5
Result
Split
GP
MIN
FG
FG%
3PT
3P%
FT
FT%
OR
DR
REB
AST
BLK
STL
PF
TO
PTS
Wins
1
4.0
0.0-0.0
0.0
0.0-0.0
0.0
2.0-2.0
100.0
0.0
0.0
0.0
0.0
0.0
0.0
1.0
0.0
2.0
Losses
1
4.0
1.0-1.0
100.0
1.0-1.0
100.0
2.0-2.0
100.0
0.0
1.0
1.0
0.0
0.0
0.0
0.0
0.0
5.0
Day
Split
GP
MIN
FG
FG%
3PT
3P%
FT
FT%
OR
DR
REB
AST
BLK
STL
PF
TO
PTS
Monday
1
4.0
1.0-1.0
100.0
1.0-1.0
100.0
2.0-2.0
100.0
0.0
1.0
1.0
0.0
0.0
0.0
0.0
0.0
5.0
Wednesday
1
4.0
0.0-0.0
0.0
0.0-0.0
0.0
2.0-2.0
100.0
0.0
0.0
0.0
0.0
0.0
0.0
1.0
0.0
2.0
Opponent
Split
GP
MIN
FG
FG%
3PT
3P%
FT
FT%
OR
DR
REB
AST
BLK
STL
PF
TO
PTS
Golden State Warriors
1
4.0
1.0-1.0
100.0
1.0-1.0
100.0
2.0-2.0
100.0
0.0
1.0
1.0
0.0
0.0
0.0
0.0
0.0
5.0
Toronto Raptors
1
4.0
0.0-0.0
0.0
0.0-0.0
0.0
2.0-2.0
100.0
0.0
0.0
0.0
0.0
0.0
0.0
1.0
0.0
2.0
07 / SEASON-BY-SEASON HISTORY
Career statistics
Regular Season Averages
Season
Team
GP
GS
MIN
FG
FG%
3PT
3P%
FT
FT%
OR
DR
REB
AST
BLK
STL
PF
TO
PTS
2020-21
Denver Nuggets
42
1
9.5
1.2-2.5
48.1
0.6-1.4
40.7
0.3-0.4
80.0
0.3
1.2
1.5
0.2
0.1
0.2
0.7
0.2
3.2
2021-22
Denver Nuggets
41
1
17.0
2.3-4.5
51.6
0.9-2.0
46.3
1.0-1.6
63.1
1.4
2.2
3.6
0.4
0.3
0.4
1.9
0.6
6.6
2022-23
Denver Nuggets
53
5
13.7
2.1-3.7
56.1
0.3-1.2
26.2
0.8-1.2
64.5
1.2
1.4
2.6
0.3
0.4
0.3
2.0
0.6
5.2
2023-24
Denver Nuggets
58
0
9.9
1.2-2.6
46.3
0.1-0.4
26.1
0.7-1.1
67.7
1.1
1.1
2.2
0.6
0.7
0.3
1.4
0.5
3.2
2024-25
Denver Nuggets
57
4
10.7
1.2-2.5
49.6
0.3-0.9
32.7
0.5-0.8
61.4
0.6
1.0
1.6
0.4
0.7
0.4
1.1
0.2
3.2
2025-26
Denver Nuggets
52
4
12.0
1.4-2.9
47.0
0.3-1.0
25.9
0.7-0.8
77.3
0.6
2.0
2.6
0.6
0.5
0.3
1.4
0.5
3.7
2026-27
Denver Nuggets
2
0
3.5
0.5-0.5
100.0
0.5-0.5
100.0
2.0-2.0
100.0
0.0
0.5
0.5
0.0
0.0
0.0
0.5
0.0
3.5
Career
—
305
15
11.9
1.5-3.0
50.3
0.4-1.1
34.7
0.7-1.0
67.6
0.9
1.4
2.3
0.4
0.5
0.3
1.4
0.4
4.1
Regular Season Totals
Season
Team
FG
FG%
3PT
3P%
FT
FT%
OR
DR
REB
AST
BLK
STL
PF
TO
PTS
2020-21
Denver Nuggets
50-104
48.1
24-59
40.7
12-15
80.0
14
51
65
10
4
8
29
7
136
2021-22
Denver Nuggets
96-186
51.6
37-80
46.3
41-65
63.1
56
91
147
17
13
16
79
23
270
2022-23
Denver Nuggets
110-196
56.1
17-65
26.2
40-62
64.5
65
73
138
18
23
17
105
31
277
2023-24
Denver Nuggets
69-149
46.3
6-23
26.1
42-62
67.7
61
64
125
32
38
15
81
27
186
2024-25
Denver Nuggets
70-141
49.6
17-52
32.7
27-44
61.4
33
57
90
23
38
25
62
14
184
2025-26
Denver Nuggets
71-151
47.0
14-54
25.9
34-44
77.3
33
103
136
29
24
17
71
27
190
2026-27
Denver Nuggets
1-1
100.0
1-1
100.0
4-4
100.0
0
1
1
0
0
0
1
0
7
Career
—
467-928
50.3
116-334
34.7
200-296
67.6
262
440
702
129
140
98
428
129
1250
Regular Season Misc Totals
Season
Team
DD2
TD3
DQ
EJECT
TECH
FLAG
AST/TO
STL/TO
SC-EFF
SH-EFF
2020-21
Denver Nuggets
0
0
0
0
1
0
1.4
1.1
1.308
0.60
2021-22
Denver Nuggets
0
0
0
0
1
0
0.7
0.7
1.452
0.62
2022-23
Denver Nuggets
1
0
1
0
0
0
0.6
0.5
1.413
0.60
2023-24
Denver Nuggets
0
0
0
0
0
0
1.2
0.6
1.248
0.48
2024-25
Denver Nuggets
0
0
0
0
0
0
1.6
1.8
1.305
0.56
2025-26
Denver Nuggets
2
0
0
0
1
0
1.1
0.6
1.258
0.52
2026-27
Denver Nuggets
0
0
0
0
0
0
0.0
0.0
7.000
1.50
Career
—
3
0
1
0
3
0
1.0
0.8
1.347
0.57
Scoring, rebounding and assist trend
08 / SHOT CHART AND ZONE SHOOTING
Shot profile
Shot-location data is not connected. Add a BALLDONTLIE GOAT-tier NBA API key in NBA Players → Settings to enable shot charts and zone shooting.
LATEST UPDATENnaji (coach's decision) did not play in Thursday's 96-84 loss to Oklahoma City.
Nnaji was left out of Denver's rotation, with the team using Marvin Bagley and Trevon Brazile off the bench. With both players ahead of him in the frontcourt pecking order, Nnaji appears unlikely to provide consistent fantasy production without a change in his role.


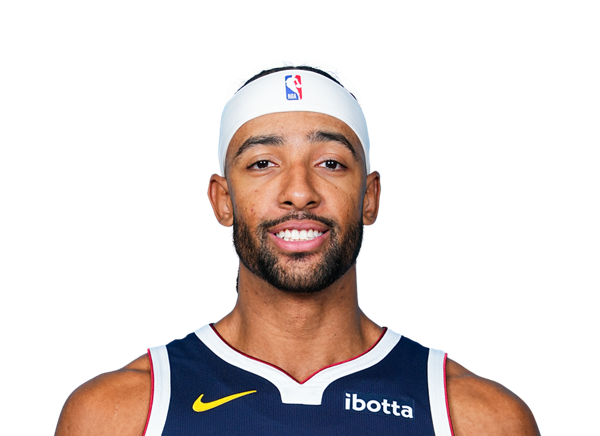

 Aaron GordonF #32
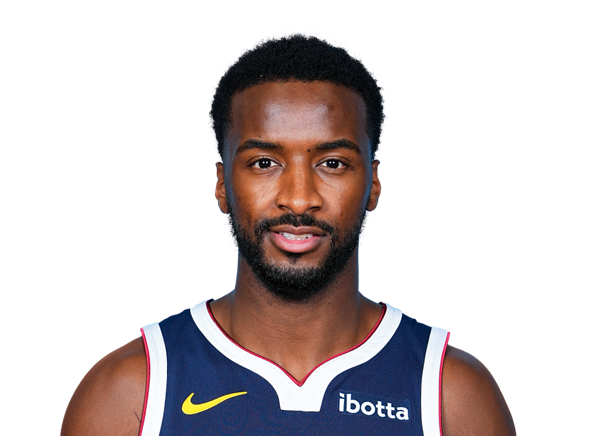 Alpha DialloF #11
 Au’Diese ToneyG
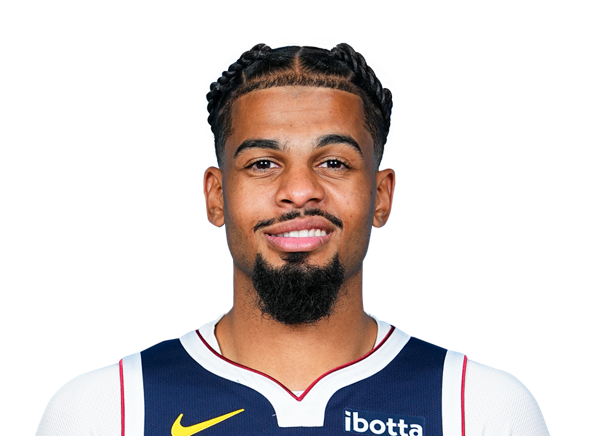 Bryce HopkinsF #13
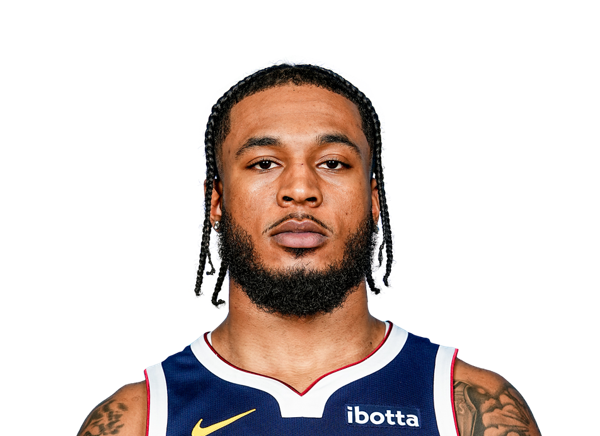 Cam WhitmoreF #00
 Cameron JohnsonF #23
 Christian BraunG
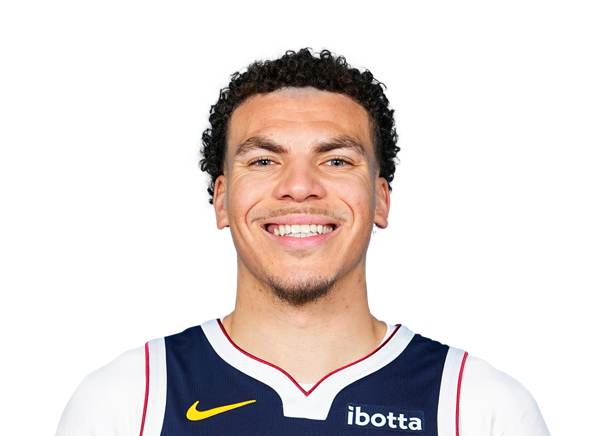 Coleman HawkinsF #43
 Dane GoodwinG #20
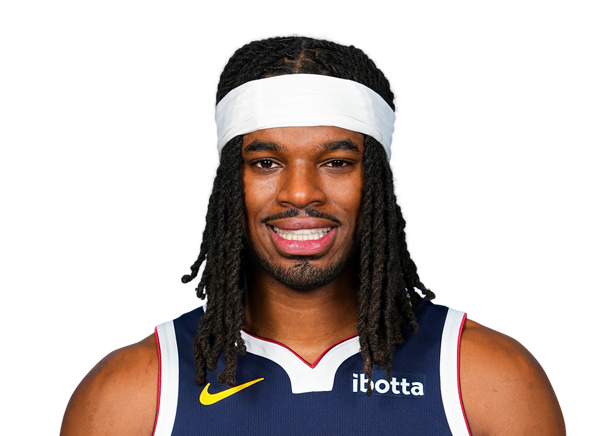 DaRon Holmes IIF #14
 David RoddyF #45
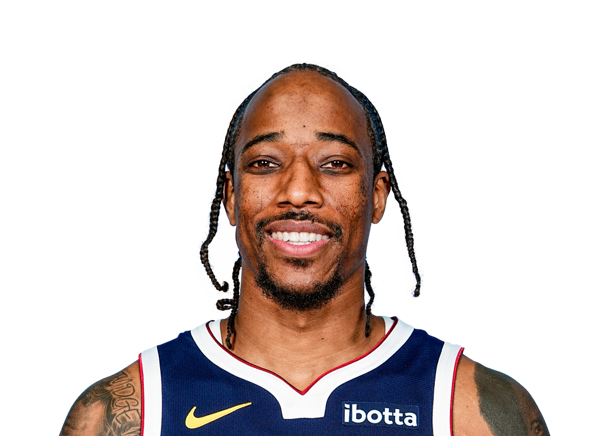 DeMar DeRozanG #10
 Emanuel MillerF #8
 Jamal MurrayG #27
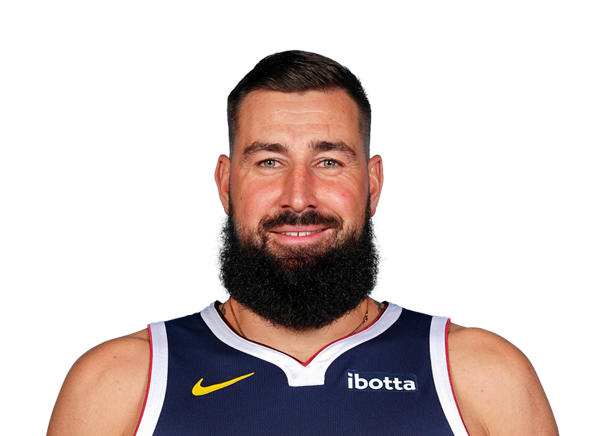 Jonas ValanciunasC #17
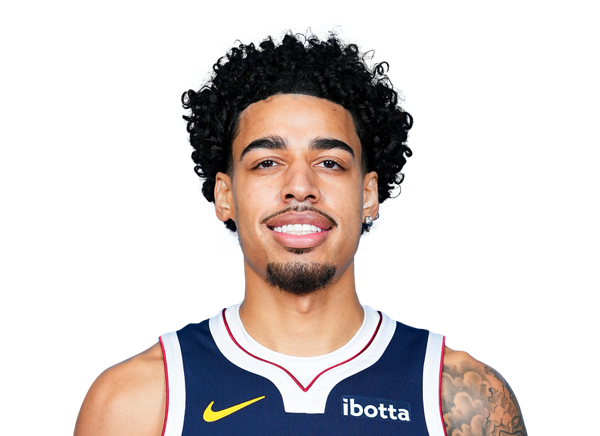 Julian StrawtherG #1
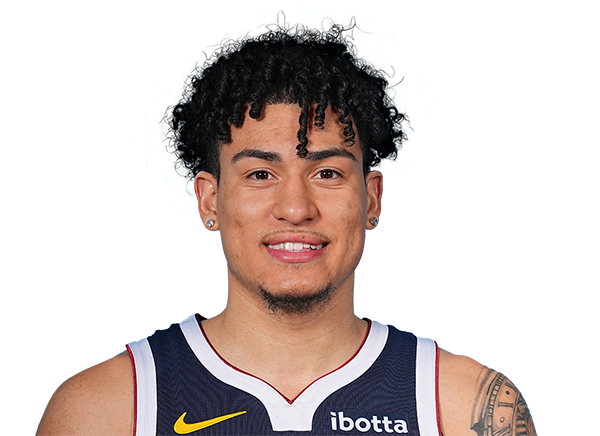 KJ SimpsonG #25
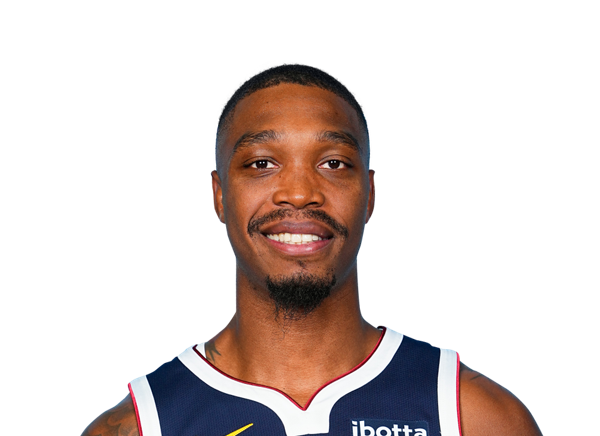 Lonnie Walker IVG #4
 Marvin Bagley IIIF #3
 Nikola JokicC #15
 Popeye JonesC
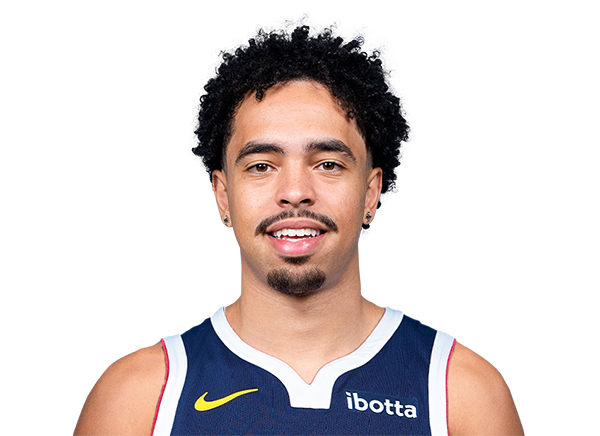 Ryan NembhardG #9
 Spencer JonesF #21
 Steven CrowlC
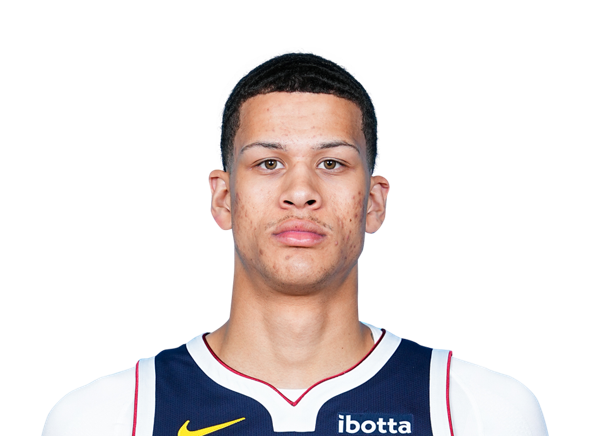 Trevon BrazileF #7
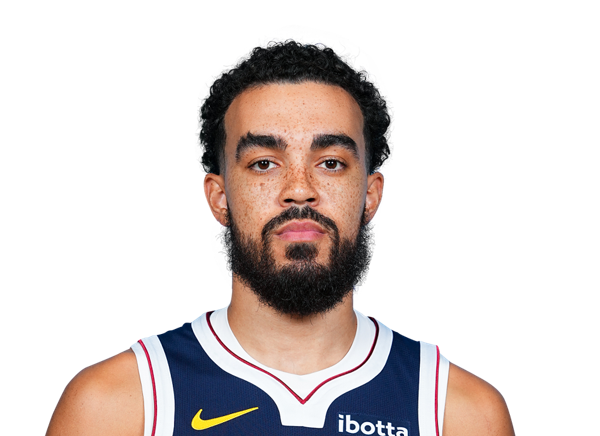 Tyus JonesG #5