Click a season to open this player’s full game log, splits and advanced stats for that year; click a team to open its page. A dash means no NBA games were recorded.
03 / EVERY CATEGORY THE PROVIDER REPORTS
Full statistical breakdown
Regular season 2026-27
Defensive
Metric
Total
NBA rank
Blocks
1
Tied-292nd
Defensive Rebounds
2
Tied-408th
Steals
0
Tied-405th
Defensive Rebound Rate
0.0
—
Defensive Rebounds Per Game
1.0
—
Blocks Per Game
0.5
—
Steals Per Game
0.0
—
Defensive Rebounds Per 48
8.7
2,797th
Blocks Per 48
4.4
2,002nd
Steals Per 48
0.0
2,777th
General
Metric
Total
NBA rank
Disqualifications
0
Tied-22nd
Flagrant Fouls
0
Tied-24th
Fouls
2
Tied-412th
Player Efficiency Rating
1.36
—
Rebound Rate
0.0
—
Ejections
0
Tied-7th
Technical Fouls
0
Tied-104th
Rebounds
2
—
Value Over Replacement Player
-1.5
—
Minutes
11
Tied-7th
Minutes Per Game
5.5
—
Rating
2.6
Tied-1,117th
Plus-Minus
-11
Tied-1st
Rebounds Per Game
1.0
—
Fouls Per Game
1.0
—
Flagrant Fouls Per Game
0.0
—
Technical Fouls Per Game
0.0
—
Ejections Per Game
0.0
—
Disqualifications Per Game
0.0
—
Assist To Turnover Ratio
INF
—
Steal To Foul Ratio
0.0
—
Block To Foul Ratio
0.5
—
Team Rebounds Per Game
0.0
—
Rebounds
2
—
Total Technical Fouls
0
—
Assist To Turnover Ratio
0.0
—
Steal To Turnover Ratio
0.0
—
Rebounds Per 48 Minutes
8.7
—
Fouls Per 48 Minutes
8.7
2,825th
Flagrant Fouls Per 48 Minutes
0.0
164th
Technical Fouls Per 48 Minutes
0.0
713th
Ejections Per 48 Minutes
0.0
48th
Disqualifications Per 48 Minutes
0.0
150th
R/40
7.3
—
Games Played
2
2nd
Games Started
0
Tied-258th
Double Double
0
Tied-121st
Triple Double
0
Tied-13th
Offensive
Metric
Total
NBA rank
Assists
3
Tied-370th
Effective Field Goal Percentage
0.0
—
Field Goals
0/3
—
Field Goals Attempted
3
Tied-438th
Field Goals Made
0
Tied-452nd
Field Goal Percentage
0.0
—
Free Throws
0/0
—
Free Throw Percentage
0.0
—
Free Throws Attempted
0
Tied-422nd
Free Throws Made
0
Tied-416th
Offensive Rebounds
0
Tied-427th
Points
0
Tied-458th
Turnovers
0
Tied-438th
3-Point Field Goal Percentage
0.0
—
3-Point Field Goals Attempted
3
Tied-368th
3-Point Field Goals Made
0
Tied-379th
True Shooting Percentage
0.0
—
Total Turnovers
0
—
Assist Ratio
50.0
—
Points in the Paint
0
Tied-1st
Offensive Rebound Rate
0.0
—
Turnover Ratio
0.0
—
Brick Index
0.00
—
Usage Rate
0.0
—
Average Field Goals Made
0.0
—
Average Field Goals Attempted
1.5
—
Average 3-Point Field Goals Made
0.0
—
Average 3-Point Field Goals Attempted
1.5
—
Average Free Throws Made
0.0
—
Average Free Throws Attempted
0.0
—
Points Per Game
0.0
—
Offensive Rebounds Per Game
0.0
—
Assists Per Game
1.5
—
Turnovers Per Game
0.0
—
Offensive Rebound Percentage
0.0
—
Estimated Possessions
3.0
—
Estimated Possessions Per Game
1.5
—
Points Per Estimated Possession
0.0
—
Team Turnovers Per Game
0.0
—
Total Turnovers Per Game
0.0
—
3-Point Field Goal Percentage
0.0
—
2-Point Field Goals Made
0.0
Tied-73rd
2-Point Field Goals Attempted
0.0
Tied-70th
2-Point Field Goals Made per Game
0.0
—
2-Point Field Goals Attempted per Game
0.0
—
2-Point Field Goal Percentage
0.0
—
Shooting Efficiency
0.00
—
Scoring Efficiency
0.000
—
Fieldgoals Made Per 48
0.0
3,099th
Fieldgoals Attempted Per 48
13.1
3,003rd
3-Point Fieldgoals Made Per 48
0.0
2,598th
3-Point Fieldgoals Attempted Per 48
13.1
2,523rd
Freethrows Made Per 48
0.0
2,852nd
Freethrows Attempted Per 48
0.0
2,893rd
Points Scored Per 48
0.0
3,140th
Offensive Rebounds Per 48
0.0
2,928th
Assists Per 48
13.1
2,537th
Turnovers
0.0
3,003rd
P/40
0.0
—
A/40
10.9
—
04 / EFFICIENCY, SHOOTING PROFILE, PER-36
Advanced metrics
True shooting %0.0%
Effective FG %0.0%
3-point attempt rate100.0%
Free throw rate0.0%
Points per shot attempt0.00
Points per 36 min0.0
Rebounds per 36 min6.5
Assists per 36 min9.8
Steals per 36 min0.00
Blocks per 36 min3.27
Turnovers per 36 min0.00
Stocks (STL + BLK) per game0.50
Pts + Reb + Ast per game2.5
Efficiency (EFF) per game1.5
Game Score per game (Hollinger)0.3
Minutes per game5.5
Calculated by BallersCulture from the supplied 2026-27 box-score totals using standard formulas (hover a tile to see the formula). Tracking-based metrics such as BPM, VORP, on/off and RAPTOR are not available from this data source.
05 / 2 GAMES IN 2026-27
Game log: Regular season
Date
Opp
Result
MIN
FG
FG%
3PT
3P%
FT
FT%
REB
AST
BLK
STL
PF
TO
PTS
Oct 31
@ WSH
L 95-79
2
0-1
0.0
0-1
0.0
0-0
0.0
1
0
0
0
1
0
0
Oct 24
vs ATL
L 128-81
10
0-2
0.0
0-2
0.0
0-0
0.0
1
3
1
0
1
0
0
06 / 2026-27 HOME / AWAY, RESULTS, MONTHS AND OPPONENTS
Splits
split
Split
GP
MIN
FG
FG%
3PT
3P%
FT
FT%
OR
DR
REB
AST
BLK
STL
PF
TO
PTS
All Splits
2
5.5
0.0-1.5
0.0
0.0-1.5
0.0
0.0-0.0
0.0
0.0
1.0
1.0
1.5
0.5
0.0
1.0
0.0
0.0
Home
1
10.0
0.0-2.0
0.0
0.0-2.0
0.0
0.0-0.0
0.0
0.0
1.0
1.0
3.0
1.0
0.0
1.0
0.0
0.0
Road
1
2.0
0.0-1.0
0.0
0.0-1.0
0.0
0.0-0.0
0.0
0.0
1.0
1.0
0.0
0.0
0.0
1.0
0.0
0.0
vs. Division
2
5.5
0.0-1.5
0.0
0.0-1.5
0.0
0.0-0.0
0.0
0.0
1.0
1.0
1.5
0.5
0.0
1.0
0.0
0.0
vs. Conference
2
5.5
0.0-1.5
0.0
0.0-1.5
0.0
0.0-0.0
0.0
0.0
1.0
1.0
1.5
0.5
0.0
1.0
0.0
0.0
3+ Days Rest
2
5.5
0.0-1.5
0.0
0.0-1.5
0.0
0.0-0.0
0.0
0.0
1.0
1.0
1.5
0.5
0.0
1.0
0.0
0.0
Month
Split
GP
MIN
FG
FG%
3PT
3P%
FT
FT%
OR
DR
REB
AST
BLK
STL
PF
TO
PTS
October
2
5.5
0.0-1.5
0.0
0.0-1.5
0.0
0.0-0.0
0.0
0.0
1.0
1.0
1.5
0.5
0.0
1.0
0.0
0.0
Pre All-Star
2
5.5
0.0-1.5
0.0
0.0-1.5
0.0
0.0-0.0
0.0
0.0
1.0
1.0
1.5
0.5
0.0
1.0
0.0
0.0
Result
Split
GP
MIN
FG
FG%
3PT
3P%
FT
FT%
OR
DR
REB
AST
BLK
STL
PF
TO
PTS
Losses
2
5.5
0.0-1.5
0.0
0.0-1.5
0.0
0.0-0.0
0.0
0.0
1.0
1.0
1.5
0.5
0.0
1.0
0.0
0.0
Day
Split
GP
MIN
FG
FG%
3PT
3P%
FT
FT%
OR
DR
REB
AST
BLK
STL
PF
TO
PTS
Friday
2
5.5
0.0-1.5
0.0
0.0-1.5
0.0
0.0-0.0
0.0
0.0
1.0
1.0
1.5
0.5
0.0
1.0
0.0
0.0
Opponent
Split
GP
MIN
FG
FG%
3PT
3P%
FT
FT%
OR
DR
REB
AST
BLK
STL
PF
TO
PTS
Atlanta Hawks
1
10.0
0.0-2.0
0.0
0.0-2.0
0.0
0.0-0.0
0.0
0.0
1.0
1.0
3.0
1.0
0.0
1.0
0.0
0.0
Washington Wizards
1
2.0
0.0-1.0
0.0
0.0-1.0
0.0
0.0-0.0
0.0
0.0
1.0
1.0
0.0
0.0
0.0
1.0
0.0
0.0
07 / SEASON-BY-SEASON HISTORY
Career statistics
Regular Season Averages
Season
Team
GP
GS
MIN
FG
FG%
3PT
3P%
FT
FT%
OR
DR
REB
AST
BLK
STL
PF
TO
PTS
2024-25
Denver Nuggets
19
0
3.5
0.7-1.3
58.3
0.1-0.4
25.0
0.2-0.2
75.0
0.3
0.8
1.2
0.2
0.2
0.0
0.6
0.1
1.7
2025-26
Memphis Grizzlies
7
0
3.9
0.7-1.3
55.6
0.1-0.4
33.3
0.3-0.4
66.7
0.4
0.9
1.3
0.3
0.3
0.0
0.4
0.1
1.9
2025-26
Charlotte Hornets
12
2
15.6
2.1-4.2
50.0
0.2-0.2
100.0
1.8-2.2
80.8
2.5
3.0
5.5
0.7
0.7
0.3
1.6
1.3
6.1
2025-26
2025 26 Totals
19
2
11.2
1.6-3.1
50.8
0.2-0.3
60.0
1.2-1.5
79.3
1.7
2.2
3.9
0.5
0.5
0.2
1.2
0.8
4.5
2026-27
Charlotte Hornets
2
0
5.5
0.0-1.5
0.0
0.0-1.5
0.0
0.0-0.0
0.0
0.0
1.0
1.0
1.5
0.5
0.0
1.0
0.0
0.0
Career
—
40
2
7.3
1.1-2.2
51.2
0.1-0.4
31.3
0.7-0.8
78.8
1.0
1.5
2.5
0.4
0.4
0.1
0.9
0.5
3.0
Regular Season Totals
Season
Team
FG
FG%
3PT
3P%
FT
FT%
OR
DR
REB
AST
BLK
STL
PF
TO
PTS
2024-25
Denver Nuggets
14-24
58.3
2-8
25.0
3-4
75.0
6
16
22
4
4
0
11
2
33
2025-26
Memphis Grizzlies
5-9
55.6
1-3
33.3
2-3
66.7
3
6
9
2
2
0
3
1
13
2025-26
Charlotte Hornets
25-50
50.0
2-2
100.0
21-26
80.8
30
36
66
8
8
3
19
15
73
2025-26
2025 26 Totals
30-59
50.8
3-5
60.0
23-29
79.3
33
42
75
10
10
3
22
16
86
2026-27
Charlotte Hornets
0-3
0.0
0-3
0.0
0-0
0.0
0
2
2
3
1
0
2
0
0
Career
—
44-86
51.2
5-16
31.3
26-33
78.8
39
60
99
17
15
3
35
18
119
Regular Season Misc Totals
Season
Team
DD2
TD3
DQ
EJECT
TECH
FLAG
AST/TO
STL/TO
SC-EFF
SH-EFF
2024-25
Denver Nuggets
0
0
0
0
0
0
2.0
0.0
1.375
0.63
2025-26
Memphis Grizzlies
0
0
0
0
0
0
2.0
0.0
1.444
0.61
2025-26
Charlotte Hornets
1
0
0
0
0
0
0.5
0.2
1.460
0.52
2025-26
2025 26 Totals
1
0
0
0
0
0
0.6
0.2
1.458
0.53
2026-27
Charlotte Hornets
0
0
0
0
0
0
INF
0.0
0.000
0.00
Career
—
1
0
0
0
0
0
0.9
0.2
1.384
0.54
Scoring, rebounding and assist trend
08 / SHOT CHART AND ZONE SHOOTING
Shot profile
Shot-location data is not connected. Add a BALLDONTLIE GOAT-tier NBA API key in NBA Players → Settings to enable shot charts and zone shooting.
LATEST UPDATEHall (ankle) registered four points (1-3 FG, 1-3 3Pt, 1-2 FT) and three rebounds over eight minutes in Tuesday's 124-90 preseason loss to the Nets.
Hall had his 2025-26 campaign cut short after he fractured his ankle, but he's back and ready to go for the upcoming season. In 12 games with the Hornets last year, Hall averaged 6.1 points and 5.5 rebounds per game.




 Brandon MillerF #24
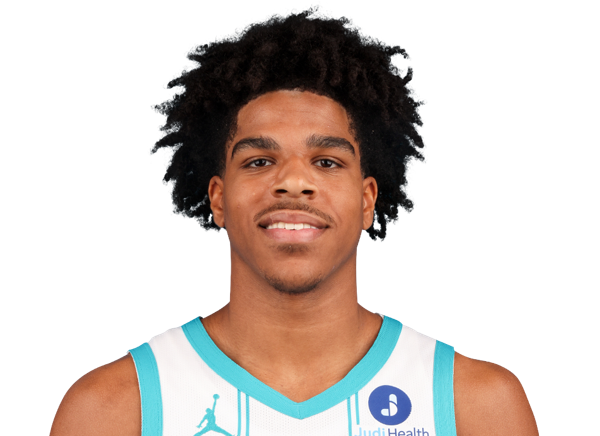 Christian AndersonG #5
 Coby WhiteG #3
 Dennis SchroderG #17
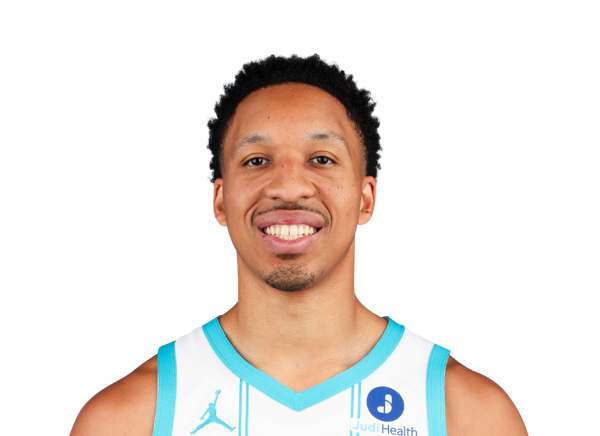 Grant WilliamsF #2
 Grayson AllenG #8
 Hannes SteinbachF #22
 Isaiah WongG #21
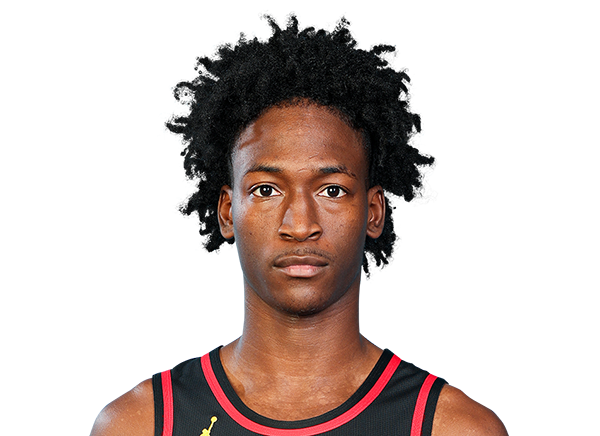 Jarkel JoinerG #20
 Kon KnueppelG #7
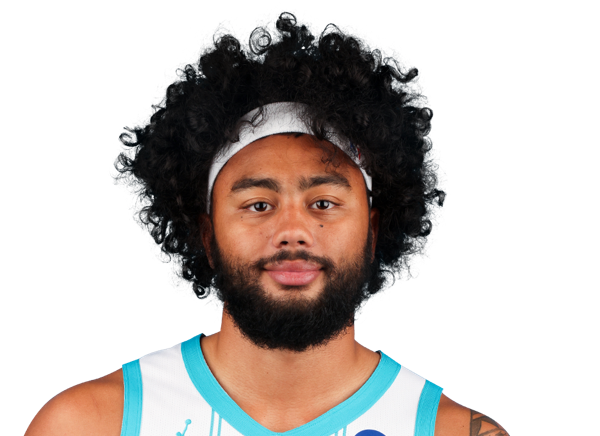 Kylan BoswellG #18
 Latrell Wrightsell Jr.G
 Liam McNeeleyG #33
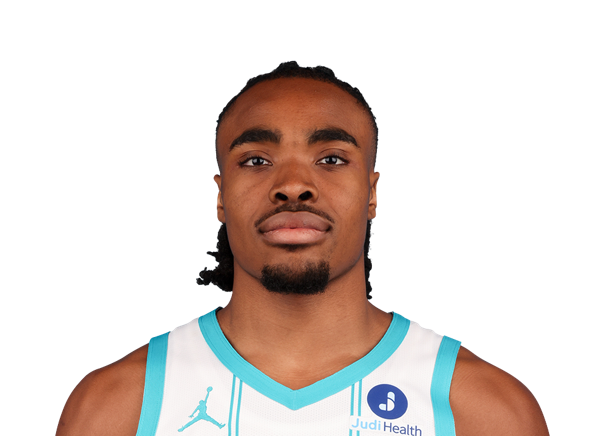 Michael AjayiF #10
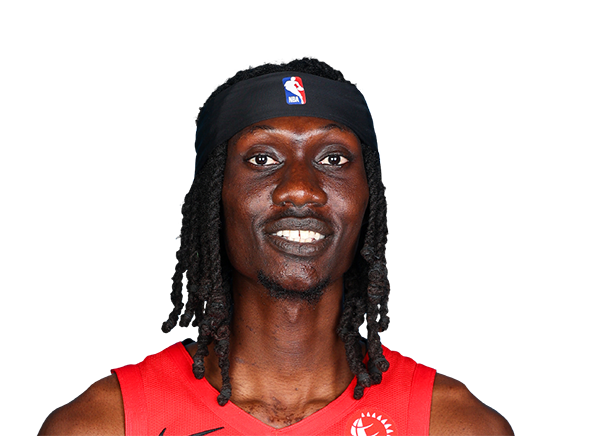 Mouhamadou GueyeF #16
 Moussa DiabateF #14
 Naz ReidC
 Pat ConnaughtonG #21
 Rob DillinghamG #7
 Royce O’NealeF #00
 Ryan KalkbrennerC #11
 Sion JamesG #4
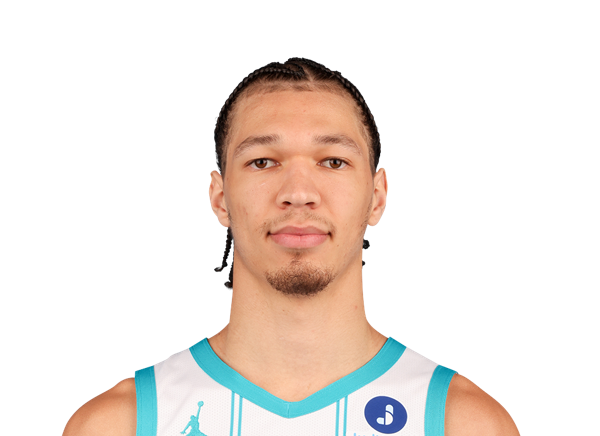 Tidjane SalaunF #31
 Tosan EvbuomwanF #20
 Wyatt FricksF #23
 Xavier TillmanF #26