Click a season to open this player’s full game log, splits and advanced stats for that year; click a team to open its page. A dash means no NBA games were recorded.
03 / EVERY CATEGORY THE PROVIDER REPORTS
Full statistical breakdown
Regular season 2026-27
Defensive
Metric
Total
NBA rank
Blocks
2
Tied-230th
Defensive Rebounds
34
Tied-144th
Steals
8
Tied-169th
Defensive Rebound Rate
0.0
—
Defensive Rebounds Per Game
2.6
Tied-161st
Blocks Per Game
0.2
Tied-218th
Steals Per Game
0.6
175th
Defensive Rebounds Per 48
6.5
2,304th
Blocks Per 48
0.4
3,680th
Steals Per 48
1.5
2,704th
General
Metric
Total
NBA rank
Disqualifications
0
Tied-21st
Flagrant Fouls
0
Tied-22nd
Fouls
16
Tied-261st
Player Efficiency Rating
9.02
255th
Rebound Rate
0.0
—
Ejections
0
Tied-7th
Technical Fouls
0
Tied-101st
Rebounds
41
—
Value Over Replacement Player
0.0
—
Minutes
251
Tied-3rd
Minutes Per Game
19.3
—
Rating
9.8
Tied-103rd
Plus-Minus
-36
Tied-1st
Rebounds Per Game
3.2
Tied-185th
Fouls Per Game
1.2
Tied-260th
Flagrant Fouls Per Game
0.0
Tied-19th
Technical Fouls Per Game
0.0
Tied-82nd
Ejections Per Game
0.0
Tied-6th
Disqualifications Per Game
0.0
Tied-20th
Assist To Turnover Ratio
1.5
—
Steal To Foul Ratio
0.5
—
Block To Foul Ratio
0.1
—
Team Rebounds Per Game
0.0
—
Rebounds
41
—
Total Technical Fouls
0
—
Assist To Turnover Ratio
0.0
—
Steal To Turnover Ratio
1.3
—
Rebounds Per 48 Minutes
7.8
—
Fouls Per 48 Minutes
3.1
4,176th
Flagrant Fouls Per 48 Minutes
0.0
352nd
Technical Fouls Per 48 Minutes
0.0
1,616th
Ejections Per 48 Minutes
0.0
112th
Disqualifications Per 48 Minutes
0.0
336th
R/40
6.5
—
Games Played
13
13th
Games Started
0
Tied-257th
Double Double
0
Tied-119th
Triple Double
0
Tied-12th
Offensive
Metric
Total
NBA rank
Assists
9
Tied-288th
Effective Field Goal Percentage
50.8
—
Field Goals
22/60
—
Field Goals Attempted
60
Tied-228th
Field Goals Made
22
Tied-259th
Field Goal Percentage
36.7
—
Free Throws
6/7
—
Free Throw Percentage
85.7
Tied-73rd
Free Throws Attempted
7
Tied-292nd
Free Throws Made
6
Tied-274th
Offensive Rebounds
7
Tied-230th
Points
67
Tied-245th
Turnovers
6
Tied-275th
3-Point Field Goal Percentage
31.5
179th
3-Point Field Goals Attempted
54
Tied-104th
3-Point Field Goals Made
17
Tied-122nd
True Shooting Percentage
53.1
—
Total Turnovers
6
—
Assist Ratio
11.5
—
Points in the Paint
0
Tied-1st
Offensive Rebound Rate
0.0
—
Turnover Ratio
7.7
—
Brick Index
0.00
—
Usage Rate
0.0
—
Average Field Goals Made
1.7
—
Average Field Goals Attempted
4.6
Tied-197th
Average 3-Point Field Goals Made
1.3
Tied-142nd
Average 3-Point Field Goals Attempted
4.2
Tied-112th
Average Free Throws Made
0.5
—
Average Free Throws Attempted
0.5
Tied-255th
Points Per Game
5.2
245th
Offensive Rebounds Per Game
0.5
Tied-219th
Assists Per Game
0.7
Tied-257th
Turnovers Per Game
0.5
253rd
Offensive Rebound Percentage
0.2
—
Estimated Possessions
61.8
—
Estimated Possessions Per Game
4.8
—
Points Per Estimated Possession
1.1
—
Team Turnovers Per Game
0.0
—
Total Turnovers Per Game
0.5
—
3-Point Field Goal Percentage
31.5
150th
2-Point Field Goals Made
5.0
Tied-137th
2-Point Field Goals Attempted
6.0
Tied-124th
2-Point Field Goals Made per Game
0.4
—
2-Point Field Goals Attempted per Game
0.5
—
2-Point Field Goal Percentage
83.3
—
Shooting Efficiency
0.51
—
Scoring Efficiency
1.117
—
Fieldgoals Made Per 48
4.2
4,144th
Fieldgoals Attempted Per 48
11.5
3,648th
3-Point Fieldgoals Made Per 48
3.3
1,952nd
3-Point Fieldgoals Attempted Per 48
10.3
1,664th
Freethrows Made Per 48
1.1
4,384th
Freethrows Attempted Per 48
1.3
4,672nd
Points Scored Per 48
12.8
3,920th
Offensive Rebounds Per 48
1.3
3,680th
Assists Per 48
1.7
4,608th
Turnovers
1.1
4,400th
P/40
10.7
—
A/40
1.4
—
04 / EFFICIENCY, SHOOTING PROFILE, PER-36
Advanced metrics
True shooting %53.9%
Effective FG %51.1%
2-point FG %100.0%
3-point attempt rate91.3%
Free throw rate10.9%
Points per shot attempt1.13
% of points from 3s75.0%
Assist-to-turnover1.40
Points per 36 min9.7
Rebounds per 36 min6.0
Assists per 36 min1.3
Steals per 36 min1.12
Blocks per 36 min0.37
Turnovers per 36 min0.93
Stocks (STL + BLK) per game0.80
Pts + Reb + Ast per game9.1
Efficiency (EFF) per game6.5
Game Score per game (Hollinger)4.0
Minutes per game19.3
Calculated by BallersCulture from the supplied 2026-27 box-score totals using standard formulas (hover a tile to see the formula). Tracking-based metrics such as BPM, VORP, on/off and RAPTOR are not available from this data source.
05 / 13 GAMES IN 2026-27
Game log: Regular season
Date
Opp
Result
MIN
FG
FG%
3PT
3P%
FT
FT%
REB
AST
BLK
STL
PF
TO
PTS
Nov 16
@ LAC
L 113-105
19
1-1
100.0
1-1
100.0
0-0
0.0
3
1
0
0
0
0
3
Nov 13
@ PHX
L 101-96
22
2-5
40.0
2-5
40.0
1-1
100.0
4
0
0
0
2
2
7
Nov 10
vs CLE
W 124-112
23
4-8
50.0
2-5
40.0
0-0
0.0
3
1
0
1
2
0
10
Nov 7
vs BOS
L 119-80
26
2-6
33.3
2-6
33.3
1-1
100.0
4
2
0
2
2
1
7
Nov 5
@ BKN
L 114-104
18
0-2
0.0
0-2
0.0
0-0
0.0
3
2
0
1
0
0
0
Nov 3
vs DET
L 124-91
18
0-3
0.0
0-3
0.0
2-2
100.0
4
0
0
1
1
2
2
Nov 1
vs PHI
L 109-104
23
3-4
75.0
1-2
50.0
1-1
100.0
6
1
1
0
1
0
8
Oct 31
@ WSH
L 95-79
17
2-9
22.2
2-9
22.2
1-2
50.0
3
1
0
0
1
0
7
Oct 29
@ DET
L 97-89
34
3-8
37.5
3-8
37.5
0-0
0.0
4
0
0
1
1
0
9
Oct 27
vs WSH
W 110-103
7
0-1
0.0
0-1
0.0
0-0
0.0
0
1
0
0
0
0
0
Oct 25
vs MIA
W 115-110
11
0-1
0.0
0-1
0.0
0-0
0.0
1
0
0
0
2
0
0
Oct 24
vs ATL
L 128-81
17
2-6
33.3
2-6
33.3
0-0
0.0
2
0
0
1
3
0
6
Oct 22
@ BKN
W 110-103
17
3-6
50.0
2-5
40.0
0-0
0.0
4
0
1
1
1
1
8
06 / 2026-27 HOME / AWAY, RESULTS, MONTHS AND OPPONENTS
Splits
split
Split
GP
MIN
FG
FG%
3PT
3P%
FT
FT%
OR
DR
REB
AST
BLK
STL
PF
TO
PTS
All Splits
13
19.3
1.7-4.6
36.7
1.3-4.2
31.5
0.5-0.5
85.7
0.5
2.6
3.2
0.7
0.2
0.6
1.2
0.5
5.2
Home
7
17.9
1.6-4.1
37.9
1.0-3.4
29.2
0.6-0.6
100.0
0.6
2.3
2.9
0.7
0.1
0.7
1.6
0.4
4.7
Road
6
21.0
1.8-5.2
35.5
1.7-5.0
33.3
0.3-0.5
66.7
0.5
3.0
3.5
0.7
0.2
0.5
0.8
0.5
5.7
vs. Division
4
13.3
1.0-4.3
23.5
1.0-4.3
23.5
0.3-0.5
50.0
0.0
1.5
1.5
0.5
0.0
0.3
1.5
0.0
3.3
vs. Conference
11
19.2
1.7-4.9
35.2
1.3-4.4
29.2
0.5-0.5
83.3
0.5
2.5
3.1
0.7
0.2
0.7
1.3
0.4
5.2
3+ Days Rest
1
17.0
3.0-6.0
50.0
2.0-5.0
40.0
0.0-0.0
0.0
2.0
2.0
4.0
0.0
1.0
1.0
1.0
1.0
8.0
Month
Split
GP
MIN
FG
FG%
3PT
3P%
FT
FT%
OR
DR
REB
AST
BLK
STL
PF
TO
PTS
October
7
18.0
1.9-5.0
37.1
1.4-4.6
31.3
0.3-0.4
66.7
0.3
2.6
2.9
0.4
0.3
0.4
1.3
0.1
5.4
November
6
20.8
1.5-4.2
36.0
1.2-3.7
31.8
0.7-0.7
100.0
0.8
2.7
3.5
1.0
0.0
0.8
1.2
0.8
4.8
Pre All-Star
13
19.3
1.7-4.6
36.7
1.3-4.2
31.5
0.5-0.5
85.7
0.5
2.6
3.2
0.7
0.2
0.6
1.2
0.5
5.2
Result
Split
GP
MIN
FG
FG%
3PT
3P%
FT
FT%
OR
DR
REB
AST
BLK
STL
PF
TO
PTS
Wins
4
14.8
1.8-4.0
43.8
1.0-3.0
33.3
0.0-0.0
0.0
0.5
1.5
2.0
0.5
0.3
0.5
1.3
0.3
4.5
Losses
9
21.3
1.7-4.9
34.1
1.4-4.7
31.0
0.7-0.8
85.7
0.6
3.1
3.7
0.8
0.1
0.7
1.2
0.6
5.4
Day
Split
GP
MIN
FG
FG%
3PT
3P%
FT
FT%
OR
DR
REB
AST
BLK
STL
PF
TO
PTS
Monday
3
16.3
1.3-4.0
33.3
0.7-3.0
22.2
0.7-0.7
100.0
0.3
2.0
2.3
0.7
0.0
0.7
1.0
0.7
4.0
Wednesday
3
23.0
2.0-5.3
37.5
1.7-5.0
33.3
0.0-0.0
0.0
0.7
3.0
3.7
0.7
0.3
1.0
0.7
0.3
5.7
Thursday
1
22.0
2.0-5.0
40.0
2.0-5.0
40.0
1.0-1.0
100.0
0.0
4.0
4.0
0.0
0.0
0.0
2.0
2.0
7.0
Friday
3
19.7
2.0-7.0
28.6
2.0-7.0
28.6
0.7-1.0
66.7
1.0
2.0
3.0
1.0
0.0
1.0
2.0
0.3
6.7
Saturday
2
17.0
1.5-2.5
60.0
0.5-1.5
33.3
0.5-0.5
100.0
0.0
3.5
3.5
0.5
0.5
0.0
1.5
0.0
4.0
Sunday
1
19.0
1.0-1.0
100.0
1.0-1.0
100.0
0.0-0.0
0.0
1.0
2.0
3.0
1.0
0.0
0.0
0.0
0.0
3.0
Opponent
Split
GP
MIN
FG
FG%
3PT
3P%
FT
FT%
OR
DR
REB
AST
BLK
STL
PF
TO
PTS
Atlanta Hawks
1
17.0
2.0-6.0
33.3
2.0-6.0
33.3
0.0-0.0
0.0
0.0
2.0
2.0
0.0
0.0
1.0
3.0
0.0
6.0
Brooklyn Nets
2
17.5
1.5-4.0
37.5
1.0-3.5
28.6
0.0-0.0
0.0
1.0
2.5
3.5
1.0
0.5
1.0
0.5
0.5
4.0
Boston Celtics
1
26.0
2.0-6.0
33.3
2.0-6.0
33.3
1.0-1.0
100.0
3.0
1.0
4.0
2.0
0.0
2.0
2.0
1.0
7.0
Cleveland Cavaliers
1
23.0
4.0-8.0
50.0
2.0-5.0
40.0
0.0-0.0
0.0
0.0
3.0
3.0
1.0
0.0
1.0
2.0
0.0
10.0
Detroit Pistons
2
26.0
1.5-5.5
27.3
1.5-5.5
27.3
1.0-1.0
100.0
0.5
3.5
4.0
0.0
0.0
1.0
1.0
1.0
5.5
Los Angeles Clippers
1
19.0
1.0-1.0
100.0
1.0-1.0
100.0
0.0-0.0
0.0
1.0
2.0
3.0
1.0
0.0
0.0
0.0
0.0
3.0
Miami Heat
1
11.0
0.0-1.0
0.0
0.0-1.0
0.0
0.0-0.0
0.0
0.0
1.0
1.0
0.0
0.0
0.0
2.0
0.0
0.0
Philadelphia 76ers
1
23.0
3.0-4.0
75.0
1.0-2.0
50.0
1.0-1.0
100.0
0.0
6.0
6.0
1.0
1.0
0.0
1.0
0.0
8.0
Phoenix Suns
1
22.0
2.0-5.0
40.0
2.0-5.0
40.0
1.0-1.0
100.0
0.0
4.0
4.0
0.0
0.0
0.0
2.0
2.0
7.0
Washington Wizards
2
12.0
1.0-5.0
20.0
1.0-5.0
20.0
0.5-1.0
50.0
0.0
1.5
1.5
1.0
0.0
0.0
0.5
0.0
3.5
07 / SEASON-BY-SEASON HISTORY
Career statistics
Regular Season Averages
Season
Team
GP
GS
MIN
FG
FG%
3PT
3P%
FT
FT%
OR
DR
REB
AST
BLK
STL
PF
TO
PTS
2017-18
Utah Jazz
69
4
16.7
1.7-4.1
42.3
0.6-1.7
35.6
0.9-1.1
80.3
0.4
3.1
3.4
1.4
0.2
0.5
1.5
0.8
5.0
2018-19
Utah Jazz
82
16
20.4
2.0-4.2
47.5
0.8-2.1
38.6
0.4-0.5
76.2
0.3
3.2
3.5
1.5
0.3
0.7
2.1
0.9
5.2
2019-20
Utah Jazz
71
62
28.9
2.2-5.1
43.3
1.3-3.4
37.7
0.6-0.8
76.4
0.4
5.1
5.5
2.5
0.5
0.8
2.8
0.9
6.3
2020-21
Utah Jazz
71
71
31.5
2.5-5.5
44.4
1.5-3.9
38.5
0.5-0.6
84.8
1.2
5.6
6.8
2.5
0.5
0.8
2.6
1.2
7.0
2021-22
Utah Jazz
77
77
31.2
2.6-5.8
45.7
1.5-4.0
38.9
0.6-0.7
80.4
0.8
3.9
4.8
2.5
0.4
1.1
2.4
1.0
7.4
2022-23
Brooklyn Nets
76
53
31.7
3.0-7.8
38.6
2.1-5.5
38.9
0.7-0.9
72.5
0.7
4.3
5.1
3.7
0.6
0.9
3.1
1.5
8.8
2023-24
Brooklyn Nets
49
6
24.5
2.6-6.6
38.8
2.0-5.4
36.6
0.3-0.4
68.2
0.8
3.7
4.5
2.8
0.6
0.7
2.4
1.0
7.4
2023-24
Phoenix Suns
30
8
25.1
2.9-7.1
41.1
2.0-5.2
37.6
0.3-0.4
69.2
0.7
4.5
5.2
2.7
0.5
0.9
1.8
0.7
8.1
2023-24
2023 24 Totals
79
14
24.7
2.7-6.8
39.7
2.0-5.3
37.0
0.3-0.4
68.6
0.8
4.0
4.8
2.8
0.6
0.7
2.2
0.9
7.7
2024-25
Phoenix Suns
75
22
24.5
3.2-7.6
42.3
2.4-5.9
40.6
0.3-0.3
73.1
0.7
3.9
4.7
2.2
0.4
0.9
2.0
0.9
9.1
2025-26
Phoenix Suns
78
67
28.4
3.4-8.0
42.1
2.7-6.7
40.8
0.3-0.5
71.1
0.8
4.0
4.8
2.7
0.4
1.1
2.3
1.3
9.8
2026-27
Charlotte Hornets
13
0
19.3
1.7-4.6
36.7
1.3-4.2
31.5
0.5-0.5
85.7
0.5
2.6
3.2
0.7
0.2
0.6
1.2
0.5
5.2
Career
—
691
386
26.3
2.6-6.1
42.4
1.7-4.3
38.8
0.5-0.7
76.7
0.7
4.1
4.8
2.4
0.4
0.8
2.3
1.0
7.3
Regular Season Totals
Season
Team
FG
FG%
3PT
3P%
FT
FT%
OR
DR
REB
AST
BLK
STL
PF
TO
PTS
2017-18
Utah Jazz
120-284
42.3
42-118
35.6
61-76
80.3
25
211
236
95
16
36
105
55
343
2018-19
Utah Jazz
163-343
47.5
68-176
38.6
32-42
76.2
22
263
285
124
24
54
172
70
426
2019-20
Utah Jazz
158-365
43.3
92-244
37.7
42-55
76.4
27
362
389
180
32
59
202
61
450
2020-21
Utah Jazz
175-394
44.4
107-278
38.5
39-46
84.8
88
397
485
181
32
57
182
83
496
2021-22
Utah Jazz
203-444
45.7
119-306
38.9
45-56
80.4
64
304
368
191
32
86
183
79
570
2022-23
Brooklyn Nets
229-593
38.6
163-419
38.9
50-69
72.5
55
329
384
283
49
65
239
114
671
2023-24
Brooklyn Nets
126-325
38.8
97-265
36.6
15-22
68.2
38
183
221
137
29
32
120
51
364
2023-24
Phoenix Suns
88-214
41.1
59-157
37.6
9-13
69.2
22
134
156
82
15
27
54
22
244
2023-24
2023 24 Totals
214-539
39.7
156-422
37.0
24-35
68.6
60
317
377
219
44
59
174
73
608
2024-25
Phoenix Suns
241-570
42.3
179-441
40.6
19-26
73.1
53
296
349
163
33
67
151
65
680
2025-26
Phoenix Suns
263-625
42.1
212-520
40.8
27-38
71.1
59
313
372
208
32
84
177
103
765
2026-27
Charlotte Hornets
22-60
36.7
17-54
31.5
6-7
85.7
7
34
41
9
2
8
16
6
67
Career
—
1788-4217
42.4
1155-2978
38.8
345-450
76.7
460
2826
3286
1653
296
575
1601
709
5076
Regular Season Misc Totals
Season
Team
DD2
TD3
DQ
EJECT
TECH
FLAG
AST/TO
STL/TO
SC-EFF
SH-EFF
2017-18
Utah Jazz
1
0
0
0
0
0
1.7
0.7
1.208
0.50
2018-19
Utah Jazz
1
0
0
0
3
0
1.8
0.8
1.242
0.57
2019-20
Utah Jazz
2
0
2
0
2
0
3.0
1.0
1.233
0.56
2020-21
Utah Jazz
3
0
0
0
3
2
2.2
0.7
1.259
0.58
2021-22
Utah Jazz
3
0
0
0
0
0
2.4
1.1
1.284
0.59
2022-23
Brooklyn Nets
4
1
1
0
1
0
2.5
0.6
1.132
0.52
2023-24
Brooklyn Nets
2
0
0
0
1
0
2.7
0.6
1.120
0.54
2023-24
Phoenix Suns
2
0
0
0
2
0
3.7
1.2
1.140
0.55
2023-24
2023 24 Totals
4
0
0
0
3
0
3.0
0.8
1.128
0.54
2024-25
Phoenix Suns
1
0
0
0
2
1
2.5
1.0
1.193
0.58
2025-26
Phoenix Suns
2
0
0
0
3
1
2.0
0.8
1.224
0.59
2026-27
Charlotte Hornets
0
0
0
0
0
0
1.5
1.3
1.117
0.51
Career
—
21
1
3
0
17
4
2.3
0.8
1.204
0.56
Scoring, rebounding and assist trend
08 / SHOT CHART AND ZONE SHOOTING
Shot profile
Shot-location data is not connected. Add a BALLDONTLIE GOAT-tier NBA API key in NBA Players → Settings to enable shot charts and zone shooting.
LATEST UPDATEO'Neale totaled zero points (0-2 FG, 0-2 3Pt), three rebounds, two assists and one steal over 18 minutes during Wednesday's 114-104 loss to the Nets.
O'Neale failed to score for the third time in his first nine games, continuing what has been a disappointing start to his time in Charlotte. While he has been an every-night part of the rotation, his production has been less than ideal, as he is averaging just 4.4 points, 3.0 rebounds and 1.1 three-pointers in 18.0 minutes per game.




 Brandon MillerF #24
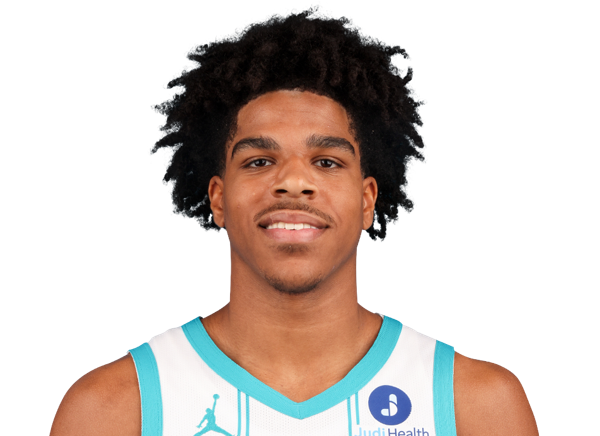 Christian AndersonG #5
 Coby WhiteG #3
 Dennis SchroderG #17
 Grant WilliamsF #2
 Grayson AllenG #8
 Hannes SteinbachF #22
 Isaiah WongG #21
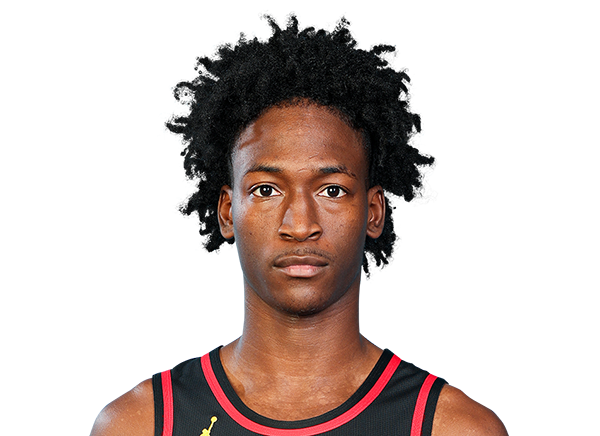 Jarkel JoinerG #20
 Kon KnueppelG #7
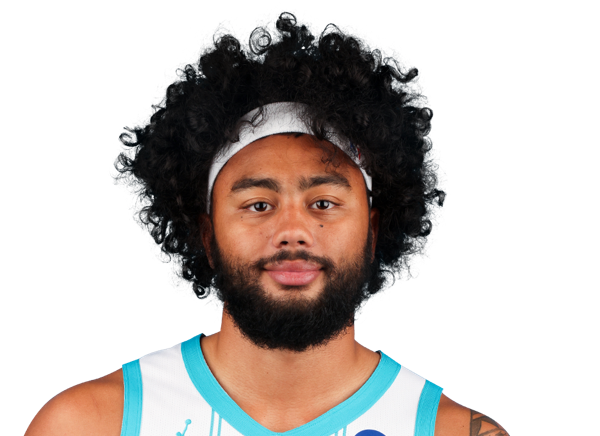 Kylan BoswellG #18
 Latrell Wrightsell Jr.G
 Liam McNeeleyG #33
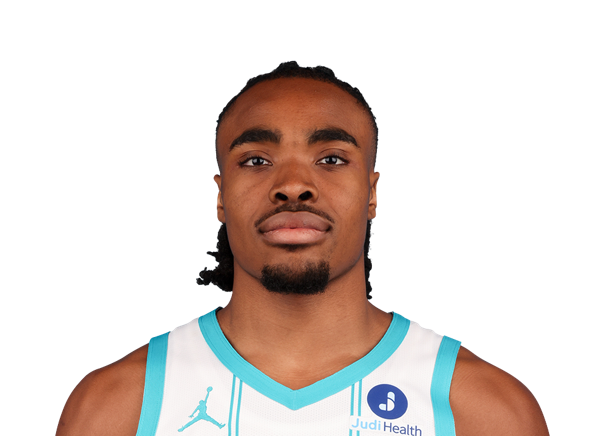 Michael AjayiF #10
 Mouhamadou GueyeF #16
 Moussa DiabateF #14
 Naz ReidC
 Pat ConnaughtonG #21
 PJ HallC #16
 Rob DillinghamG #7
 Ryan KalkbrennerC #11
 Sion JamesG #4
 Tidjane SalaunF #31
 Tosan EvbuomwanF #20
 Wyatt FricksF #23
 Xavier TillmanF #26