Click a season to open this player’s full game log, splits and advanced stats for that year; click a team to open its page. A dash means no NBA games were recorded.
03 / EVERY CATEGORY THE PROVIDER REPORTS
Full statistical breakdown
Regular season 2026-27
Defensive
Metric
Total
NBA rank
Blocks
0
Tied-376th
Defensive Rebounds
42
Tied-115th
Steals
11
Tied-115th
Defensive Rebound Rate
0.0
—
Defensive Rebounds Per Game
3.2
Tied-113th
Blocks Per Game
0.0
Tied-272nd
Steals Per Game
0.8
123rd
Defensive Rebounds Per 48
5.8
2,760th
Blocks Per 48
0.0
9,024th
Steals Per 48
1.5
2,760th
General
Metric
Total
NBA rank
Disqualifications
0
Tied-22nd
Flagrant Fouls
0
Tied-24th
Fouls
33
Tied-78th
Player Efficiency Rating
6.15
275th
Rebound Rate
0.0
—
Ejections
0
Tied-7th
Technical Fouls
0
Tied-104th
Rebounds
50
—
Value Over Replacement Player
-24.2
—
Minutes
348
Tied-2nd
Minutes Per Game
26.8
—
Rating
12.9
Tied-124th
Plus-Minus
-66
Tied-1st
Rebounds Per Game
3.8
138th
Fouls Per Game
2.5
Tied-84th
Flagrant Fouls Per Game
0.0
Tied-21st
Technical Fouls Per Game
0.0
Tied-84th
Ejections Per Game
0.0
Tied-6th
Disqualifications Per Game
0.0
Tied-21st
Assist To Turnover Ratio
2.4
—
Steal To Foul Ratio
0.3
—
Block To Foul Ratio
0.0
—
Team Rebounds Per Game
0.0
—
Rebounds
50
—
Total Technical Fouls
0
—
Assist To Turnover Ratio
0.0
—
Steal To Turnover Ratio
0.7
—
Rebounds Per 48 Minutes
6.9
—
Fouls Per 48 Minutes
4.6
1,872nd
Flagrant Fouls Per 48 Minutes
0.0
576th
Technical Fouls Per 48 Minutes
0.0
2,496th
Ejections Per 48 Minutes
0.0
168th
Disqualifications Per 48 Minutes
0.0
528th
R/40
5.7
—
Games Played
13
13th
Games Started
11
Tied-97th
Double Double
0
Tied-121st
Triple Double
0
Tied-13th
Offensive
Metric
Total
NBA rank
Assists
39
Tied-93rd
Effective Field Goal Percentage
40.9
—
Field Goals
26/82
—
Field Goals Attempted
82
180th
Field Goals Made
26
Tied-237th
Field Goal Percentage
31.7
—
Free Throws
8/11
—
Free Throw Percentage
72.7
Tied-187th
Free Throws Attempted
11
Tied-250th
Free Throws Made
8
Tied-249th
Offensive Rebounds
8
Tied-218th
Points
75
Tied-237th
Turnovers
16
Tied-144th
3-Point Field Goal Percentage
25.4
235th
3-Point Field Goals Attempted
59
Tied-94th
3-Point Field Goals Made
15
Tied-150th
True Shooting Percentage
43.2
—
Total Turnovers
16
—
Assist Ratio
27.5
—
Points in the Paint
0
Tied-1st
Offensive Rebound Rate
0.0
—
Turnover Ratio
11.3
—
Brick Index
0.00
—
Usage Rate
0.0
—
Average Field Goals Made
2.0
—
Average Field Goals Attempted
6.3
260th
Average 3-Point Field Goals Made
1.2
Tied-157th
Average 3-Point Field Goals Attempted
4.5
Tied-97th
Average Free Throws Made
0.6
—
Average Free Throws Attempted
0.8
229th
Points Per Game
5.8
232nd
Offensive Rebounds Per Game
0.6
Tied-208th
Assists Per Game
3.0
Tied-92nd
Turnovers Per Game
1.2
145th
Offensive Rebound Percentage
0.1
—
Estimated Possessions
94.4
—
Estimated Possessions Per Game
7.3
—
Points Per Estimated Possession
0.8
—
Team Turnovers Per Game
0.0
—
Total Turnovers Per Game
1.2
—
3-Point Field Goal Percentage
25.4
175th
2-Point Field Goals Made
11.0
Tied-87th
2-Point Field Goals Attempted
23.0
274th
2-Point Field Goals Made per Game
0.8
—
2-Point Field Goals Attempted per Game
1.8
—
2-Point Field Goal Percentage
47.8
—
Shooting Efficiency
0.41
—
Scoring Efficiency
0.915
—
Fieldgoals Made Per 48
3.6
5,688th
Fieldgoals Attempted Per 48
11.3
Tied-4,320th
3-Point Fieldgoals Made Per 48
2.1
3,600th
3-Point Fieldgoals Attempted Per 48
8.1
2,256th
Freethrows Made Per 48
1.1
5,976th
Freethrows Attempted Per 48
1.5
6,000th
Points Scored Per 48
10.3
5,688th
Offensive Rebounds Per 48
1.1
5,232nd
Assists Per 48
5.4
2,232nd
Turnovers
2.2
3,456th
P/40
8.6
—
A/40
4.5
—
04 / EFFICIENCY, SHOOTING PROFILE, PER-36
Advanced metrics
True shooting %43.6%
Effective FG %41.3%
2-point FG %44.4%
3-point attempt rate71.4%
Free throw rate12.7%
Points per shot attempt0.92
% of points from 3s62.1%
Assist-to-turnover2.50
Points per 36 min7.8
Rebounds per 36 min5.1
Assists per 36 min4.0
Steals per 36 min1.07
Blocks per 36 min0.00
Turnovers per 36 min1.61
Stocks (STL + BLK) per game0.80
Pts + Reb + Ast per game12.6
Efficiency (EFF) per game7.7
Game Score per game (Hollinger)4.2
Minutes per game26.8
Calculated by BallersCulture from the supplied 2026-27 box-score totals using standard formulas (hover a tile to see the formula). Tracking-based metrics such as BPM, VORP, on/off and RAPTOR are not available from this data source.
05 / 13 GAMES IN 2026-27
Game log: Regular season
Date
Opp
Result
MIN
FG
FG%
3PT
3P%
FT
FT%
REB
AST
BLK
STL
PF
TO
PTS
Nov 16
@ LAC
L 113-105
35
1-6
16.7
1-5
20.0
0-0
0.0
8
4
0
1
3
2
3
Nov 13
@ PHX
L 101-96
32
1-5
20.0
0-2
0.0
1-2
50.0
8
6
0
1
2
5
3
Nov 10
vs CLE
W 124-112
33
4-9
44.4
3-6
50.0
0-0
0.0
4
4
0
2
0
0
11
Nov 7
vs BOS
L 119-80
21
4-8
50.0
3-5
60.0
0-0
0.0
3
0
0
0
3
0
11
Nov 5
@ BKN
L 114-104
31
3-7
42.9
0-4
0.0
4-5
80.0
2
1
0
3
2
0
10
Nov 3
vs DET
L 124-91
21
4-6
66.7
3-4
75.0
0-0
0.0
4
3
0
0
3
3
11
Nov 1
vs PHI
L 109-104
18
2-4
50.0
0-1
0.0
0-0
0.0
2
1
0
0
2
1
4
Oct 31
@ WSH
L 95-79
29
2-10
20.0
1-8
12.5
1-2
50.0
5
4
0
2
3
1
6
Oct 29
@ DET
L 97-89
23
1-6
16.7
1-6
16.7
2-2
100.0
2
3
0
1
2
0
5
Oct 27
vs WSH
W 110-103
29
2-4
50.0
1-3
33.3
0-0
0.0
2
3
0
0
1
1
5
Oct 25
vs MIA
W 115-110
26
0-3
0.0
0-3
0.0
0-0
0.0
5
5
0
0
4
1
0
Oct 24
vs ATL
L 128-81
24
1-7
14.3
1-6
16.7
0-0
0.0
2
5
0
0
4
1
3
Oct 22
@ BKN
W 110-103
27
1-7
14.3
1-6
16.7
0-0
0.0
3
0
0
1
4
1
3
06 / 2026-27 HOME / AWAY, RESULTS, MONTHS AND OPPONENTS
Splits
split
Split
GP
MIN
FG
FG%
3PT
3P%
FT
FT%
OR
DR
REB
AST
BLK
STL
PF
TO
PTS
All Splits
13
26.8
2.0-6.3
31.7
1.2-4.5
25.4
0.6-0.8
72.7
0.6
3.2
3.8
3.0
0.0
0.8
2.5
1.2
5.8
Home
7
24.4
2.4-5.9
41.5
1.6-4.0
39.3
0.0-0.0
0.0
0.6
2.6
3.1
3.0
0.0
0.3
2.4
1.0
6.4
Road
6
29.5
1.5-6.8
22.0
0.7-5.2
12.9
1.3-1.8
72.7
0.7
4.0
4.7
3.0
0.0
1.5
2.7
1.5
5.0
vs. Division
4
26.8
1.3-6.0
20.8
0.8-5.0
15.0
0.3-0.5
50.0
1.0
2.5
3.5
4.3
0.0
0.5
3.0
1.0
3.5
vs. Conference
11
25.5
2.2-6.5
33.8
1.3-4.7
26.9
0.6-0.8
77.8
0.6
2.5
3.1
2.6
0.0
0.8
2.5
0.8
6.3
3+ Days Rest
1
27.0
1.0-7.0
14.3
1.0-6.0
16.7
0.0-0.0
0.0
1.0
2.0
3.0
0.0
0.0
1.0
4.0
1.0
3.0
Month
Split
GP
MIN
FG
FG%
3PT
3P%
FT
FT%
OR
DR
REB
AST
BLK
STL
PF
TO
PTS
October
7
25.0
1.3-5.9
22.0
0.7-4.7
15.2
0.4-0.6
75.0
0.7
2.3
3.0
3.0
0.0
0.6
2.9
0.9
3.7
November
6
28.8
2.8-6.8
41.5
1.7-4.3
38.5
0.8-1.2
71.4
0.5
4.3
4.8
3.0
0.0
1.2
2.2
1.7
8.2
Pre All-Star
13
26.8
2.0-6.3
31.7
1.2-4.5
25.4
0.6-0.8
72.7
0.6
3.2
3.8
3.0
0.0
0.8
2.5
1.2
5.8
Result
Split
GP
MIN
FG
FG%
3PT
3P%
FT
FT%
OR
DR
REB
AST
BLK
STL
PF
TO
PTS
Wins
4
28.5
1.8-5.8
30.4
1.3-4.5
27.8
0.0-0.0
0.0
0.3
3.3
3.5
3.0
0.0
0.8
2.3
0.8
4.8
Losses
9
26.0
2.1-6.6
32.2
1.1-4.6
24.4
0.9-1.2
72.7
0.8
3.2
4.0
3.0
0.0
0.9
2.7
1.4
6.2
Position
Split
GP
MIN
FG
FG%
3PT
3P%
FT
FT%
OR
DR
REB
AST
BLK
STL
PF
TO
PTS
As Starter
11
27.0
1.7-6.1
28.4
1.1-4.5
24.0
0.4-0.5
66.7
0.6
3.5
4.1
3.5
0.0
0.7
2.5
1.5
4.9
Day
Split
GP
MIN
FG
FG%
3PT
3P%
FT
FT%
OR
DR
REB
AST
BLK
STL
PF
TO
PTS
Monday
3
27.7
3.3-6.3
52.6
2.3-4.3
53.8
0.0-0.0
0.0
0.3
3.0
3.3
3.3
0.0
0.7
1.3
1.3
9.0
Wednesday
3
27.0
1.7-6.7
25.0
0.7-5.3
12.5
2.0-2.3
85.7
0.3
2.0
2.3
1.3
0.0
1.7
2.7
0.3
6.0
Thursday
1
32.0
1.0-5.0
20.0
0.0-2.0
0.0
1.0-2.0
50.0
0.0
8.0
8.0
6.0
0.0
1.0
2.0
5.0
3.0
Friday
3
24.3
2.3-8.3
28.0
1.7-6.3
26.3
0.3-0.7
50.0
1.7
1.7
3.3
3.0
0.0
0.7
3.3
0.7
6.7
Saturday
2
22.0
1.0-3.5
28.6
0.0-2.0
0.0
0.0-0.0
0.0
0.0
3.5
3.5
3.0
0.0
0.0
3.0
1.0
2.0
Sunday
1
35.0
1.0-6.0
16.7
1.0-5.0
20.0
0.0-0.0
0.0
1.0
7.0
8.0
4.0
0.0
1.0
3.0
2.0
3.0
Opponent
Split
GP
MIN
FG
FG%
3PT
3P%
FT
FT%
OR
DR
REB
AST
BLK
STL
PF
TO
PTS
Atlanta Hawks
1
24.0
1.0-7.0
14.3
1.0-6.0
16.7
0.0-0.0
0.0
2.0
0.0
2.0
5.0
0.0
0.0
4.0
1.0
3.0
Brooklyn Nets
2
29.0
2.0-7.0
28.6
0.5-5.0
10.0
2.0-2.5
80.0
0.5
2.0
2.5
0.5
0.0
2.0
3.0
0.5
6.5
Boston Celtics
1
21.0
4.0-8.0
50.0
3.0-5.0
60.0
0.0-0.0
0.0
1.0
2.0
3.0
0.0
0.0
0.0
3.0
0.0
11.0
Cleveland Cavaliers
1
33.0
4.0-9.0
44.4
3.0-6.0
50.0
0.0-0.0
0.0
0.0
4.0
4.0
4.0
0.0
2.0
0.0
0.0
11.0
Detroit Pistons
2
22.5
2.5-6.0
41.7
2.0-5.0
40.0
1.0-1.0
100.0
0.5
2.5
3.0
3.0
0.0
0.5
2.5
1.5
8.0
Los Angeles Clippers
1
35.0
1.0-6.0
16.7
1.0-5.0
20.0
0.0-0.0
0.0
1.0
7.0
8.0
4.0
0.0
1.0
3.0
2.0
3.0
Miami Heat
1
26.0
0.0-3.0
0.0
0.0-3.0
0.0
0.0-0.0
0.0
0.0
5.0
5.0
5.0
0.0
0.0
4.0
1.0
0.0
Philadelphia 76ers
1
18.0
2.0-4.0
50.0
0.0-1.0
0.0
0.0-0.0
0.0
0.0
2.0
2.0
1.0
0.0
0.0
2.0
1.0
4.0
Phoenix Suns
1
32.0
1.0-5.0
20.0
0.0-2.0
0.0
1.0-2.0
50.0
0.0
8.0
8.0
6.0
0.0
1.0
2.0
5.0
3.0
Washington Wizards
2
28.5
2.0-7.0
28.6
1.0-5.5
18.2
0.5-1.0
50.0
1.0
2.5
3.5
3.5
0.0
1.0
2.0
1.0
5.5
07 / SEASON-BY-SEASON HISTORY
Career statistics
Regular Season Averages
Season
Team
GP
GS
MIN
FG
FG%
3PT
3P%
FT
FT%
OR
DR
REB
AST
BLK
STL
PF
TO
PTS
2025-26
Charlotte Hornets
82
19
22.5
1.7-4.5
37.1
1.0-2.9
35.2
1.0-1.2
83.7
0.6
2.9
3.5
2.0
0.2
0.6
1.8
0.8
5.4
2026-27
Charlotte Hornets
13
11
26.8
2.0-6.3
31.7
1.2-4.5
25.4
0.6-0.8
72.7
0.6
3.2
3.8
3.0
0.0
0.8
2.5
1.2
5.8
Career
—
95
30
23.1
1.7-4.8
36.1
1.0-3.1
33.2
0.9-1.1
82.6
0.6
2.9
3.5
2.1
0.2
0.7
1.9
0.9
5.4
Regular Season Totals
Season
Team
FG
FG%
3PT
3P%
FT
FT%
OR
DR
REB
AST
BLK
STL
PF
TO
PTS
2025-26
Charlotte Hornets
138-372
37.1
83-236
35.2
82-98
83.7
49
238
287
163
20
52
148
65
441
2026-27
Charlotte Hornets
26-82
31.7
15-59
25.4
8-11
72.7
8
42
50
39
0
11
33
16
75
Career
—
164-454
36.1
98-295
33.2
90-109
82.6
57
280
337
202
20
63
181
81
516
Regular Season Misc Totals
Season
Team
DD2
TD3
DQ
EJECT
TECH
FLAG
AST/TO
STL/TO
SC-EFF
SH-EFF
2025-26
Charlotte Hornets
0
0
0
0
0
0
2.5
0.8
1.185
0.48
2026-27
Charlotte Hornets
0
0
0
0
0
0
2.4
0.7
0.915
0.41
Career
—
0
0
0
0
0
0
2.5
0.8
1.137
0.47
Scoring, rebounding and assist trend
08 / SHOT CHART AND ZONE SHOOTING
Shot profile
Shot-location data is not connected. Add a BALLDONTLIE GOAT-tier NBA API key in NBA Players → Settings to enable shot charts and zone shooting.
LATEST UPDATEJames will start Monday's game against Cleveland.
James will make his ninth start of the season after shifting to the bench for Charlotte's previous two games. He'll take the place of Brandon Miller, who is sidelined Monday with a groin injury.




 Brandon MillerF #24
 Christian AndersonG #5
 Coby WhiteG #3
 Dennis SchroderG #17
 Grant WilliamsF #2
 Grayson AllenG #8
 Hannes SteinbachF #22
 Isaiah WongG #21
 Jarkel JoinerG #20
 Kon KnueppelG #7
 Kylan BoswellG #18
 Latrell Wrightsell Jr.G
 Liam McNeeleyG #33
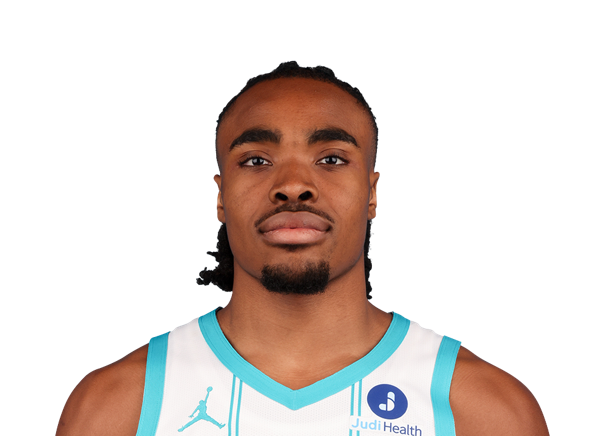 Michael AjayiF #10
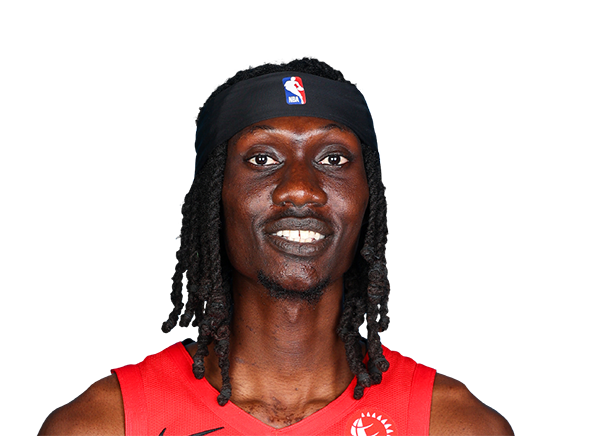 Mouhamadou GueyeF #16
 Moussa DiabateF #14
 Naz ReidC
 Pat ConnaughtonG #21
 PJ HallC #16
 Rob DillinghamG #7
 Royce O’NealeF #00
 Ryan KalkbrennerC #11
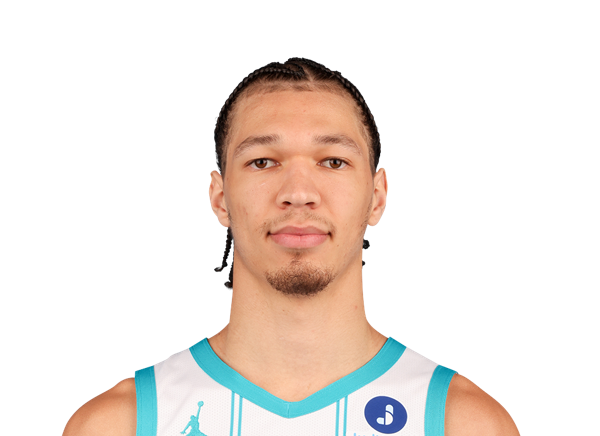 Tidjane SalaunF #31
 Tosan EvbuomwanF #20
 Wyatt FricksF #23
 Xavier TillmanF #26