Click a season to open this player’s full game log, splits and advanced stats for that year; click a team to open its page. A dash means no NBA games were recorded.
03 / EVERY CATEGORY THE PROVIDER REPORTS
Full statistical breakdown
Regular season 2026-27
Defensive
Metric
Total
NBA rank
Blocks
4
Tied-157th
Defensive Rebounds
56
Tied-55th
Steals
15
Tied-42nd
Defensive Rebound Rate
0.0
—
Defensive Rebounds Per Game
4.0
Tied-80th
Blocks Per Game
0.3
Tied-165th
Steals Per Game
1.1
75th
Defensive Rebounds Per 48
6.6
2,640th
Blocks Per 48
0.5
7,536th
Steals Per 48
1.8
2,016th
General
Metric
Total
NBA rank
Disqualifications
0
Tied-21st
Flagrant Fouls
0
Tied-22nd
Fouls
35
Tied-44th
Player Efficiency Rating
17.25
88th
Rebound Rate
0.0
—
Ejections
0
Tied-7th
Technical Fouls
0
Tied-101st
Rebounds
76
—
Value Over Replacement Player
39.5
—
Minutes
410
Tied-1st
Minutes Per Game
29.3
—
Rating
29.4
Tied-33rd
Plus-Minus
+134
Tied-1st
Rebounds Per Game
5.4
Tied-77th
Fouls Per Game
2.5
Tied-84th
Flagrant Fouls Per Game
0.0
Tied-19th
Technical Fouls Per Game
0.0
Tied-82nd
Ejections Per Game
0.0
Tied-6th
Disqualifications Per Game
0.0
Tied-20th
Assist To Turnover Ratio
2.7
—
Steal To Foul Ratio
0.4
—
Block To Foul Ratio
0.1
—
Team Rebounds Per Game
0.0
—
Rebounds
76
—
Total Technical Fouls
0
—
Assist To Turnover Ratio
0.0
—
Steal To Turnover Ratio
0.5
—
Rebounds Per 48 Minutes
8.9
—
Fouls Per 48 Minutes
4.1
2,112th
Flagrant Fouls Per 48 Minutes
0.0
1,056th
Technical Fouls Per 48 Minutes
0.0
4,848th
Ejections Per 48 Minutes
0.0
336th
Disqualifications Per 48 Minutes
0.0
1,008th
R/40
7.4
—
Games Played
14
14th
Games Started
14
Tied-1st
Double Double
1
Tied-65th
Triple Double
0
Tied-12th
Offensive
Metric
Total
NBA rank
Assists
75
Tied-23rd
Effective Field Goal Percentage
50.0
—
Field Goals
83/194
—
Field Goals Attempted
194
28th
Field Goals Made
83
Tied-47th
Field Goal Percentage
42.8
104th
Free Throws
26/33
—
Free Throw Percentage
78.8
133rd
Free Throws Attempted
33
Tied-98th
Free Throws Made
26
Tied-96th
Offensive Rebounds
20
Tied-67th
Points
220
Tied-51st
Turnovers
28
Tied-49th
3-Point Field Goal Percentage
33.7
152nd
3-Point Field Goals Attempted
83
36th
3-Point Field Goals Made
28
Tied-46th
True Shooting Percentage
52.8
—
Total Turnovers
28
—
Assist Ratio
24.1
—
Points in the Paint
0
Tied-1st
Offensive Rebound Rate
0.0
—
Turnover Ratio
9.0
—
Brick Index
0.00
—
Usage Rate
0.0
—
Average Field Goals Made
5.9
58th
Average Field Goals Attempted
13.9
416th
Average 3-Point Field Goals Made
2.0
Tied-73rd
Average 3-Point Field Goals Attempted
5.9
49th
Average Free Throws Made
1.9
Tied-116th
Average Free Throws Attempted
2.4
Tied-118th
Points Per Game
15.7
67th
Offensive Rebounds Per Game
1.4
Tied-78th
Assists Per Game
5.4
32nd
Turnovers Per Game
2.0
70th
Offensive Rebound Percentage
0.2
—
Estimated Possessions
215.2
—
Estimated Possessions Per Game
15.4
—
Points Per Estimated Possession
1.0
—
Team Turnovers Per Game
0.0
—
Total Turnovers Per Game
2.0
—
3-Point Field Goal Percentage
33.7
128th
2-Point Field Goals Made
55.0
Tied-1st
2-Point Field Goals Attempted
111.0
Tied-8th
2-Point Field Goals Made per Game
3.9
—
2-Point Field Goals Attempted per Game
7.9
—
2-Point Field Goal Percentage
49.5
104th
Shooting Efficiency
0.50
—
Scoring Efficiency
1.134
—
Fieldgoals Made Per 48
9.7
2,256th
Fieldgoals Attempted Per 48
22.7
Tied-1,344th
3-Point Fieldgoals Made Per 48
3.3
2,208th
3-Point Fieldgoals Attempted Per 48
9.7
Tied-1,728th
Freethrows Made Per 48
3.0
4,608th
Freethrows Attempted Per 48
3.9
4,704th
Points Scored Per 48
25.8
2,448th
Offensive Rebounds Per 48
2.3
3,216th
Assists Per 48
8.8
1,104th
Turnovers
3.3
2,352nd
P/40
21.5
—
A/40
7.3
—
04 / EFFICIENCY, SHOOTING PROFILE, PER-36
Advanced metrics
True shooting %52.5%
Effective FG %49.6%
2-point FG %48.8%
3-point attempt rate42.4%
Free throw rate17.3%
Points per shot attempt1.13
% of points from 3s38.2%
Assist-to-turnover2.70
Points per 36 min19.3
Rebounds per 36 min6.6
Assists per 36 min6.6
Steals per 36 min1.35
Blocks per 36 min0.37
Turnovers per 36 min2.46
Stocks (STL + BLK) per game1.40
Pts + Reb + Ast per game26.5
Efficiency (EFF) per game17.4
Game Score per game (Hollinger)12.4
Minutes per game29.3
Calculated by BallersCulture from the supplied 2026-27 box-score totals using standard formulas (hover a tile to see the formula). Tracking-based metrics such as BPM, VORP, on/off and RAPTOR are not available from this data source.
05 / 14 GAMES IN 2026-27
Game log: Regular season
Date
Opp
Result
MIN
FG
FG%
3PT
3P%
FT
FT%
REB
AST
BLK
STL
PF
TO
PTS
Nov 16
@ UTAH
W 110-102
35
6-11
54.5
0-2
0.0
8-9
88.9
4
9
0
4
2
2
20
Nov 14
vs GS
W 123-85
25
12-18
66.7
5-8
62.5
3-3
100.0
5
6
1
0
1
1
32
Nov 12
@ CHI
W 124-119
29
5-13
38.5
1-5
20.0
0-0
0.0
1
3
0
2
3
2
11
Nov 10
@ PHX
W 122-96
30
2-9
22.2
0-1
0.0
0-2
0.0
7
7
0
1
2
2
4
Nov 8
@ POR
W 125-103
24
5-12
41.7
2-5
40.0
2-2
100.0
7
5
1
0
2
2
14
Nov 7
@ SAC
W 124-109
28
7-13
53.8
1-3
33.3
4-5
80.0
3
7
0
0
1
1
19
Nov 5
vs DAL
W 112-111
35
6-20
30.0
2-9
22.2
3-4
75.0
10
3
0
0
3
2
17
Nov 3
vs UTAH
W 119-97
26
7-16
43.8
2-7
28.6
0-0
0.0
5
4
1
0
1
0
16
Nov 1
vs MIN
W 121-111
22
0-4
0.0
0-2
0.0
0-0
0.0
5
4
0
1
4
3
0
Oct 29
@ UTAH
W 117-111 OT
38
6-13
46.2
1-4
25.0
1-2
50.0
6
8
1
2
2
3
14
Oct 28
vs SAC
W 130-103
27
4-11
36.4
3-8
37.5
4-4
100.0
5
5
0
1
2
3
15
Oct 25
@ DAL
W 122-106
28
8-18
44.4
3-8
37.5
0-0
0.0
4
8
0
3
3
3
19
Oct 24
vs HOU
L 114-110
33
6-15
40.0
3-9
33.3
0-1
0.0
7
5
0
1
5
1
15
Oct 21
vs OKC
L 116-104
28
9-21
42.9
5-12
41.7
1-1
100.0
7
1
0
0
4
3
24
06 / 2026-27 HOME / AWAY, RESULTS, MONTHS AND OPPONENTS
Splits
split
Split
GP
MIN
FG
FG%
3PT
3P%
FT
FT%
OR
DR
REB
AST
BLK
STL
PF
TO
PTS
All Splits
14
29.3
5.9-13.9
42.8
2.0-5.9
33.7
1.9-2.4
78.8
1.4
4.0
5.4
5.4
0.3
1.1
2.5
2.0
15.7
Home
7
28.1
6.3-15.0
41.9
2.9-7.9
36.4
1.6-1.9
84.6
1.3
5.0
6.3
4.0
0.3
0.4
2.9
1.9
17.0
Road
7
30.4
5.6-12.7
43.8
1.1-4.0
28.6
2.1-2.9
75.0
1.6
3.0
4.6
6.7
0.3
1.7
2.1
2.1
14.4
vs. Division
3
32.0
6.7-17.7
37.7
2.7-8.7
30.8
1.0-1.7
60.0
1.7
5.3
7.0
5.3
0.0
1.3
3.7
2.0
17.0
vs. Conference
13
29.2
6.0-13.9
43.1
2.1-6.0
34.6
2.0-2.5
78.8
1.5
4.2
5.8
5.5
0.3
1.0
2.5
2.0
16.1
3+ Days Rest
1
28.0
9.0-21.0
42.9
5.0-12.0
41.7
1.0-1.0
100.0
2.0
5.0
7.0
1.0
0.0
0.0
4.0
3.0
24.0
Month
Split
GP
MIN
FG
FG%
3PT
3P%
FT
FT%
OR
DR
REB
AST
BLK
STL
PF
TO
PTS
October
6
29.5
5.5-13.7
40.2
2.5-7.2
34.9
1.0-1.3
75.0
1.5
4.2
5.7
5.2
0.2
1.3
3.3
2.7
14.5
November
8
29.1
6.3-14.0
44.6
1.6-5.0
32.5
2.5-3.1
80.0
1.4
3.9
5.3
5.5
0.4
0.9
1.9
1.5
16.6
Pre All-Star
14
29.3
5.9-13.9
42.8
2.0-5.9
33.7
1.9-2.4
78.8
1.4
4.0
5.4
5.4
0.3
1.1
2.5
2.0
15.7
Result
Split
GP
MIN
FG
FG%
3PT
3P%
FT
FT%
OR
DR
REB
AST
BLK
STL
PF
TO
PTS
Wins
12
29.0
5.7-13.2
43.0
1.7-5.2
32.3
2.1-2.6
80.6
1.4
3.8
5.2
5.8
0.3
1.2
2.2
2.0
15.1
Losses
2
30.5
7.5-18.0
41.7
4.0-10.5
38.1
0.5-1.0
50.0
1.5
5.5
7.0
3.0
0.0
0.5
4.5
2.0
19.5
Position
Split
GP
MIN
FG
FG%
3PT
3P%
FT
FT%
OR
DR
REB
AST
BLK
STL
PF
TO
PTS
As Starter
14
29.3
5.9-13.9
42.8
2.0-5.9
33.7
1.9-2.4
78.8
1.4
4.0
5.4
5.4
0.3
1.1
2.5
2.0
15.7
Day
Split
GP
MIN
FG
FG%
3PT
3P%
FT
FT%
OR
DR
REB
AST
BLK
STL
PF
TO
PTS
Monday
2
27.5
4.5-12.5
36.0
1.0-4.0
25.0
0.0-1.0
0.0
2.0
4.0
6.0
5.5
0.5
0.5
1.5
1.0
10.0
Tuesday
2
28.0
6.5-16.0
40.6
4.0-10.0
40.0
2.5-2.5
100.0
1.0
5.0
6.0
3.0
0.0
0.5
3.0
3.0
19.5
Wednesday
3
34.3
5.7-15.3
37.0
1.3-6.0
22.2
1.3-2.0
66.7
2.3
3.3
5.7
4.7
0.3
1.3
2.7
2.3
14.0
Friday
3
29.0
8.3-15.3
54.3
3.0-6.7
45.0
2.3-3.0
77.8
0.7
4.3
5.0
6.0
0.3
0.3
2.3
1.0
22.0
Saturday
3
25.0
4.3-11.3
38.2
1.7-5.0
33.3
0.7-0.7
100.0
1.7
3.7
5.3
5.7
0.3
1.3
3.0
2.7
11.0
Sunday
1
35.0
6.0-11.0
54.5
0.0-2.0
0.0
8.0-9.0
88.9
0.0
4.0
4.0
9.0
0.0
4.0
2.0
2.0
20.0
Opponent
Split
GP
MIN
FG
FG%
3PT
3P%
FT
FT%
OR
DR
REB
AST
BLK
STL
PF
TO
PTS
Chicago Bulls
1
29.0
5.0-13.0
38.5
1.0-5.0
20.0
0.0-0.0
0.0
0.0
1.0
1.0
3.0
0.0
2.0
3.0
2.0
11.0
Dallas Mavericks
2
31.5
7.0-19.0
36.8
2.5-8.5
29.4
1.5-2.0
75.0
2.0
5.0
7.0
5.5
0.0
1.5
3.0
2.5
18.0
Golden State Warriors
1
25.0
12.0-18.0
66.7
5.0-8.0
62.5
3.0-3.0
100.0
1.0
4.0
5.0
6.0
1.0
0.0
1.0
1.0
32.0
Houston Rockets
1
33.0
6.0-15.0
40.0
3.0-9.0
33.3
0.0-1.0
0.0
1.0
6.0
7.0
5.0
0.0
1.0
5.0
1.0
15.0
Minnesota Timberwolves
1
22.0
0.0-4.0
0.0
0.0-2.0
0.0
0.0-0.0
0.0
1.0
4.0
5.0
4.0
0.0
1.0
4.0
3.0
0.0
Phoenix Suns
1
30.0
2.0-9.0
22.2
0.0-1.0
0.0
0.0-2.0
0.0
3.0
4.0
7.0
7.0
0.0
1.0
2.0
2.0
4.0
Portland Trail Blazers
1
24.0
5.0-12.0
41.7
2.0-5.0
40.0
2.0-2.0
100.0
3.0
4.0
7.0
5.0
1.0
0.0
2.0
2.0
14.0
Sacramento Kings
2
28.0
5.5-12.0
45.8
2.0-5.5
36.4
4.0-4.5
88.9
0.0
4.0
4.0
6.0
0.0
0.5
1.5
2.0
17.0
Oklahoma City Thunder
1
28.0
9.0-21.0
42.9
5.0-12.0
41.7
1.0-1.0
100.0
2.0
5.0
7.0
1.0
0.0
0.0
4.0
3.0
24.0
Utah Jazz
3
33.0
6.3-13.3
47.5
1.0-4.3
23.1
3.0-3.7
81.8
1.7
3.3
5.0
7.0
0.7
2.0
1.7
1.7
16.7
07 / SEASON-BY-SEASON HISTORY
Career statistics
Regular Season Averages
Season
Team
GP
GS
MIN
FG
FG%
3PT
3P%
FT
FT%
OR
DR
REB
AST
BLK
STL
PF
TO
PTS
2024-25
San Antonio Spurs
81
47
26.7
5.2-12.2
42.8
1.2-4.1
28.5
3.1-4.2
72.4
1.1
2.6
3.7
4.1
0.3
0.9
2.0
2.2
14.7
2025-26
San Antonio Spurs
68
67
30.0
5.7-12.0
47.1
1.2-3.6
33.2
4.1-5.6
73.4
1.4
3.9
5.3
7.4
0.3
1.1
3.3
3.2
16.7
2026-27
San Antonio Spurs
14
14
29.3
5.9-13.9
42.8
2.0-5.9
33.7
1.9-2.4
78.8
1.4
4.0
5.4
5.4
0.3
1.1
2.5
2.0
15.7
Career
—
163
128
28.3
5.5-12.3
44.6
1.3-4.0
30.9
3.4-4.7
73.2
1.3
3.2
4.5
5.6
0.3
1.0
2.6
2.6
15.6
Regular Season Totals
Season
Team
FG
FG%
3PT
3P%
FT
FT%
OR
DR
REB
AST
BLK
STL
PF
TO
PTS
2024-25
San Antonio Spurs
423-988
42.8
95-333
28.5
249-344
72.4
89
208
297
332
22
74
164
177
1190
2025-26
San Antonio Spurs
385-817
47.1
81-244
33.2
282-384
73.4
98
264
362
502
19
78
222
217
1133
2026-27
San Antonio Spurs
83-194
42.8
28-83
33.7
26-33
78.8
20
56
76
75
4
15
35
28
220
Career
—
891-1999
44.6
204-660
30.9
557-761
73.2
207
528
735
909
45
167
421
422
2543
Regular Season Misc Totals
Season
Team
DD2
TD3
DQ
EJECT
TECH
FLAG
AST/TO
STL/TO
SC-EFF
SH-EFF
2024-25
San Antonio Spurs
6
0
0
0
0
0
1.9
0.4
1.204
0.48
2025-26
San Antonio Spurs
18
5
1
0
3
1
2.3
0.4
1.387
0.52
2026-27
San Antonio Spurs
1
0
0
0
0
0
2.7
0.5
1.134
0.50
Career
—
25
5
1
0
3
1
2.2
0.4
1.272
0.50
Scoring, rebounding and assist trend
08 / SHOT CHART AND ZONE SHOOTING
Shot profile
Shot-location data is not connected. Add a BALLDONTLIE GOAT-tier NBA API key in NBA Players → Settings to enable shot charts and zone shooting.
LATEST UPDATECastle had 20 points (6-11 FG, 0-2 3Pt, 8-9 FT), nine assists, four rebounds and four steals across 35 minutes during Sunday's 110-102 victory over the Jazz.
With De'Aaron Fox (hip) sidelined, Castle took on increased playmaking duties, dishing out a game- and season-high nine assists. The third-year guard also reached the 20-point threshold for a second straight game while tallying a game-high mark in steals. In eight outings this month, he's averaged 16.6 points, 5.5 assists, 5.3 rebounds and 0.9 steals across 29.0 minutes per contest.


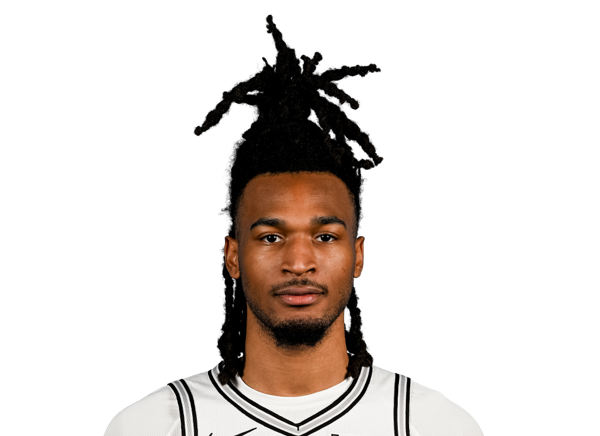

 Bismack BiyomboC #18
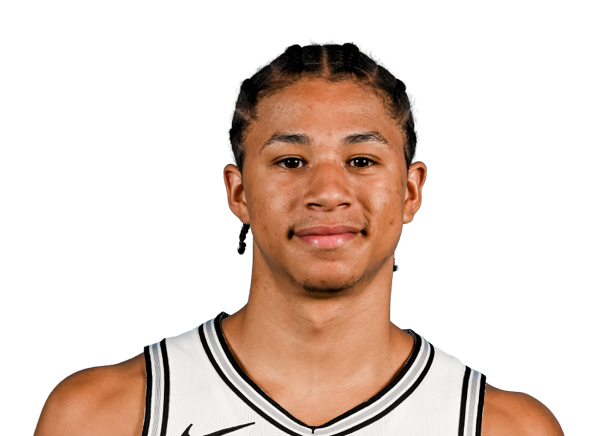 Carter BryantF #11
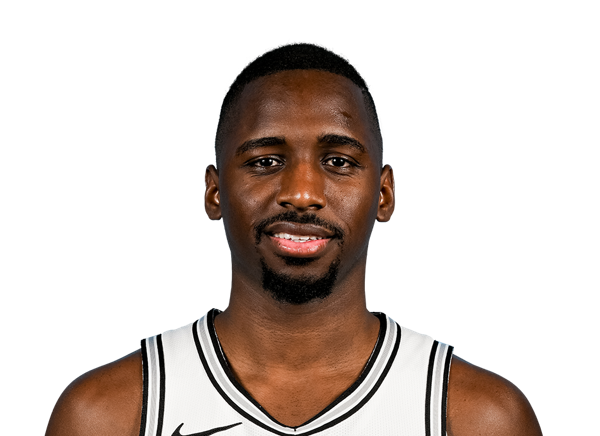 David Jones GarciaF #25
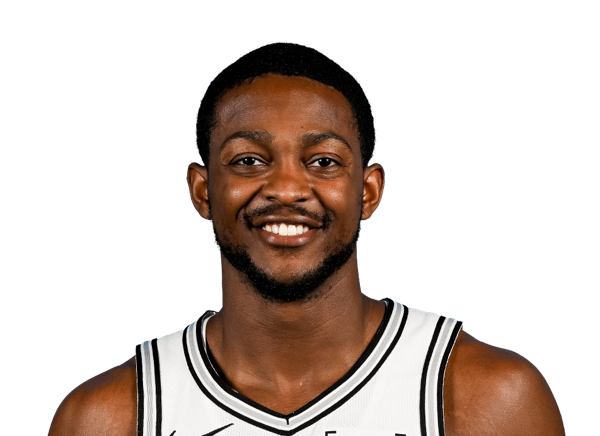 De’Aaron FoxG #4
 Devin VassellG #24
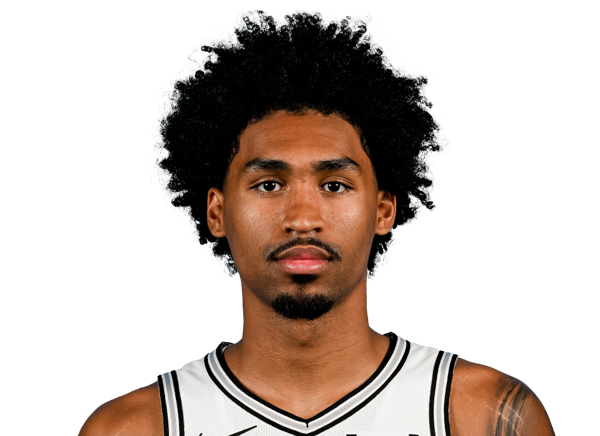 Dylan HarperG #2
 Harrison BarnesF #40
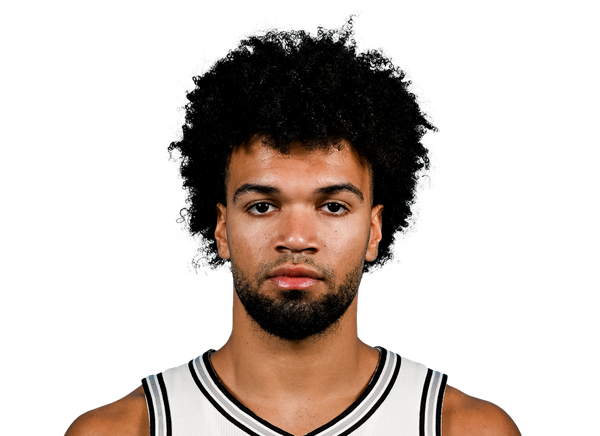 Ja’Kobi GillespieG #17
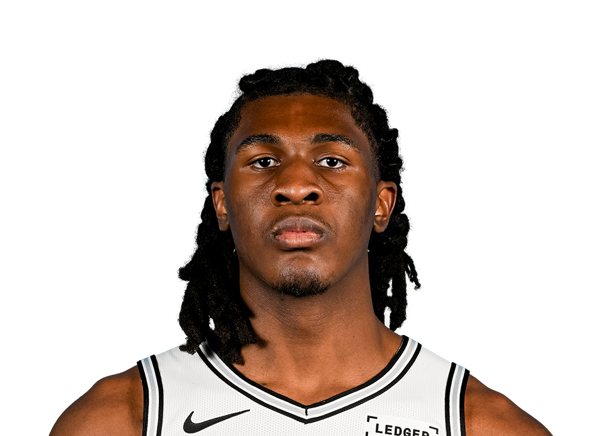 Jayden QuaintanceF #22
 Jon ElmoreG #33
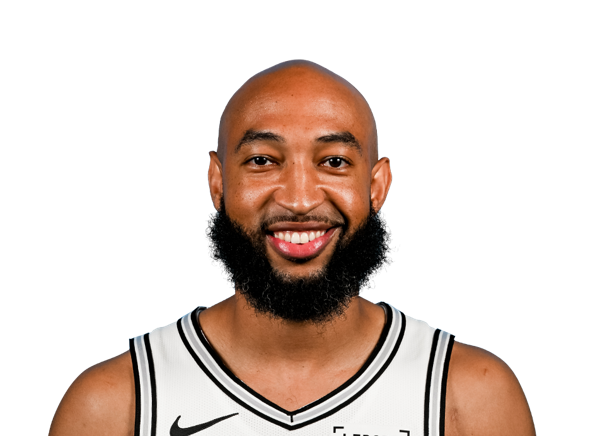 Jordan McLaughlinG
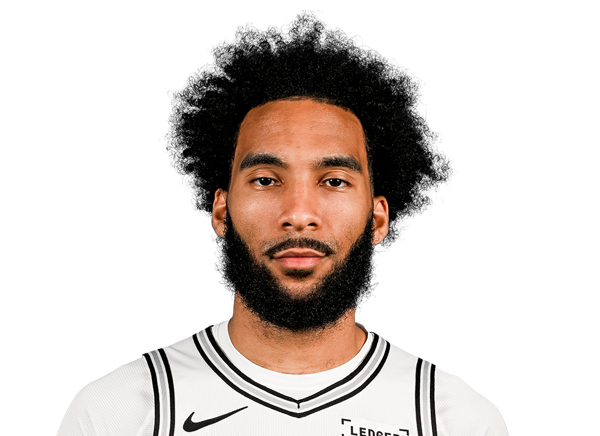 Julian ChampagnieF #30
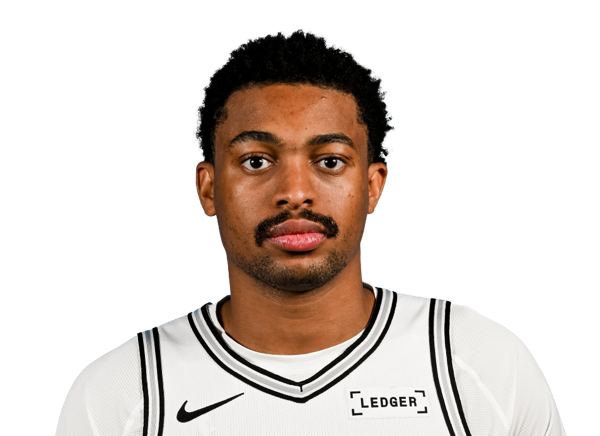 Keldon JohnsonF #3
 Kelly OlynykF #8
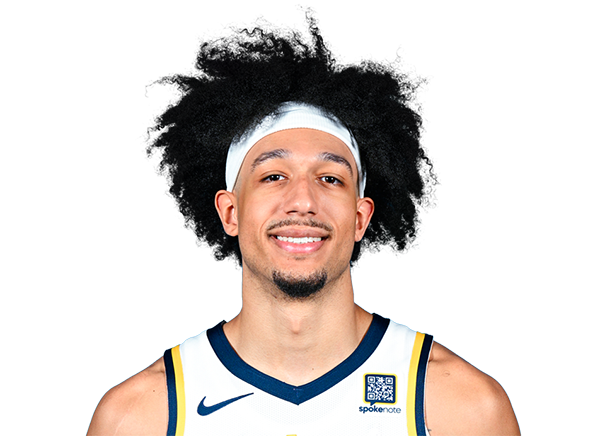 Kendall BrownG
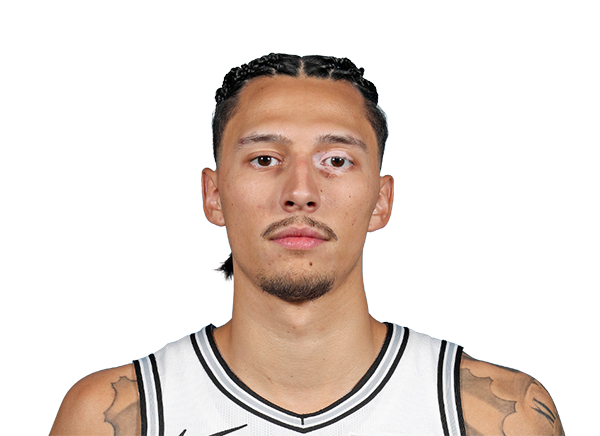 Lindy Waters IIIF #43
 Luke KornetC #7
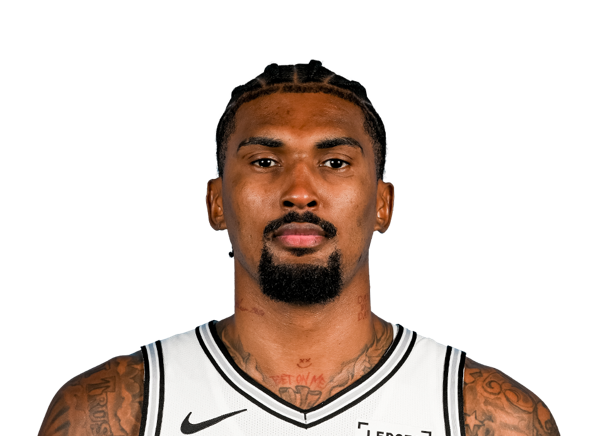 Malik WilliamsC #35
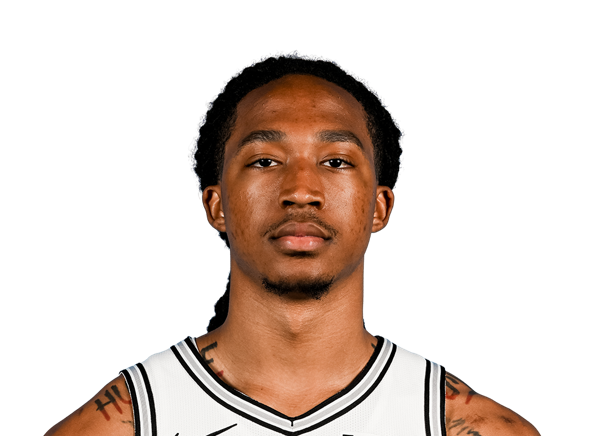 Maliq BrownF #15
 Nate MensahC #31
 RJ DavisG #14
 Taelon PeterG #8
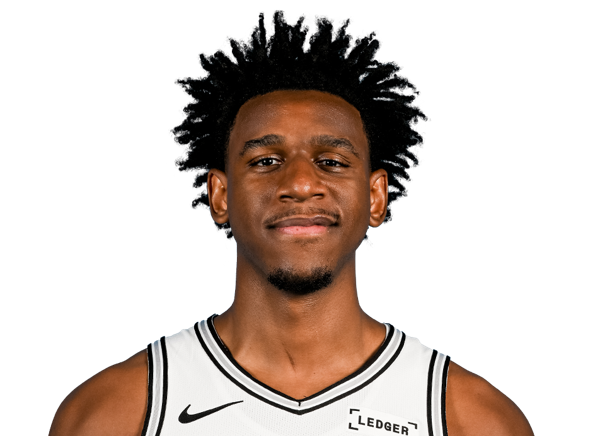 Tarris Reed Jr.C #10
 Terry TaylorF
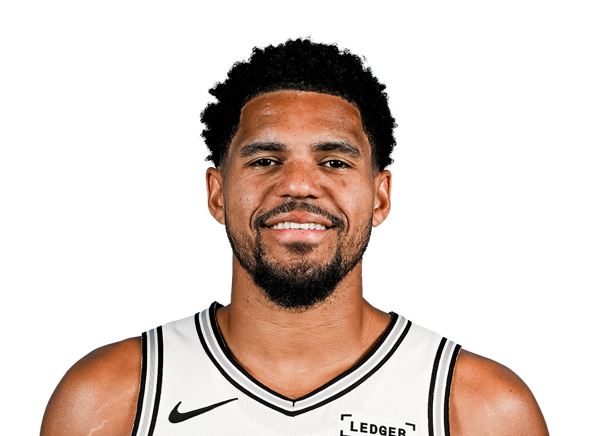 Tobias HarrisF #23
 Victor WembanyamaF #1