

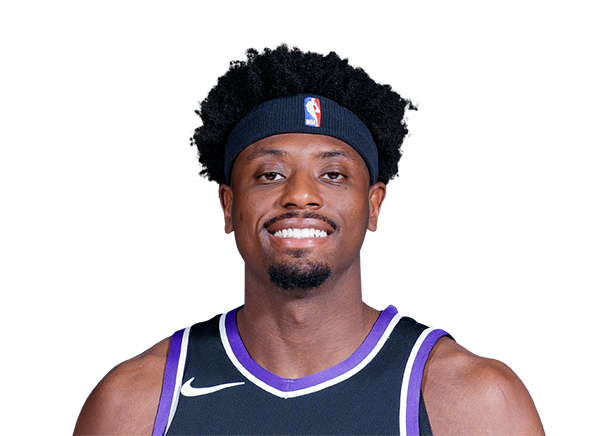
BALLERSCULTURE PLAYER PROFILE · 2026-27
Terry Taylor
San Antonio Spurs · F • 6' 5" 230 lbs

01 / 2026-27 PER-GAME AVERAGES
Season snapshot
No regular-season 2026-27 statistics are recorded for this player. Career history is shown further down.
02 / EVERY SEASON SINCE 2022-23, SIDE BY SIDE
2022-23 to 2026-27
Per game
| Season | Team | GP | GS | MIN | PTS | REB | AST | STL | BLK | TO | FG% | 3P% | FT% |
|---|---|---|---|---|---|---|---|---|---|---|---|---|---|
| 2022-23 | Indiana Pacers | 31 | 2 | 8.5 | 2.9 | 1.5 | 0.3 | 0.1 | 0.2 | 0.3 | 52.0 | 26.3 | 54.5 |
| 2023-24 | Chicago Bulls | 31 | 0 | 6.1 | 1.5 | 1.2 | 0.3 | 0.2 | 0.1 | 0.2 | 51.3 | 22.2 | 80.0 |
| 2024-25 | Sacramento Kings | 3 | 0 | 2.0 | 0.0 | 0.3 | 0.7 | 0.0 | 0.0 | 0.0 | 0.0 | 0.0 | 0.0 |
| 2025-26 | — | — | — | — | — | — | — | — | — | — | — | — | — |
| 2026-27 | — | — | — | — | — | — | — | — | — | — | — | — | — |
Season totals
| Season | Team | GP | GS | MIN | PTS | REB | AST | STL | BLK | TO | FG% | 3P% | FT% |
|---|---|---|---|---|---|---|---|---|---|---|---|---|---|
| 2022-23 | Indiana Pacers | — | — | — | 69 | 39 | 10 | 3 | 5 | 9 | 46.2 | 22.2 | 71.4 |
| 2023-24 | Chicago Bulls | — | — | — | 46 | 37 | 10 | 5 | 2 | 7 | 51.3 | 22.2 | 80.0 |
| 2024-25 | Sacramento Kings | — | — | — | 0 | 1 | 2 | 0 | 0 | 0 | 0.0 | 0.0 | 0.0 |
| 2025-26 | — | — | — | — | — | — | — | — | — | — | — | — | — |
| 2026-27 | — | — | — | — | — | — | — | — | — | — | — | — | — |
Click a season to open this player’s full game log, splits and advanced stats for that year; click a team to open its page. A dash means no NBA games were recorded.
03 / SEASON-BY-SEASON HISTORY
Career statistics
Regular Season Averages
| Season | Team | GP | GS | MIN | FG | FG% | 3PT | 3P% | FT | FT% | OR | DR | REB | AST | BLK | STL | PF | TO | PTS |
|---|---|---|---|---|---|---|---|---|---|---|---|---|---|---|---|---|---|---|---|
| 2021-22 | Indiana Pacers | 33 | 7 | 21.6 | 4.1-6.7 | 61.4 | 0.4-1.2 | 31.6 | 1.1-1.5 | 70.6 | 2.9 | 2.3 | 5.2 | 1.2 | 0.2 | 0.4 | 1.8 | 0.7 | 9.6 |
| 2022-23 | Indiana Pacers | 26 | 2 | 8.8 | 1.2-2.5 | 46.2 | 0.2-0.7 | 22.2 | 0.2-0.3 | 71.4 | 0.8 | 0.7 | 1.5 | 0.4 | 0.2 | 0.1 | 0.9 | 0.3 | 2.7 |
| 2022-23 | Chicago Bulls | 5 | 0 | 7.2 | 1.8-2.0 | 90.0 | 0.2-0.2 | 100.0 | 0.2-0.8 | 25.0 | 1.0 | 0.6 | 1.6 | 0.0 | 0.2 | 0.0 | 0.4 | 0.0 | 4.0 |
| 2022-23 | 2022 23 Totals | 31 | 2 | 8.5 | 1.3-2.4 | 52.0 | 0.2-0.6 | 26.3 | 0.2-0.4 | 54.5 | 0.9 | 0.6 | 1.5 | 0.3 | 0.2 | 0.1 | 0.8 | 0.3 | 2.9 |
| 2023-24 | Chicago Bulls | 31 | 0 | 6.1 | 0.6-1.3 | 51.3 | 0.1-0.3 | 22.2 | 0.1-0.2 | 80.0 | 0.5 | 0.6 | 1.2 | 0.3 | 0.1 | 0.2 | 0.5 | 0.2 | 1.5 |
| 2024-25 | Sacramento Kings | 3 | 0 | 2.0 | 0.0-0.3 | 0.0 | 0.0-0.0 | 0.0 | 0.0-0.0 | 0.0 | 0.3 | 0.0 | 0.3 | 0.7 | 0.0 | 0.0 | 0.0 | 0.0 | 0.0 |
| Career | — | 98 | 9 | 12.0 | 2.0-3.4 | 57.9 | 0.2-0.7 | 28.8 | 0.5-0.7 | 68.7 | 1.4 | 1.2 | 2.6 | 0.6 | 0.2 | 0.2 | 1.1 | 0.4 | 4.6 |
Regular Season Totals
| Season | Team | FG | FG% | 3PT | 3P% | FT | FT% | OR | DR | REB | AST | BLK | STL | PF | TO | PTS |
|---|---|---|---|---|---|---|---|---|---|---|---|---|---|---|---|---|
| 2021-22 | Indiana Pacers | 135-220 | 61.4 | 12-38 | 31.6 | 36-51 | 70.6 | 95 | 77 | 172 | 41 | 8 | 14 | 61 | 23 | 318 |
| 2022-23 | Indiana Pacers | 30-65 | 46.2 | 4-18 | 22.2 | 5-7 | 71.4 | 22 | 17 | 39 | 10 | 5 | 3 | 24 | 9 | 69 |
| 2022-23 | Chicago Bulls | 9-10 | 90.0 | 1-1 | 100.0 | 1-4 | 25.0 | 5 | 3 | 8 | 0 | 1 | 0 | 2 | 0 | 20 |
| 2022-23 | 2022 23 Totals | 39-75 | 52.0 | 5-19 | 26.3 | 6-11 | 54.5 | 27 | 20 | 47 | 10 | 6 | 3 | 26 | 9 | 89 |
| 2023-24 | Chicago Bulls | 20-39 | 51.3 | 2-9 | 22.2 | 4-5 | 80.0 | 17 | 20 | 37 | 10 | 2 | 5 | 17 | 7 | 46 |
| 2024-25 | Sacramento Kings | 0-1 | 0.0 | 0-0 | 0.0 | 0-0 | 0.0 | 1 | 0 | 1 | 2 | 0 | 0 | 0 | 0 | 0 |
| Career | — | 194-335 | 57.9 | 19-66 | 28.8 | 46-67 | 68.7 | 140 | 117 | 257 | 63 | 16 | 22 | 104 | 39 | 453 |
Regular Season Misc Totals
| Season | Team | DD2 | TD3 | DQ | EJECT | TECH | FLAG | AST/TO | STL/TO | SC-EFF | SH-EFF |
|---|---|---|---|---|---|---|---|---|---|---|---|
| 2021-22 | Indiana Pacers | 2 | 0 | 1 | 0 | 0 | 0 | 1.8 | 0.6 | 1.445 | 0.64 |
| 2022-23 | Indiana Pacers | 0 | 0 | 0 | 0 | 0 | 0 | 1.1 | 0.3 | 1.062 | 0.49 |
| 2022-23 | Chicago Bulls | 0 | 0 | 0 | 0 | 0 | 0 | 0.0 | 0.0 | 2.000 | 0.95 |
| 2022-23 | 2022 23 Totals | 0 | 0 | 0 | 0 | 0 | 0 | 1.1 | 0.3 | 1.187 | 0.55 |
| 2023-24 | Chicago Bulls | 0 | 0 | 0 | 0 | 0 | 0 | 1.4 | 0.7 | 1.179 | 0.54 |
| 2024-25 | Sacramento Kings | 0 | 0 | 0 | 0 | 0 | 0 | INF | 0.0 | 0.000 | 0.00 |
| Career | — | 2 | 0 | 1 | 0 | 0 | 0 | 1.6 | 0.6 | 1.352 | 0.61 |
Scoring, rebounding and assist trend
04 / SHOT CHART AND ZONE SHOOTING
Shot profile
Shot-location data is not connected. Add a BALLDONTLIE GOAT-tier NBA API key in NBA Players → Settings to enable shot charts and zone shooting.
05 / RECORD, TEAM STATS AND TEAMMATES
Team
Overall12-2
Home5-2
Road7-0
DIV2-1
CONF11-2
Last Ten Games10-0
Team records for 2026-27 (regular season).
Team statistics 2026-27
Defensive
| Metric | Total | Per game | NBA rank |
|---|---|---|---|
| Blocks | 100 | 7.143 | 1st |
| Defensive Rebounds | 499 | 35.643 | 1st |
| Steals | 120 | 8.571 | Tied-4th |
| Points Conceded Off Turnovers | 0 | 13 | — |
| Defensive Rebound Rate | 0.0 | — | — |
| Defensive Rebounds Per Game | 35.6 | — | — |
| Blocks Per Game | 7.1 | — | — |
| Steals Per Game | 8.6 | — | — |
| Defensive Rebounds Per 48 | 0.0 | — | — |
| Blocks Per 48 | 0.0 | — | — |
| Steals Per 48 | 0.0 | — | — |
General
| Metric | Total | Per game | NBA rank |
|---|---|---|---|
| Disqualifications | 0 | — | — |
| Flagrant Fouls | 1 | 0.071 | Tied-8th |
| Fouls | 272 | 19.429 | 12th |
| Rebound Rate | 53.3 | — | 5th |
| Ejections | 0 | — | — |
| Technical Fouls | 0 | — | — |
| Rebounds | 680 | 48.572 | — |
| Minutes | 0 | — | — |
| Minutes Per Game | 0.0 | — | — |
| Fantasy Rating | 0.0 | — | — |
| Rating | 228.1 | — | — |
| Plus-Minus | -1 | -1 | Tied-1st |
| Game Day of Year | 0 | — | — |
| Rebounds Per Game | 48.6 | — | — |
| Fouls Per Game | 19.4 | — | — |
| Flagrant Fouls Per Game | 0.1 | — | — |
| Technical Fouls Per Game | 0.0 | — | — |
| Ejections Per Game | 0.0 | — | — |
| Disqualifications Per Game | 0.0 | — | — |
| Assist To Turnover Ratio | 2.4 | 2.405 | — |
| Steal To Foul Ratio | 0.4 | 0.441 | — |
| Block To Foul Ratio | 0.4 | 0.368 | — |
| Team Rebounds Per Game | 0.0 | — | — |
| Rebounds | 680 | 48.572 | — |
| Total Technical Fouls | 0 | — | — |
| Assist To Turnover Ratio | 43.6 | — | — |
| Team Rebounds | 0 | — | — |
| Steal To Turnover Ratio | 0.7 | 0.736 | — |
| Rebounds Per 48 Minutes | 0.0 | — | — |
| Fouls Per 48 Minutes | 0.0 | — | — |
| Flagrant Fouls Per 48 Minutes | 0.0 | — | — |
| Technical Fouls Per 48 Minutes | 0.0 | — | — |
| Ejections Per 48 Minutes | 0.0 | — | — |
| Disqualifications Per 48 Minutes | 0.0 | — | — |
| Games Played | 14 | — | Tied-3rd |
| Games Started | 0 | — | — |
| Double Double | 0 | — | — |
| Triple Double | 0 | — | — |
Offensive
| Metric | Total | Per game | NBA rank |
|---|---|---|---|
| Assists | 392 | 28 | 3rd |
| Effective Field Goal Percentage | 53.5 | — | 10th |
| Field Goals | 599/1281 | 0.468 | — |
| Field Goals Attempted | 1281 | 91.5 | 3rd |
| Field Goals Made | 599 | 42.786 | 4th |
| Field Goal Percentage | 46.8 | 0.468 | 7th |
| Free Throws | 293/364 | 0.805 | — |
| Free Throw Percentage | 80.5 | 0.805 | 6th |
| Free Throws Attempted | 364 | 26 | 6th |
| Free Throws Made | 293 | 20.929 | 5th |
| Offensive Rebounds | 181 | 12.929 | 3rd |
| Points | 1663 | 118.786 | 5th |
| Turnovers | 163 | 11.643 | 14th |
| 3-Point Field Goal Percentage | 34.4 | 0.344 | 10th |
| 3-Point Field Goals Attempted | 500 | 35.714 | 9th |
| 3-Point Field Goals Made | 172 | 12.286 | 11th |
| True Shooting Percentage | 57.7 | — | 8th |
| Team Turnovers | 9 | — | Tied-10th |
| Total Turnovers | 172 | 11.643 | — |
| Assist Ratio | 19.6 | — | 3rd |
| Points in the Paint | 766 | 54 | 2nd |
| Offensive Rebound Rate | 29.0 | — | 7th |
| Turnover Ratio | 10.7 | — | 15th |
| Fast Break Points | 279 | — | — |
| Possessions | 1432 | — | 7th |
| Pace Factor | 101.0 | — | 7th |
| Average Field Goals Made | 42.8 | — | — |
| Average Field Goals Attempted | 91.5 | — | — |
| Average 3-Point Field Goals Made | 12.3 | — | — |
| Average 3-Point Field Goals Attempted | 35.7 | — | — |
| Average Free Throws Made | 20.9 | — | — |
| Average Free Throws Attempted | 26.0 | — | — |
| Points Per Game | 118.8 | — | — |
| Offensive Rebounds Per Game | 12.9 | — | — |
| Assists Per Game | 28.0 | — | — |
| Turnovers Per Game | 11.6 | — | — |
| Offensive Rebound Percentage | 0.3 | 0.265 | — |
| Estimated Possessions | 1417.6 | 100.614 | — |
| Estimated Possessions Per Game | 101.3 | — | — |
| Points Per Estimated Possession | 1.2 | 1.181 | — |
| Team Turnovers Per Game | 0.6 | — | — |
| Total Turnovers Per Game | 12.3 | — | — |
| 3-Point Field Goal Percentage | 34.4 | 0.344 | 1st |
| 2-Point Field Goals Made | 427.0 | 30.5 | Tied-7th |
| 2-Point Field Goals Attempted | 781.0 | 55.786 | Tied-6th |
| 2-Point Field Goals Made per Game | 30.5 | — | — |
| 2-Point Field Goals Attempted per Game | 55.8 | — | — |
| 2-Point Field Goal Percentage | 54.7 | 0.547 | — |
| Shooting Efficiency | 0.53 | 0.535 | — |
| Scoring Efficiency | 1.298 | 1.298 | — |
| Fieldgoals Made Per 48 | 0.0 | — | — |
| Fieldgoals Attempted Per 48 | 0.0 | — | — |
| 3-Point Fieldgoals Made Per 48 | 0.0 | — | — |
| 3-Point Fieldgoals Attempted Per 48 | 0.0 | — | — |
| Freethrows Made Per 48 | 0.0 | — | — |
| Freethrows Attempted Per 48 | 0.0 | — | — |
| Points Scored Per 48 | 0.0 | — | — |
| Offensive Rebounds Per 48 | 0.0 | — | — |
| Assists Per 48 | 0.0 | — | — |
| Turnovers | 0.0 | — | — |
Teammates
 Bismack BiyomboC #18
 Carter BryantF #11
 David Jones GarciaF #25
 De’Aaron FoxG #4
 Devin VassellG #24
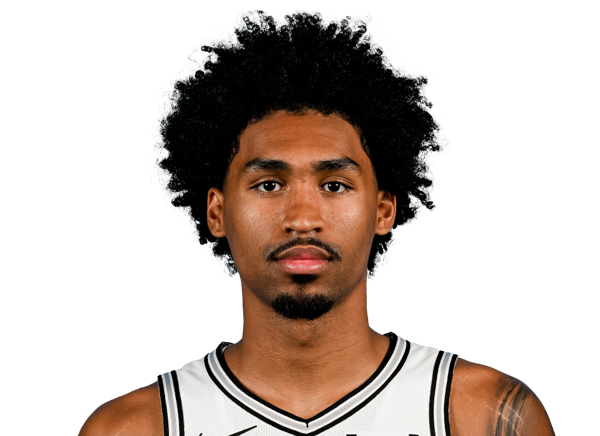 Dylan HarperG #2
 Harrison BarnesF #40
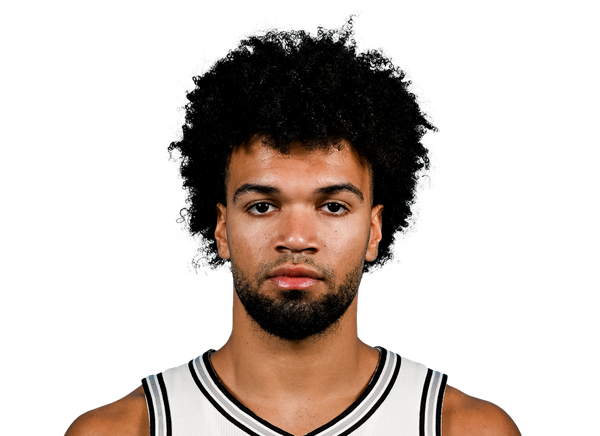 Ja’Kobi GillespieG #17
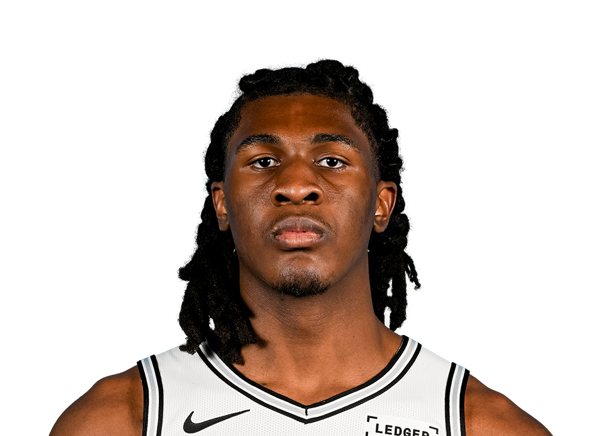 Jayden QuaintanceF #22
 Jon ElmoreG #33
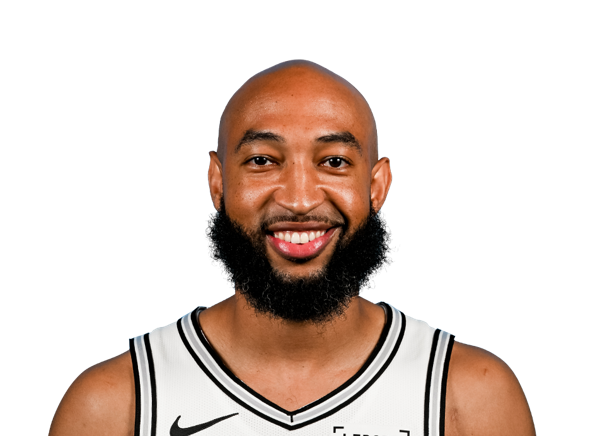 Jordan McLaughlinG
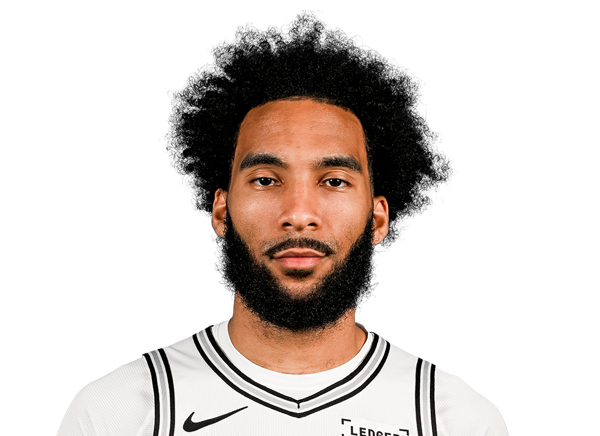 Julian ChampagnieF #30
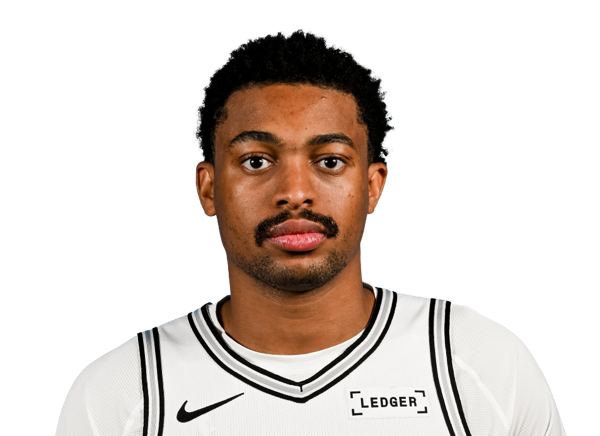 Keldon JohnsonF #3
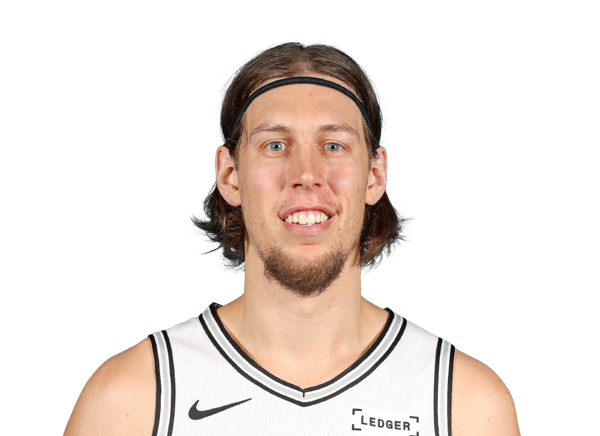 Kelly OlynykF #8
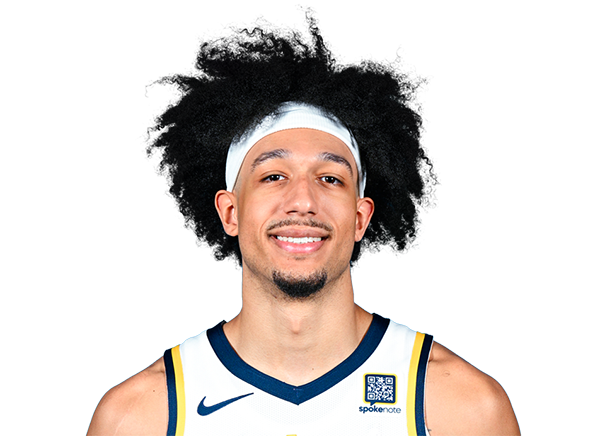 Kendall BrownG
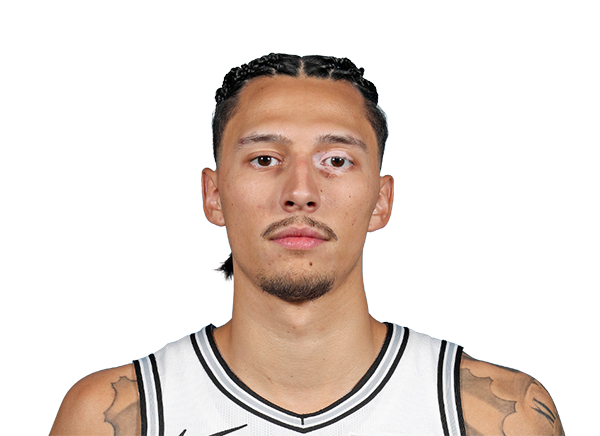 Lindy Waters IIIF #43
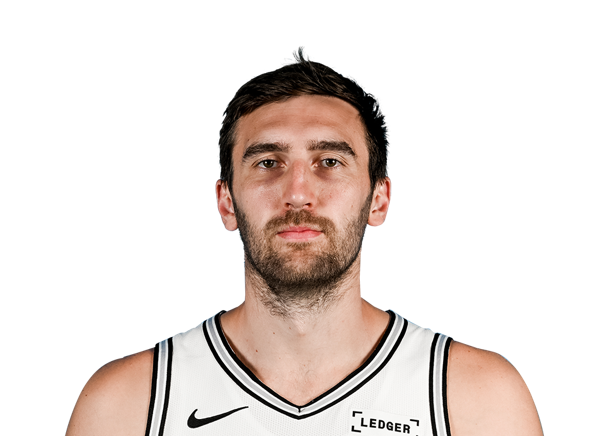 Luke KornetC #7
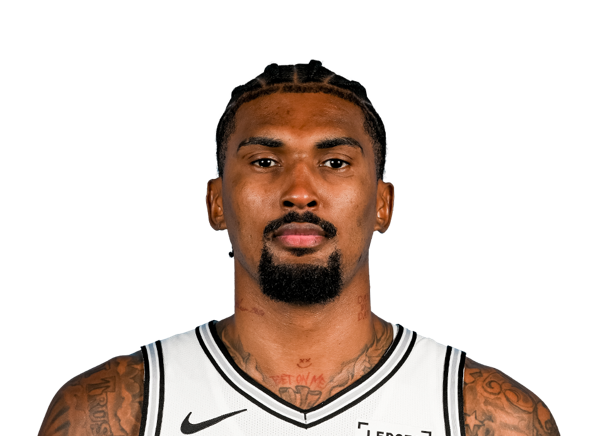 Malik WilliamsC #35
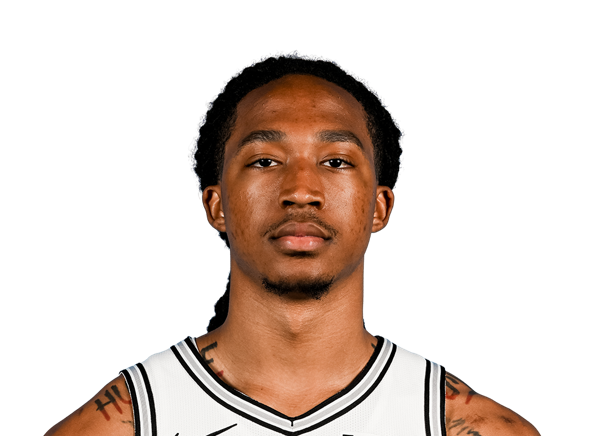 Maliq BrownF #15
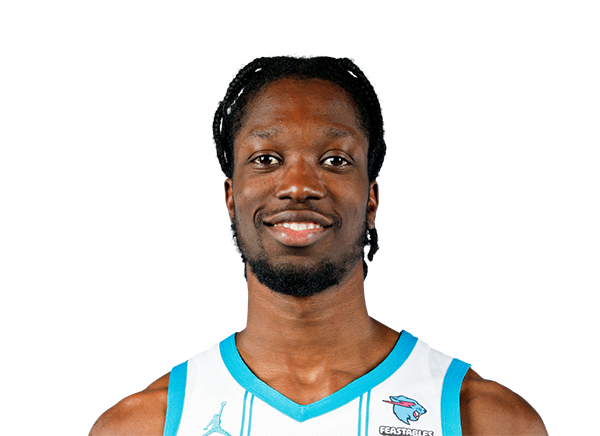 Nate MensahC #31
 RJ DavisG #14
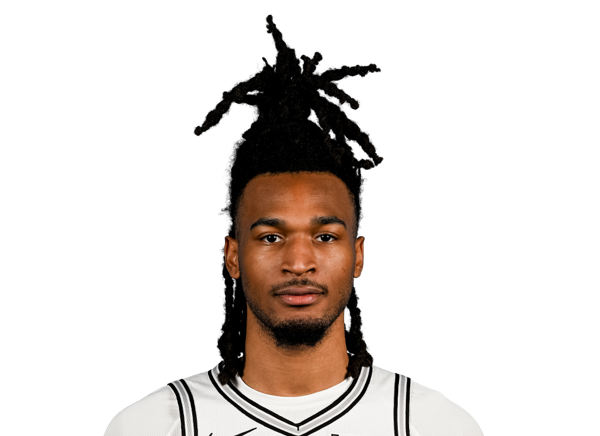 Stephon CastleG #5
 Taelon PeterG #8
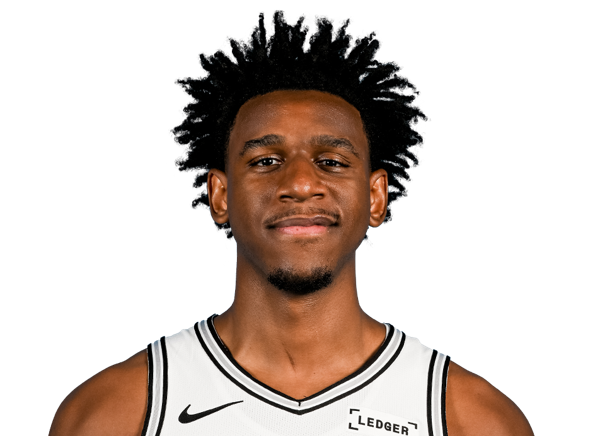 Tarris Reed Jr.C #10
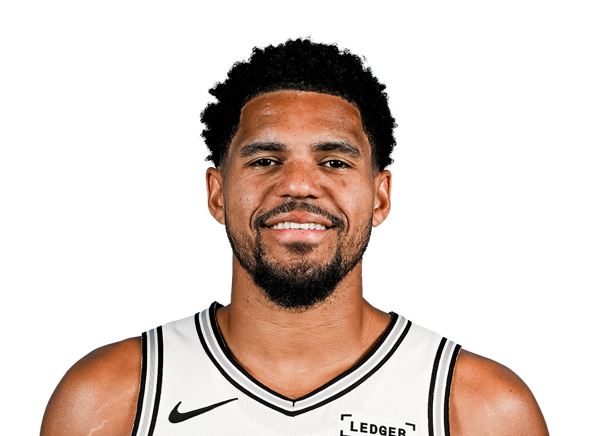 Tobias HarrisF #23
 Victor WembanyamaF #1
06 / SALARY BY SEASON
Contract
| Season | Salary |
|---|---|
| 2021-22 | $600,000 |
| 2022-23 | $1.56M |
| 2023-24 | $2.02M |
Total listed: $4.18M · source: espn.
07 / LATEST REPORT
Injury status
No current injury report entry for this player.
08 / SIGNINGS, TRADES AND ROSTER MOVES
Transactions
- Waived G Taelon Peter, F Terry Taylor and C Malik Williams.
09 / LATEST COVERAGE
Player news
LATEST UPDATEThe Kings recalled Taylor from the G League's Stockton Kings on Thursday.
The 25-year-old played for Stockton in Wednesday's 122-106 G League win over the Sioux Falls Skyforce, during which he posted 23 points (11-17 FG, 1-4 3Pt, 0-1 FT), 13 rebounds, three assists, one steal and one block across 38 minutes. He was recalled the following morning and played two minutes at the end of Sacramento's 128-107 win over Portland on Thursday night.
31 March 2026Pullin scores 35 as Wolves roll past Blue↗
19 March 2026Julian Phillips scores game-high 39 points to lead Wolves over Stars↗
12 March 2026South Bay Lakers hold off Iowa Wolves, tie franchise record with 10th straight win↗
18 November 202676ers' Brown (hamstring) to miss Wednesday's game vs. Magic↗
18 November 2026NBA buzz: Latest on trades, news, roster moves and intel↗
18 November 2026Hawks lose guard CJ McCollum for at least 4 weeks with calf strain↗
18 November 2026Fantasy notebook: Karabell on Walker Kessler, Joel Embiid, Davion Mitchell, more↗
18 November 2026Fantasy basketball adds and NBA bets: Ride with Doncic and Grimes on Tuesday↗
10 / BIO, DRAFT AND CONTACT DETAILS
Biography & profile
TeamSan Antonio Spurs
PositionForward
Height6' 5"
Weight230 lbs
Age27
CollegeAustin Peay
StatusFree Agent