Click a season to open this player’s full game log, splits and advanced stats for that year; click a team to open its page. A dash means no NBA games were recorded.
03 / EVERY CATEGORY THE PROVIDER REPORTS
Full statistical breakdown
Regular season 2026-27
Defensive
Metric
Total
NBA rank
Blocks
8
Tied-87th
Defensive Rebounds
50
Tied-78th
Steals
12
Tied-98th
Defensive Rebound Rate
0.0
—
Defensive Rebounds Per Game
3.6
Tied-95th
Blocks Per Game
0.6
Tied-99th
Steals Per Game
0.9
119th
Defensive Rebounds Per 48
6.6
3,744th
Blocks Per 48
1.1
4,176th
Steals Per 48
1.6
4,704th
General
Metric
Total
NBA rank
Disqualifications
0
Tied-22nd
Flagrant Fouls
0
Tied-24th
Fouls
30
Tied-114th
Player Efficiency Rating
12.63
188th
Rebound Rate
0.0
—
Ejections
0
Tied-7th
Technical Fouls
0
Tied-104th
Rebounds
57
—
Value Over Replacement Player
10.0
—
Minutes
365
Tied-1st
Minutes Per Game
26.1
—
Rating
18.2
Tied-47th
Plus-Minus
+75
Tied-1st
Rebounds Per Game
4.1
Tied-127th
Fouls Per Game
2.1
Tied-146th
Flagrant Fouls Per Game
0.0
Tied-21st
Technical Fouls Per Game
0.0
Tied-84th
Ejections Per Game
0.0
Tied-6th
Disqualifications Per Game
0.0
Tied-21st
Assist To Turnover Ratio
2.3
—
Steal To Foul Ratio
0.4
—
Block To Foul Ratio
0.3
—
Team Rebounds Per Game
0.0
—
Rebounds
57
—
Total Technical Fouls
0
—
Assist To Turnover Ratio
0.0
—
Steal To Turnover Ratio
1.3
—
Rebounds Per 48 Minutes
7.5
—
Fouls Per 48 Minutes
3.9
5,472nd
Flagrant Fouls Per 48 Minutes
0.0
1,152nd
Technical Fouls Per 48 Minutes
0.0
4,992nd
Ejections Per 48 Minutes
0.0
336th
Disqualifications Per 48 Minutes
0.0
1,056th
R/40
6.2
—
Games Played
14
14th
Games Started
3
Tied-181st
Double Double
0
Tied-121st
Triple Double
0
Tied-13th
Offensive
Metric
Total
NBA rank
Assists
21
Tied-190th
Effective Field Goal Percentage
60.8
—
Field Goals
44/102
—
Field Goals Attempted
102
Tied-143rd
Field Goals Made
44
Tied-151st
Field Goal Percentage
43.1
—
Free Throws
10/11
—
Free Throw Percentage
90.9
Tied-29th
Free Throws Attempted
11
Tied-250th
Free Throws Made
10
Tied-228th
Offensive Rebounds
7
Tied-236th
Points
134
Tied-130th
Turnovers
9
Tied-232nd
3-Point Field Goal Percentage
41.9
58th
3-Point Field Goals Attempted
86
Tied-35th
3-Point Field Goals Made
36
Tied-19th
True Shooting Percentage
62.7
—
Total Turnovers
9
—
Assist Ratio
15.3
—
Points in the Paint
0
Tied-1st
Offensive Rebound Rate
0.0
—
Turnover Ratio
6.6
—
Brick Index
0.00
—
Usage Rate
0.0
—
Average Field Goals Made
3.1
—
Average Field Goals Attempted
7.3
288th
Average 3-Point Field Goals Made
2.6
Tied-28th
Average 3-Point Field Goals Attempted
6.1
47th
Average Free Throws Made
0.7
—
Average Free Throws Attempted
0.8
Tied-232nd
Points Per Game
9.6
149th
Offensive Rebounds Per Game
0.5
Tied-226th
Assists Per Game
1.5
Tied-189th
Turnovers Per Game
0.6
231st
Offensive Rebound Percentage
0.1
—
Estimated Possessions
108.4
—
Estimated Possessions Per Game
7.7
—
Points Per Estimated Possession
1.2
—
Team Turnovers Per Game
0.0
—
Total Turnovers Per Game
0.6
—
3-Point Field Goal Percentage
41.9
43rd
2-Point Field Goals Made
8.0
Tied-132nd
2-Point Field Goals Attempted
16.0
Tied-108th
2-Point Field Goals Made per Game
0.6
—
2-Point Field Goals Attempted per Game
1.1
—
2-Point Field Goal Percentage
50.0
—
Shooting Efficiency
0.61
—
Scoring Efficiency
1.314
—
Fieldgoals Made Per 48
5.8
7,248th
Fieldgoals Attempted Per 48
13.4
6,864th
3-Point Fieldgoals Made Per 48
4.7
912th
3-Point Fieldgoals Attempted Per 48
11.3
1,680th
Freethrows Made Per 48
1.3
10,944th
Freethrows Attempted Per 48
1.4
12,000th
Points Scored Per 48
17.6
6,240th
Offensive Rebounds Per 48
0.9
11,328th
Assists Per 48
2.8
9,120th
Turnovers
1.2
11,136th
P/40
14.7
—
A/40
2.3
—
04 / EFFICIENCY, SHOOTING PROFILE, PER-36
Advanced metrics
True shooting %62.7%
Effective FG %60.3%
2-point FG %41.7%
3-point attempt rate83.6%
Free throw rate11.0%
Points per shot attempt1.32
% of points from 3s81.3%
Assist-to-turnover2.50
Points per 36 min13.2
Rebounds per 36 min5.7
Assists per 36 min2.1
Steals per 36 min1.24
Blocks per 36 min0.83
Turnovers per 36 min0.83
Stocks (STL + BLK) per game1.50
Pts + Reb + Ast per game15.2
Efficiency (EFF) per game11.8
Game Score per game (Hollinger)8.1
Minutes per game26.1
Calculated by BallersCulture from the supplied 2026-27 box-score totals using standard formulas (hover a tile to see the formula). Tracking-based metrics such as BPM, VORP, on/off and RAPTOR are not available from this data source.
05 / 14 GAMES IN 2026-27
Game log: Regular season
Date
Opp
Result
MIN
FG
FG%
3PT
3P%
FT
FT%
REB
AST
BLK
STL
PF
TO
PTS
Nov 16
@ UTAH
W 110-102
24
1-6
16.7
1-3
33.3
1-1
100.0
5
1
0
0
2
2
4
Nov 14
vs GS
W 123-85
23
3-8
37.5
1-5
20.0
0-0
0.0
8
3
1
0
2
1
7
Nov 12
@ CHI
W 124-119
35
4-7
57.1
3-6
50.0
1-1
100.0
0
2
1
2
2
0
12
Nov 10
@ PHX
W 122-96
27
4-11
36.4
3-9
33.3
0-0
0.0
3
2
0
2
1
2
11
Nov 8
@ POR
W 125-103
21
4-7
57.1
4-7
57.1
2-2
100.0
4
0
0
0
1
0
14
Nov 7
@ SAC
W 124-109
22
3-5
60.0
2-4
50.0
0-0
0.0
7
2
0
0
0
1
8
Nov 5
vs DAL
W 112-111
21
0-6
0.0
0-5
0.0
0-0
0.0
4
3
0
1
5
0
0
Nov 3
vs UTAH
W 119-97
22
2-5
40.0
2-5
40.0
2-3
66.7
6
0
0
0
4
1
8
Nov 1
vs MIN
W 121-111
27
3-7
42.9
3-7
42.9
3-3
100.0
3
1
0
1
5
0
12
Oct 29
@ UTAH
W 117-111 OT
31
2-5
40.0
2-4
50.0
0-0
0.0
6
0
0
0
2
0
6
Oct 28
vs SAC
W 130-103
25
9-14
64.3
8-13
61.5
0-0
0.0
3
3
0
0
1
1
26
Oct 25
@ DAL
W 122-106
28
4-8
50.0
3-7
42.9
1-1
100.0
5
3
3
1
1
0
12
Oct 24
vs HOU
L 114-110
28
2-5
40.0
2-5
40.0
0-0
0.0
0
0
0
3
1
1
6
Oct 21
vs OKC
L 116-104
30
3-8
37.5
2-6
33.3
0-0
0.0
3
1
3
2
3
0
8
06 / 2026-27 HOME / AWAY, RESULTS, MONTHS AND OPPONENTS
Splits
split
Split
GP
MIN
FG
FG%
3PT
3P%
FT
FT%
OR
DR
REB
AST
BLK
STL
PF
TO
PTS
All Splits
14
26.1
3.1-7.3
43.1
2.6-6.1
41.9
0.7-0.8
90.9
0.5
3.6
4.1
1.5
0.6
0.9
2.1
0.6
9.6
Home
7
25.1
3.1-7.6
41.5
2.6-6.6
39.1
0.7-0.9
83.3
0.9
3.0
3.9
1.6
0.6
1.0
3.0
0.6
9.6
Road
7
27.0
3.1-7.0
44.9
2.6-5.7
45.0
0.7-0.7
100.0
0.1
4.1
4.3
1.4
0.6
0.7
1.3
0.7
9.6
vs. Division
3
25.7
2.0-6.3
31.6
1.7-5.7
29.4
0.3-0.3
100.0
0.3
2.7
3.0
2.0
1.0
1.7
2.3
0.3
6.0
vs. Conference
13
25.5
3.1-7.3
42.1
2.5-6.2
41.2
0.7-0.8
90.0
0.5
3.8
4.4
1.5
0.5
0.8
2.2
0.7
9.4
3+ Days Rest
1
30.0
3.0-8.0
37.5
2.0-6.0
33.3
0.0-0.0
0.0
1.0
2.0
3.0
1.0
3.0
2.0
3.0
0.0
8.0
Month
Split
GP
MIN
FG
FG%
3PT
3P%
FT
FT%
OR
DR
REB
AST
BLK
STL
PF
TO
PTS
October
6
28.3
3.8-7.8
48.9
3.3-7.0
47.6
0.7-0.7
100.0
0.5
2.8
3.3
1.3
1.0
1.2
2.2
0.3
11.7
November
8
24.4
2.6-6.9
38.2
2.0-5.5
36.4
0.8-0.9
85.7
0.5
4.1
4.6
1.6
0.3
0.6
2.1
0.9
8.0
Pre All-Star
14
26.1
3.1-7.3
43.1
2.6-6.1
41.9
0.7-0.8
90.9
0.5
3.6
4.1
1.5
0.6
0.9
2.1
0.6
9.6
Result
Split
GP
MIN
FG
FG%
3PT
3P%
FT
FT%
OR
DR
REB
AST
BLK
STL
PF
TO
PTS
Wins
12
25.6
3.3-7.4
43.8
2.7-6.3
42.7
0.8-0.9
90.9
0.5
4.0
4.5
1.7
0.4
0.6
2.2
0.7
10.0
Losses
2
29.5
2.5-6.5
38.5
2.0-5.5
36.4
0.0-0.0
0.0
0.5
1.0
1.5
0.5
1.5
2.5
2.0
0.5
7.0
Position
Split
GP
MIN
FG
FG%
3PT
3P%
FT
FT%
OR
DR
REB
AST
BLK
STL
PF
TO
PTS
As Starter
3
28.7
3.0-8.0
37.5
2.3-6.0
38.9
0.7-0.7
100.0
0.3
2.3
2.7
1.7
0.3
1.3
1.7
1.3
9.0
Day
Split
GP
MIN
FG
FG%
3PT
3P%
FT
FT%
OR
DR
REB
AST
BLK
STL
PF
TO
PTS
Monday
2
25.0
3.0-8.0
37.5
2.5-7.0
35.7
1.0-1.5
66.7
0.5
4.0
4.5
1.0
0.0
1.0
2.5
1.5
9.5
Tuesday
2
27.5
6.0-11.0
54.5
5.0-9.5
52.6
0.0-0.0
0.0
0.5
2.5
3.0
2.0
1.5
1.0
2.0
0.5
17.0
Wednesday
3
29.0
2.0-6.0
33.3
1.7-5.0
33.3
0.3-0.3
100.0
0.3
3.0
3.3
1.7
0.3
1.0
3.0
0.0
6.0
Friday
3
24.3
2.7-6.0
44.4
1.7-4.7
35.7
0.0-0.0
0.0
0.3
4.7
5.0
1.7
0.3
1.0
1.0
1.0
7.0
Saturday
3
25.7
3.7-7.3
50.0
3.3-7.0
47.6
2.0-2.0
100.0
0.7
3.3
4.0
1.3
1.0
0.7
2.3
0.0
12.7
Sunday
1
24.0
1.0-6.0
16.7
1.0-3.0
33.3
1.0-1.0
100.0
1.0
4.0
5.0
1.0
0.0
0.0
2.0
2.0
4.0
Opponent
Split
GP
MIN
FG
FG%
3PT
3P%
FT
FT%
OR
DR
REB
AST
BLK
STL
PF
TO
PTS
Chicago Bulls
1
35.0
4.0-7.0
57.1
3.0-6.0
50.0
1.0-1.0
100.0
0.0
0.0
0.0
2.0
1.0
2.0
2.0
0.0
12.0
Dallas Mavericks
2
24.5
2.0-7.0
28.6
1.5-6.0
25.0
0.5-0.5
100.0
0.5
4.0
4.5
3.0
1.5
1.0
3.0
0.0
6.0
Golden State Warriors
1
23.0
3.0-8.0
37.5
1.0-5.0
20.0
0.0-0.0
0.0
1.0
7.0
8.0
3.0
1.0
0.0
2.0
1.0
7.0
Houston Rockets
1
28.0
2.0-5.0
40.0
2.0-5.0
40.0
0.0-0.0
0.0
0.0
0.0
0.0
0.0
0.0
3.0
1.0
1.0
6.0
Minnesota Timberwolves
1
27.0
3.0-7.0
42.9
3.0-7.0
42.9
3.0-3.0
100.0
2.0
1.0
3.0
1.0
0.0
1.0
5.0
0.0
12.0
Phoenix Suns
1
27.0
4.0-11.0
36.4
3.0-9.0
33.3
0.0-0.0
0.0
0.0
3.0
3.0
2.0
0.0
2.0
1.0
2.0
11.0
Portland Trail Blazers
1
21.0
4.0-7.0
57.1
4.0-7.0
57.1
2.0-2.0
100.0
0.0
4.0
4.0
0.0
0.0
0.0
1.0
0.0
14.0
Sacramento Kings
2
23.5
6.0-9.5
63.2
5.0-8.5
58.8
0.0-0.0
0.0
0.0
5.0
5.0
2.5
0.0
0.0
0.5
1.0
17.0
Oklahoma City Thunder
1
30.0
3.0-8.0
37.5
2.0-6.0
33.3
0.0-0.0
0.0
1.0
2.0
3.0
1.0
3.0
2.0
3.0
0.0
8.0
Utah Jazz
3
26.0
1.7-5.3
31.3
1.7-4.0
41.7
1.0-1.3
75.0
0.7
5.0
5.7
0.3
0.0
0.0
2.7
1.0
6.0
07 / SEASON-BY-SEASON HISTORY
Career statistics
Regular Season Averages
Season
Team
GP
GS
MIN
FG
FG%
3PT
3P%
FT
FT%
OR
DR
REB
AST
BLK
STL
PF
TO
PTS
2022-23
Philadelphia 76ers
2
0
3.5
0.0-1.0
0.0
0.0-0.5
0.0
0.0-0.0
0.0
0.0
0.0
0.0
0.0
0.0
0.5
0.0
0.0
0.0
2022-23
San Antonio Spurs
15
3
20.9
3.9-8.5
46.1
2.2-5.4
40.7
0.9-1.1
82.4
0.7
3.3
4.0
0.7
0.3
0.3
1.7
0.7
11.0
2022-23
2022 23 Totals
17
3
18.8
3.5-7.6
45.4
1.9-4.8
40.2
0.8-1.0
82.4
0.6
2.9
3.5
0.6
0.3
0.4
1.5
0.6
9.7
2023-24
San Antonio Spurs
74
59
19.8
2.2-5.4
40.8
1.4-3.7
36.5
1.0-1.2
81.5
0.6
2.2
2.8
1.4
0.6
0.6
1.0
0.8
6.8
2024-25
San Antonio Spurs
82
29
23.6
3.4-8.1
41.5
2.2-5.9
37.1
1.0-1.1
90.4
0.8
3.1
3.9
1.4
0.4
0.7
1.4
0.9
9.9
2025-26
San Antonio Spurs
82
68
27.6
3.7-8.4
43.7
2.4-6.2
38.1
1.4-1.6
84.4
0.9
4.9
5.8
1.5
0.5
0.8
1.6
0.8
11.1
2026-27
San Antonio Spurs
14
3
26.1
3.1-7.3
43.1
2.6-6.1
41.9
0.7-0.8
90.9
0.5
3.6
4.1
1.5
0.6
0.9
2.1
0.6
9.6
Career
—
269
162
23.6
3.1-7.4
42.5
2.0-5.3
37.8
1.1-1.3
85.4
0.7
3.4
4.1
1.4
0.5
0.7
1.4
0.8
9.4
Regular Season Totals
Season
Team
FG
FG%
3PT
3P%
FT
FT%
OR
DR
REB
AST
BLK
STL
PF
TO
PTS
2022-23
Philadelphia 76ers
0-2
0.0
0-1
0.0
0-0
0.0
0
0
0
0
0
1
0
0
0
2022-23
San Antonio Spurs
59-128
46.1
33-81
40.7
14-17
82.4
10
50
60
10
5
5
26
11
165
2022-23
2022 23 Totals
59-130
45.4
33-82
40.2
14-17
82.4
10
50
60
10
5
6
26
11
165
2023-24
San Antonio Spurs
164-402
40.8
101-277
36.5
75-92
81.5
42
164
206
103
42
48
77
57
504
2024-25
San Antonio Spurs
276-665
41.5
178-480
37.1
85-94
90.4
67
251
318
111
35
61
114
74
815
2025-26
San Antonio Spurs
301-689
43.7
195-512
38.1
114-135
84.4
74
399
473
127
38
62
131
69
911
2026-27
San Antonio Spurs
44-102
43.1
36-86
41.9
10-11
90.9
7
50
57
21
8
12
30
9
134
Career
—
844-1988
42.5
543-1437
37.8
298-349
85.4
200
914
1114
372
128
189
378
220
2529
Regular Season Misc Totals
Season
Team
DD2
TD3
DQ
EJECT
TECH
FLAG
AST/TO
STL/TO
SC-EFF
SH-EFF
2022-23
Philadelphia 76ers
0
0
0
0
0
0
0.0
INF
0.000
0.00
2022-23
San Antonio Spurs
1
0
0
0
1
0
0.9
0.5
1.289
0.59
2022-23
2022 23 Totals
1
0
0
0
1
0
0.9
0.5
1.269
0.58
2023-24
San Antonio Spurs
0
0
0
0
0
0
1.8
0.8
1.254
0.53
2024-25
San Antonio Spurs
0
0
0
1
1
0
1.5
0.8
1.226
0.55
2025-26
San Antonio Spurs
7
0
0
0
1
0
1.8
0.9
1.322
0.58
2026-27
San Antonio Spurs
0
0
0
0
0
0
2.3
1.3
1.314
0.61
Career
—
8
0
0
1
3
0
1.7
0.9
1.272
0.56
Scoring, rebounding and assist trend
08 / SHOT CHART AND ZONE SHOOTING
Shot profile
Shot-location data is not connected. Add a BALLDONTLIE GOAT-tier NBA API key in NBA Players → Settings to enable shot charts and zone shooting.
LATEST UPDATEChampagnie is listed in the starting lineup for Sunday's game against the Jazz.
Champagnie will earn his third start of the season after De'Aaron Fox was ruled out due to a hip injury. Champagnie averaged 11.5 points, 1.5 rebounds, 2.0 assists, 2.0 steals and 3.0 three-pointers in his previous two starts.




 Bismack BiyomboC #18
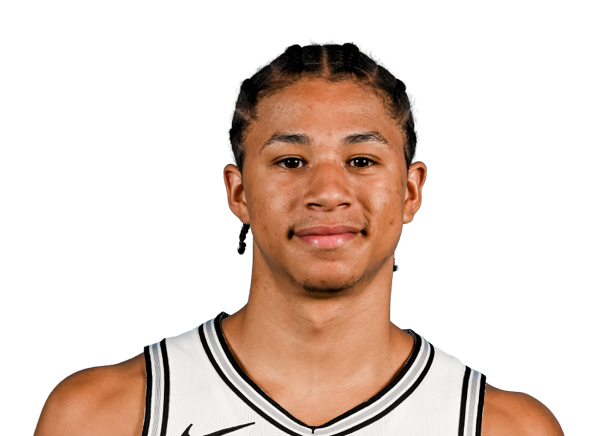 Carter BryantF #11
 David Jones GarciaF #25
 De’Aaron FoxG #4
 Devin VassellG #24
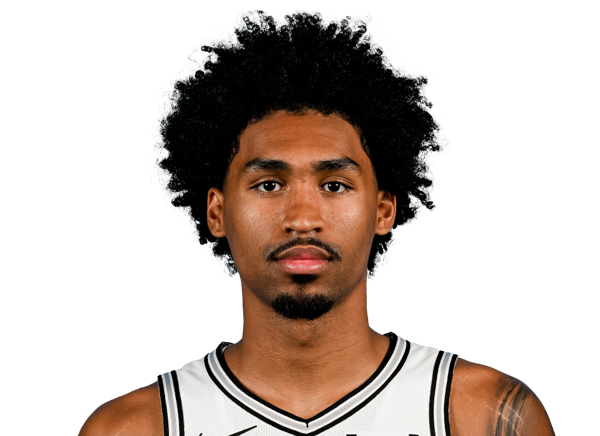 Dylan HarperG #2
 Harrison BarnesF #40
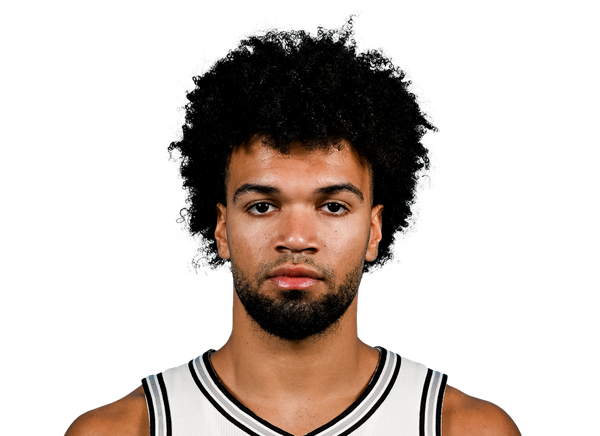 Ja’Kobi GillespieG #17
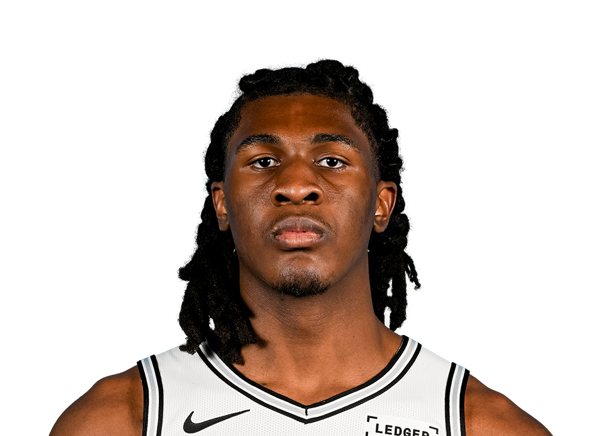 Jayden QuaintanceF #22
 Jon ElmoreG #33
 Jordan McLaughlinG
 Keldon JohnsonF #3
 Kelly OlynykF #8
 Kendall BrownG
 Lindy Waters IIIF #43
 Luke KornetC #7
 Malik WilliamsC #35
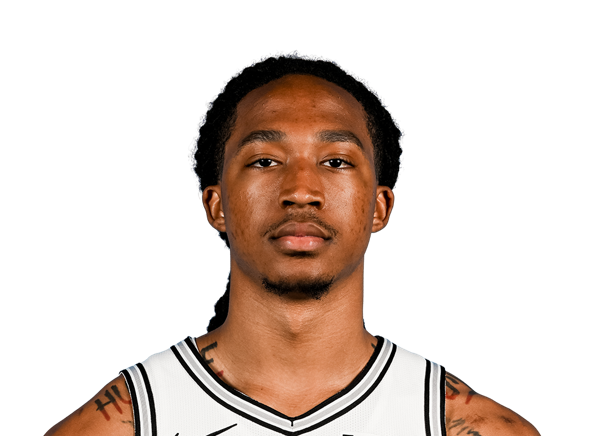 Maliq BrownF #15
 Nate MensahC #31
 RJ DavisG #14
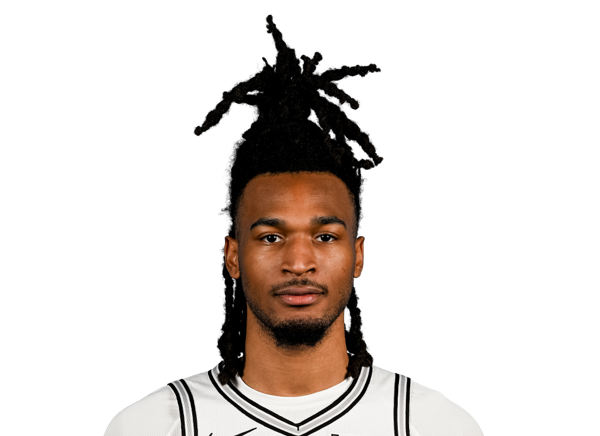 Stephon CastleG #5
 Taelon PeterG #8
 Tarris Reed Jr.C #10
 Terry TaylorF
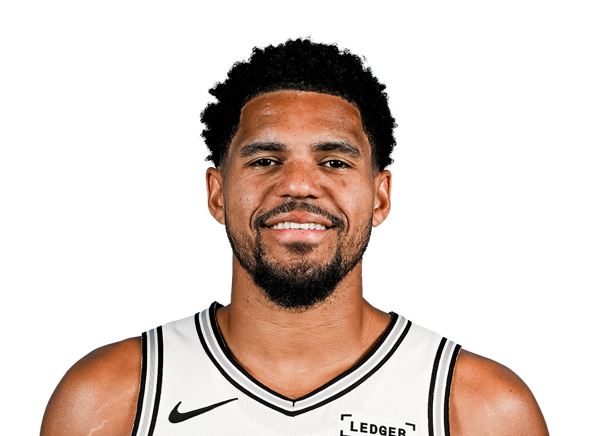 Tobias HarrisF #23
 Victor WembanyamaF #1