Click a season to open this player’s full game log, splits and advanced stats for that year; click a team to open its page. A dash means no NBA games were recorded.
03 / EVERY CATEGORY THE PROVIDER REPORTS
Full statistical breakdown
Regular season 2026-27
Defensive
Metric
Total
NBA rank
Blocks
1
Tied-292nd
Defensive Rebounds
35
Tied-148th
Steals
11
Tied-115th
Defensive Rebound Rate
0.0
—
Defensive Rebounds Per Game
2.5
Tied-170th
Blocks Per Game
0.1
Tied-263rd
Steals Per Game
0.8
136th
Defensive Rebounds Per 48
5.5
2,368th
Blocks Per 48
0.2
4,672nd
Steals Per 48
1.7
1,840th
General
Metric
Total
NBA rank
Disqualifications
0
Tied-22nd
Flagrant Fouls
1
Tied-4th
Fouls
17
Tied-256th
Player Efficiency Rating
21.06
31st
Rebound Rate
0.0
—
Ejections
0
Tied-7th
Technical Fouls
1
Tied-31st
Rebounds
45
—
Value Over Replacement Player
46.4
—
Minutes
303
Tied-3rd
Minutes Per Game
21.6
—
Rating
23.3
Tied-52nd
Plus-Minus
+72
Tied-1st
Rebounds Per Game
3.2
Tied-180th
Fouls Per Game
1.2
Tied-263rd
Flagrant Fouls Per Game
0.1
Tied-13th
Technical Fouls Per Game
0.1
Tied-67th
Ejections Per Game
0.0
Tied-6th
Disqualifications Per Game
0.0
Tied-21st
Assist To Turnover Ratio
3.4
—
Steal To Foul Ratio
0.6
—
Block To Foul Ratio
0.1
—
Team Rebounds Per Game
0.0
—
Rebounds
45
—
Total Technical Fouls
1
—
Assist To Turnover Ratio
0.0
—
Steal To Turnover Ratio
0.5
—
Rebounds Per 48 Minutes
7.1
—
Fouls Per 48 Minutes
2.7
4,096th
Flagrant Fouls Per 48 Minutes
0.2
64th
Technical Fouls Per 48 Minutes
0.2
496th
Ejections Per 48 Minutes
0.0
112th
Disqualifications Per 48 Minutes
0.0
352nd
R/40
5.9
—
Games Played
14
14th
Games Started
3
Tied-181st
Double Double
1
Tied-68th
Triple Double
0
Tied-13th
Offensive
Metric
Total
NBA rank
Assists
75
Tied-27th
Effective Field Goal Percentage
68.3
—
Field Goals
50/93
—
Field Goals Attempted
93
Tied-162nd
Field Goals Made
50
Tied-123rd
Field Goal Percentage
53.8
—
Free Throws
18/18
—
Free Throw Percentage
100.0
Tied-1st
Free Throws Attempted
18
Tied-193rd
Free Throws Made
18
Tied-152nd
Offensive Rebounds
10
Tied-174th
Points
145
Tied-116th
Turnovers
22
Tied-93rd
3-Point Field Goal Percentage
55.1
11th
3-Point Field Goals Attempted
49
Tied-131st
3-Point Field Goals Made
27
Tied-59th
True Shooting Percentage
71.8
—
Total Turnovers
22
—
Assist Ratio
37.9
—
Points in the Paint
0
Tied-1st
Offensive Rebound Rate
0.0
—
Turnover Ratio
11.1
—
Brick Index
0.00
—
Usage Rate
0.0
—
Average Field Goals Made
3.6
—
Average Field Goals Attempted
6.6
271st
Average 3-Point Field Goals Made
1.9
Tied-80th
Average 3-Point Field Goals Attempted
3.5
Tied-150th
Average Free Throws Made
1.3
—
Average Free Throws Attempted
1.3
Tied-193rd
Points Per Game
10.4
Tied-136th
Offensive Rebounds Per Game
0.7
Tied-184th
Assists Per Game
5.4
Tied-34th
Turnovers Per Game
1.6
107th
Offensive Rebound Percentage
0.2
—
Estimated Possessions
112.2
—
Estimated Possessions Per Game
8.0
—
Points Per Estimated Possession
1.3
—
Team Turnovers Per Game
0.0
—
Total Turnovers Per Game
1.6
—
3-Point Field Goal Percentage
55.1
3rd
2-Point Field Goals Made
23.0
Tied-64th
2-Point Field Goals Attempted
44.0
Tied-31st
2-Point Field Goals Made per Game
1.6
—
2-Point Field Goals Attempted per Game
3.1
—
2-Point Field Goal Percentage
52.3
—
Shooting Efficiency
0.68
—
Scoring Efficiency
1.559
—
Fieldgoals Made Per 48
7.9
1,968th
Fieldgoals Attempted Per 48
14.7
2,592nd
3-Point Fieldgoals Made Per 48
4.3
944th
3-Point Fieldgoals Attempted Per 48
7.8
2,096th
Freethrows Made Per 48
2.9
2,432nd
Freethrows Attempted Per 48
2.9
3,088th
Points Scored Per 48
23.0
1,856th
Offensive Rebounds Per 48
1.6
2,784th
Assists Per 48
11.9
432nd
Turnovers
3.5
1,488th
P/40
19.1
—
A/40
9.9
—
04 / EFFICIENCY, SHOOTING PROFILE, PER-36
Advanced metrics
True shooting %72.5%
Effective FG %68.9%
2-point FG %54.8%
3-point attempt rate53.0%
Free throw rate19.7%
Points per shot attempt1.58
% of points from 3s54.8%
Assist-to-turnover3.38
Points per 36 min17.3
Rebounds per 36 min5.3
Assists per 36 min9.0
Steals per 36 min1.33
Blocks per 36 min0.17
Turnovers per 36 min2.67
Stocks (STL + BLK) per game0.90
Pts + Reb + Ast per game19.0
Efficiency (EFF) per game15.3
Game Score per game (Hollinger)11.0
Minutes per game21.6
Calculated by BallersCulture from the supplied 2026-27 box-score totals using standard formulas (hover a tile to see the formula). Tracking-based metrics such as BPM, VORP, on/off and RAPTOR are not available from this data source.
05 / 14 GAMES IN 2026-27
Game log: Regular season
Date
Opp
Result
MIN
FG
FG%
3PT
3P%
FT
FT%
REB
AST
BLK
STL
PF
TO
PTS
Nov 17
@ WSH
W 136-120
32
4-10
40.0
1-4
25.0
3-3
100.0
6
9
0
0
1
1
12
Nov 15
vs BKN
W 129-110
34
6-10
60.0
3-3
100.0
2-2
100.0
1
8
0
2
2
3
17
Nov 14
@ NO
W 142-111
24
3-5
60.0
3-5
60.0
5-5
100.0
2
5
0
0
1
2
14
Nov 12
vs DEN
L 123-118
20
5-7
71.4
3-4
75.0
2-2
100.0
3
3
1
0
1
2
15
Nov 10
@ TOR
W 118-102
17
3-5
60.0
1-2
50.0
0-0
0.0
2
4
0
2
2
3
7
Nov 7
vs OKC
L 128-97
19
2-5
40.0
1-4
25.0
2-2
100.0
1
0
0
1
0
0
7
Nov 5
vs IND
L 107-103
24
3-4
75.0
1-2
50.0
0-0
0.0
6
9
0
1
1
2
7
Nov 3
vs NO
L 135-134 OT
19
4-7
57.1
2-4
50.0
3-3
100.0
1
7
0
0
0
3
13
Nov 1
vs SAC
W 136-105
25
4-9
44.4
2-4
50.0
0-0
0.0
5
13
0
1
1
0
10
Oct 30
@ POR
W 124-103
23
3-6
50.0
1-2
50.0
1-1
100.0
6
8
0
2
4
1
8
Oct 27
@ UTAH
W 110-105
18
3-5
60.0
2-3
66.7
0-0
0.0
5
5
0
0
2
0
8
Oct 26
@ SAC
W 123-112
16
5-9
55.6
3-6
50.0
0-0
0.0
2
1
0
1
0
2
13
Oct 24
@ GS
W 111-108
17
4-7
57.1
3-5
60.0
0-0
0.0
2
1
0
0
1
2
11
Oct 22
vs UTAH
W 123-103
16
1-4
25.0
1-1
100.0
0-0
0.0
3
2
0
1
1
1
3
06 / 2026-27 HOME / AWAY, RESULTS, MONTHS AND OPPONENTS
Splits
split
Split
GP
MIN
FG
FG%
3PT
3P%
FT
FT%
OR
DR
REB
AST
BLK
STL
PF
TO
PTS
All Splits
14
21.6
3.6-6.6
53.8
1.9-3.5
55.1
1.3-1.3
100.0
0.7
2.5
3.2
5.4
0.1
0.8
1.2
1.6
10.4
Home
7
22.4
3.6-6.6
54.3
1.9-3.1
59.1
1.3-1.3
100.0
0.4
2.4
2.9
6.0
0.1
0.9
0.9
1.6
10.3
Road
7
20.9
3.6-6.7
53.2
2.0-3.9
51.9
1.3-1.3
100.0
1.0
2.6
3.6
4.7
0.0
0.7
1.6
1.6
10.4
vs. Division
2
21.5
3.5-6.0
58.3
2.5-4.5
55.6
4.0-4.0
100.0
0.0
1.5
1.5
6.0
0.0
0.0
0.5
2.5
13.5
vs. Conference
10
19.7
3.4-6.4
53.1
2.1-3.8
55.3
1.3-1.3
100.0
0.7
2.3
3.0
4.5
0.1
0.6
1.1
1.3
10.2
3+ Days Rest
1
16.0
1.0-4.0
25.0
1.0-1.0
100.0
0.0-0.0
0.0
1.0
2.0
3.0
2.0
0.0
1.0
1.0
1.0
3.0
Month
Split
GP
MIN
FG
FG%
3PT
3P%
FT
FT%
OR
DR
REB
AST
BLK
STL
PF
TO
PTS
October
6
19.2
3.3-6.7
50.0
2.0-3.5
57.1
0.2-0.2
100.0
1.2
2.7
3.8
5.0
0.0
0.8
1.5
1.0
8.8
November
8
23.5
3.8-6.6
56.6
1.9-3.5
53.6
2.1-2.1
100.0
0.4
2.4
2.8
5.6
0.1
0.8
1.0
2.0
11.5
Pre All-Star
14
21.6
3.6-6.6
53.8
1.9-3.5
55.1
1.3-1.3
100.0
0.7
2.5
3.2
5.4
0.1
0.8
1.2
1.6
10.4
Result
Split
GP
MIN
FG
FG%
3PT
3P%
FT
FT%
OR
DR
REB
AST
BLK
STL
PF
TO
PTS
Wins
10
22.1
3.6-7.0
51.4
2.0-3.5
57.1
1.1-1.1
100.0
0.8
2.6
3.4
5.6
0.0
0.9
1.5
1.5
10.3
Losses
4
20.5
3.5-5.8
60.9
1.8-3.5
50.0
1.8-1.8
100.0
0.5
2.3
2.8
4.8
0.3
0.5
0.5
1.8
10.5
Position
Split
GP
MIN
FG
FG%
3PT
3P%
FT
FT%
OR
DR
REB
AST
BLK
STL
PF
TO
PTS
As Starter
3
30.3
4.7-9.7
48.3
2.0-3.7
54.5
1.7-1.7
100.0
0.3
3.7
4.0
10.0
0.0
1.0
1.3
1.3
13.0
Day
Split
GP
MIN
FG
FG%
3PT
3P%
FT
FT%
OR
DR
REB
AST
BLK
STL
PF
TO
PTS
Monday
4
21.3
3.5-6.8
51.9
1.5-3.3
46.2
1.5-1.5
100.0
0.5
3.0
3.5
6.3
0.0
0.5
1.3
1.8
10.0
Wednesday
3
20.0
3.0-5.0
60.0
1.7-2.3
71.4
0.7-0.7
100.0
1.0
3.0
4.0
4.7
0.3
0.7
1.0
1.7
8.3
Thursday
1
23.0
3.0-6.0
50.0
1.0-2.0
50.0
1.0-1.0
100.0
2.0
4.0
6.0
8.0
0.0
2.0
4.0
1.0
8.0
Friday
3
20.0
3.0-5.7
52.9
2.3-4.7
50.0
2.3-2.3
100.0
0.3
1.3
1.7
2.0
0.0
0.3
0.7
1.3
10.7
Saturday
2
29.5
5.0-9.5
52.6
2.5-3.5
71.4
1.0-1.0
100.0
0.0
3.0
3.0
10.5
0.0
1.5
1.5
1.5
13.5
Sunday
1
16.0
5.0-9.0
55.6
3.0-6.0
50.0
0.0-0.0
0.0
2.0
0.0
2.0
1.0
0.0
1.0
0.0
2.0
13.0
Opponent
Split
GP
MIN
FG
FG%
3PT
3P%
FT
FT%
OR
DR
REB
AST
BLK
STL
PF
TO
PTS
Brooklyn Nets
1
34.0
6.0-10.0
60.0
3.0-3.0
100.0
2.0-2.0
100.0
0.0
1.0
1.0
8.0
0.0
2.0
2.0
3.0
17.0
Denver Nuggets
1
20.0
5.0-7.0
71.4
3.0-4.0
75.0
2.0-2.0
100.0
0.0
3.0
3.0
3.0
1.0
0.0
1.0
2.0
15.0
Golden State Warriors
1
17.0
4.0-7.0
57.1
3.0-5.0
60.0
0.0-0.0
0.0
1.0
1.0
2.0
1.0
0.0
0.0
1.0
2.0
11.0
Indiana Pacers
1
24.0
3.0-4.0
75.0
1.0-2.0
50.0
0.0-0.0
0.0
2.0
4.0
6.0
9.0
0.0
1.0
1.0
2.0
7.0
New Orleans Pelicans
2
21.5
3.5-6.0
58.3
2.5-4.5
55.6
4.0-4.0
100.0
0.0
1.5
1.5
6.0
0.0
0.0
0.5
2.5
13.5
Portland Trail Blazers
1
23.0
3.0-6.0
50.0
1.0-2.0
50.0
1.0-1.0
100.0
2.0
4.0
6.0
8.0
0.0
2.0
4.0
1.0
8.0
Sacramento Kings
2
20.5
4.5-9.0
50.0
2.5-5.0
50.0
0.0-0.0
0.0
1.0
2.5
3.5
7.0
0.0
1.0
0.5
1.0
11.5
Oklahoma City Thunder
1
19.0
2.0-5.0
40.0
1.0-4.0
25.0
2.0-2.0
100.0
0.0
1.0
1.0
0.0
0.0
1.0
0.0
0.0
7.0
Toronto Raptors
1
17.0
3.0-5.0
60.0
1.0-2.0
50.0
0.0-0.0
0.0
0.0
2.0
2.0
4.0
0.0
2.0
2.0
3.0
7.0
Utah Jazz
2
17.0
2.0-4.5
44.4
1.5-2.0
75.0
0.0-0.0
0.0
1.0
3.0
4.0
3.5
0.0
0.5
1.5
0.5
5.5
Washington Wizards
1
32.0
4.0-10.0
40.0
1.0-4.0
25.0
3.0-3.0
100.0
1.0
5.0
6.0
9.0
0.0
0.0
1.0
1.0
12.0
07 / SEASON-BY-SEASON HISTORY
Career statistics
Regular Season Averages
Season
Team
GP
GS
MIN
FG
FG%
3PT
3P%
FT
FT%
OR
DR
REB
AST
BLK
STL
PF
TO
PTS
2024-25
Memphis Grizzlies
25
1
10.1
1.4-3.3
41.5
0.8-2.1
36.5
0.8-0.8
100.0
0.5
0.7
1.2
1.4
0.0
0.4
0.9
0.2
4.2
2025-26
Memphis Grizzlies
72
20
23.8
3.7-7.7
47.3
2.0-4.5
44.9
1.8-1.9
94.0
0.6
2.0
2.5
5.6
0.2
0.7
1.4
1.3
11.1
2026-27
Memphis Grizzlies
14
3
21.6
3.6-6.6
53.8
1.9-3.5
55.1
1.3-1.3
100.0
0.7
2.5
3.2
5.4
0.1
0.8
1.2
1.6
10.4
Career
—
111
24
20.4
3.1-6.6
47.5
1.7-3.8
45.1
1.5-1.5
95.3
0.6
1.8
2.3
4.6
0.1
0.6
1.3
1.1
9.5
Regular Season Totals
Season
Team
FG
FG%
3PT
3P%
FT
FT%
OR
DR
REB
AST
BLK
STL
PF
TO
PTS
2024-25
Memphis Grizzlies
34-82
41.5
19-52
36.5
19-19
100.0
12
18
30
34
1
9
23
6
106
2025-26
Memphis Grizzlies
263-556
47.3
146-325
44.9
126-134
94.0
40
143
183
400
11
52
103
93
798
2026-27
Memphis Grizzlies
50-93
53.8
27-49
55.1
18-18
100.0
10
35
45
75
1
11
17
22
145
Career
—
347-731
47.5
192-426
45.1
163-171
95.3
62
196
258
509
13
72
143
121
1049
Regular Season Misc Totals
Season
Team
DD2
TD3
DQ
EJECT
TECH
FLAG
AST/TO
STL/TO
SC-EFF
SH-EFF
2024-25
Memphis Grizzlies
0
0
0
0
2
0
5.7
1.5
1.293
0.53
2025-26
Memphis Grizzlies
6
0
0
0
2
1
4.3
0.6
1.435
0.60
2026-27
Memphis Grizzlies
1
0
0
0
1
1
3.4
0.5
1.559
0.68
Career
—
7
0
0
0
5
2
4.2
0.6
1.435
0.61
Scoring, rebounding and assist trend
08 / SHOT CHART AND ZONE SHOOTING
Shot profile
Shot-location data is not connected. Add a BALLDONTLIE GOAT-tier NBA API key in NBA Players → Settings to enable shot charts and zone shooting.
LATEST UPDATESpencer finished with 17 points (6-10 FG, 3-3 3Pt, 2-2 FT), one rebound, eight assists and two steals across 34 minutes in Saturday's 129-110 win over the Nets.
With Ty Jerome (hip) ruled out, Spencer drew the start for the second time this season. He played well, ending the night with a season high in points. The 26-year-old also had another efficient performance and has now shot at least 50.0 percent from deep in 12 of his 13 appearances during the 2026-27 campaign. If Jerome can't get back on the floor Monday in Washington, Spencer will presumably stay with the first five, potentially resulting in another above-average showing.




 Adama BalG #72
 Brendan HausenF
 Cameron BoozerF #27
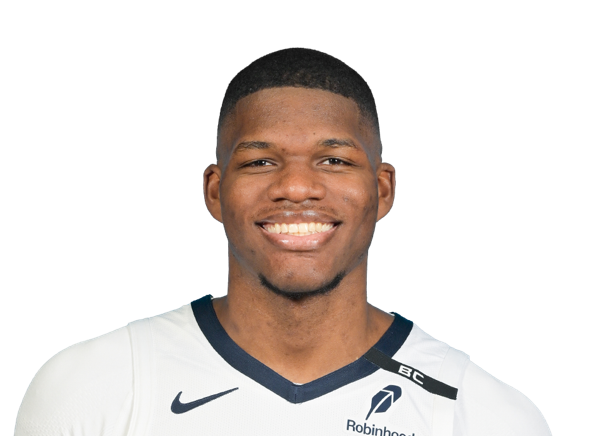 Cedric CowardF #23
 D’Angelo RussellG
 Dariq WhiteheadF
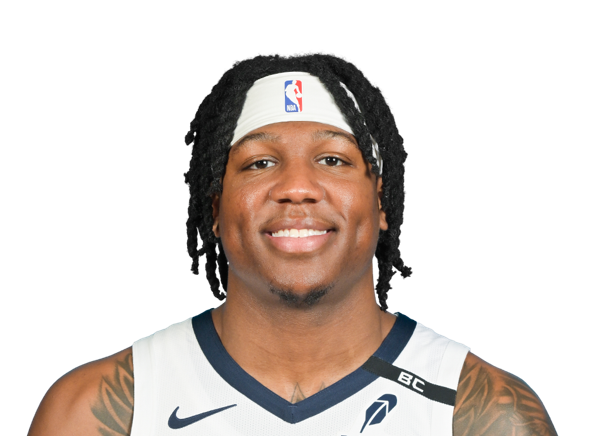 GG JacksonF #45
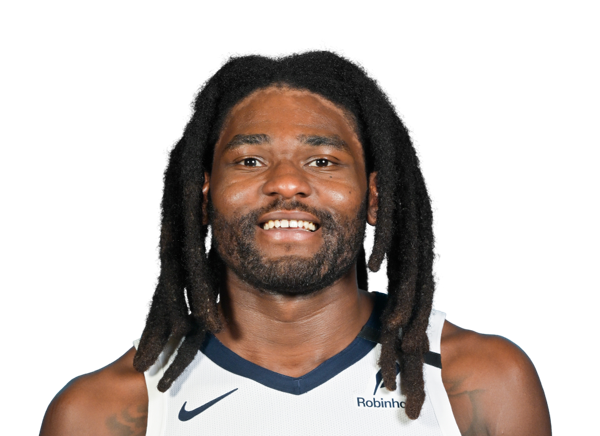 Isaiah StewartC #28
 Jahmai MashackG #21
 Javon SmallG #10
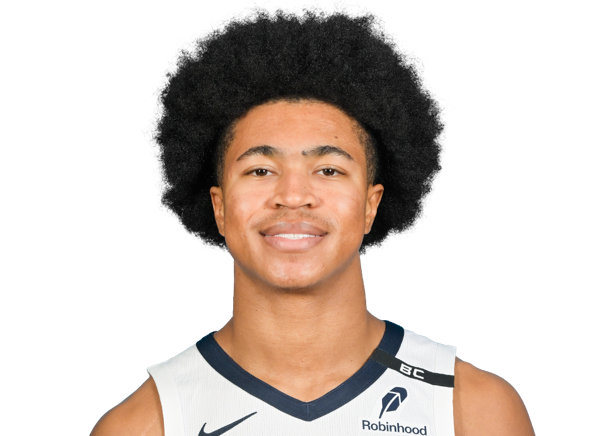 Jaylen WellsF
 Jerami GrantF #3
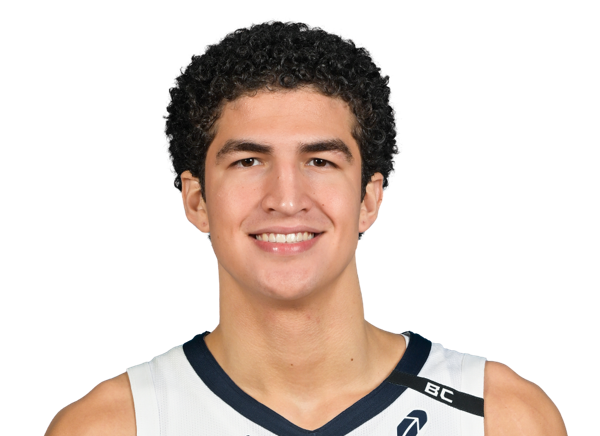 Karim LopezF #35
 Kris MurrayF #17
 Lucas WilliamsonG #55
 Olivier-Maxence ProsperF #18
 Quinten PostC #41
 Richie SaundersG #5
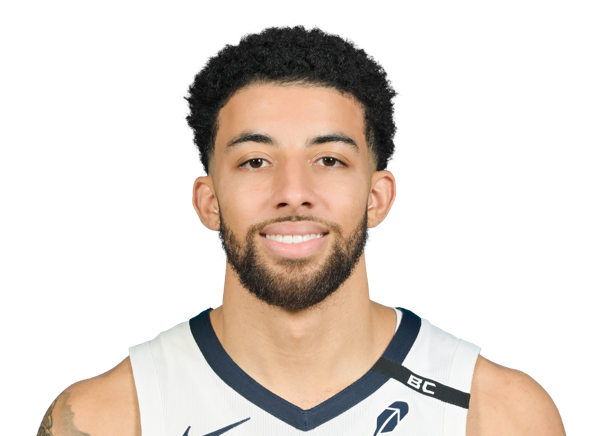 Scotty Pippen Jr.G #1
 Taylor HendricksF #22
 Toby OkaniF #5
 Ty JeromeG #2
 Zach ClevelandF
 Zach EdeyC #14