Click a season to open this player’s full game log, splits and advanced stats for that year; click a team to open its page. A dash means no NBA games were recorded.
03 / EVERY CATEGORY THE PROVIDER REPORTS
Full statistical breakdown
Regular season 2026-27
Defensive
Metric
Total
NBA rank
Blocks
1
Tied-292nd
Defensive Rebounds
9
Tied-341st
Steals
0
Tied-405th
Defensive Rebound Rate
0.0
—
Defensive Rebounds Per Game
1.1
—
Blocks Per Game
0.1
—
Steals Per Game
0.0
—
Defensive Rebounds Per 48
6.8
2,728th
Blocks Per 48
0.8
2,336th
Steals Per 48
0.0
3,240th
General
Metric
Total
NBA rank
Disqualifications
0
Tied-22nd
Flagrant Fouls
0
Tied-24th
Fouls
12
Tied-305th
Player Efficiency Rating
21.07
—
Rebound Rate
0.0
—
Ejections
0
Tied-7th
Technical Fouls
0
Tied-104th
Rebounds
12
—
Value Over Replacement Player
9.8
—
Minutes
64
Tied-6th
Minutes Per Game
8.0
—
Rating
8.6
Tied-226th
Plus-Minus
+35
Tied-1st
Rebounds Per Game
1.5
—
Fouls Per Game
1.5
—
Flagrant Fouls Per Game
0.0
—
Technical Fouls Per Game
0.0
—
Ejections Per Game
0.0
—
Disqualifications Per Game
0.0
—
Assist To Turnover Ratio
4.0
—
Steal To Foul Ratio
0.0
—
Block To Foul Ratio
0.1
—
Team Rebounds Per Game
0.0
—
Rebounds
12
—
Total Technical Fouls
0
—
Assist To Turnover Ratio
0.0
—
Steal To Turnover Ratio
0.0
—
Rebounds Per 48 Minutes
9.0
—
Fouls Per 48 Minutes
9.0
2,440th
Flagrant Fouls Per 48 Minutes
0.0
192nd
Technical Fouls Per 48 Minutes
0.0
832nd
Ejections Per 48 Minutes
0.0
56th
Disqualifications Per 48 Minutes
0.0
176th
R/40
7.5
—
Games Played
8
8th
Games Started
0
Tied-258th
Double Double
0
Tied-121st
Triple Double
0
Tied-13th
Offensive
Metric
Total
NBA rank
Assists
4
Tied-354th
Effective Field Goal Percentage
68.8
—
Field Goals
15/24
—
Field Goals Attempted
24
Tied-332nd
Field Goals Made
15
Tied-303rd
Field Goal Percentage
62.5
—
Free Throws
8/10
—
Free Throw Percentage
80.0
—
Free Throws Attempted
10
Tied-260th
Free Throws Made
8
Tied-249th
Offensive Rebounds
3
Tied-333rd
Points
41
Tied-305th
Turnovers
1
Tied-408th
3-Point Field Goal Percentage
50.0
—
3-Point Field Goals Attempted
6
Tied-336th
3-Point Field Goals Made
3
Tied-298th
True Shooting Percentage
72.2
—
Total Turnovers
1
—
Assist Ratio
12.0
—
Points in the Paint
0
Tied-1st
Offensive Rebound Rate
0.0
—
Turnover Ratio
3.0
—
Brick Index
0.00
—
Usage Rate
0.0
—
Average Field Goals Made
1.9
—
Average Field Goals Attempted
3.0
—
Average 3-Point Field Goals Made
0.4
—
Average 3-Point Field Goals Attempted
0.8
—
Average Free Throws Made
1.0
—
Average Free Throws Attempted
1.3
—
Points Per Game
5.1
—
Offensive Rebounds Per Game
0.4
—
Assists Per Game
0.5
—
Turnovers Per Game
0.1
—
Offensive Rebound Percentage
0.3
—
Estimated Possessions
26.0
—
Estimated Possessions Per Game
3.3
—
Points Per Estimated Possession
1.6
—
Team Turnovers Per Game
0.0
—
Total Turnovers Per Game
0.1
—
3-Point Field Goal Percentage
50.0
—
2-Point Field Goals Made
12.0
Tied-5th
2-Point Field Goals Attempted
18.0
4th
2-Point Field Goals Made per Game
1.5
—
2-Point Field Goals Attempted per Game
2.3
—
2-Point Field Goal Percentage
66.7
Tied-1st
Shooting Efficiency
0.69
—
Scoring Efficiency
1.708
—
Fieldgoals Made Per 48
11.3
2,424th
Fieldgoals Attempted Per 48
18.0
2,656th
3-Point Fieldgoals Made Per 48
2.3
2,384th
3-Point Fieldgoals Attempted Per 48
4.5
2,688th
Freethrows Made Per 48
6.0
1,992nd
Freethrows Attempted Per 48
7.5
2,080th
Points Scored Per 48
30.8
2,440th
Offensive Rebounds Per 48
2.3
2,664th
Assists Per 48
3.0
2,832nd
Turnovers
0.8
3,264th
P/40
25.6
—
A/40
2.5
—
04 / EFFICIENCY, SHOOTING PROFILE, PER-36
Advanced metrics
True shooting %71.4%
Effective FG %70.0%
2-point FG %68.2%
3-point attempt rate26.7%
Free throw rate43.3%
Points per shot attempt1.70
% of points from 3s23.5%
Assist-to-turnover5.00
Points per 36 min23.0
Rebounds per 36 min6.8
Assists per 36 min2.3
Steals per 36 min0.00
Blocks per 36 min0.45
Turnovers per 36 min0.45
Stocks (STL + BLK) per game0.10
Pts + Reb + Ast per game7.1
Efficiency (EFF) per game5.7
Game Score per game (Hollinger)4.0
Minutes per game8.0
Calculated by BallersCulture from the supplied 2026-27 box-score totals using standard formulas (hover a tile to see the formula). Tracking-based metrics such as BPM, VORP, on/off and RAPTOR are not available from this data source.
05 / 8 GAMES IN 2026-27
Game log: Regular season
Date
Opp
Result
MIN
FG
FG%
3PT
3P%
FT
FT%
REB
AST
BLK
STL
PF
TO
PTS
Nov 17
@ WSH
W 136-120
16
4-4
100.0
1-1
100.0
3-3
100.0
0
1
0
0
3
0
12
Nov 15
vs BKN
W 129-110
20
4-7
57.1
2-2
100.0
1-1
100.0
4
0
1
0
5
0
11
Nov 14
@ NO
W 142-111
2
1-1
100.0
0-0
0.0
4-6
66.7
1
0
0
0
1
0
6
Nov 10
@ TOR
W 118-102
1
0-0
0.0
0-0
0.0
0-0
0.0
0
0
0
0
0
0
0
Nov 7
vs OKC
L 128-97
11
1-4
25.0
0-2
0.0
0-0
0.0
3
1
0
0
3
1
2
Nov 5
vs IND
L 107-103
7
2-3
66.7
0-1
0.0
0-0
0.0
2
1
0
0
0
0
4
Nov 1
vs SAC
W 136-105
4
1-1
100.0
0-0
0.0
0-0
0.0
1
1
0
0
0
0
2
Oct 30
@ POR
W 124-103
3
2-4
50.0
0-0
0.0
0-0
0.0
1
0
0
0
0
0
4
06 / 2026-27 HOME / AWAY, RESULTS, MONTHS AND OPPONENTS
Splits
split
Split
GP
MIN
FG
FG%
3PT
3P%
FT
FT%
OR
DR
REB
AST
BLK
STL
PF
TO
PTS
All Splits
8
8.0
1.9-3.0
62.5
0.4-0.8
50.0
1.0-1.3
80.0
0.4
1.1
1.5
0.5
0.1
0.0
1.5
0.1
5.1
Home
4
10.5
2.0-3.8
53.3
0.5-1.3
40.0
0.3-0.3
100.0
0.8
1.8
2.5
0.8
0.3
0.0
2.0
0.3
4.8
Road
4
5.5
1.8-2.3
77.8
0.3-0.3
100.0
1.8-2.3
77.8
0.0
0.5
0.5
0.3
0.0
0.0
1.0
0.0
5.5
vs. Division
1
2.0
1.0-1.0
100.0
0.0-0.0
0.0
4.0-6.0
66.7
0.0
1.0
1.0
0.0
0.0
0.0
1.0
0.0
6.0
vs. Conference
4
5.0
1.3-2.5
50.0
0.0-0.5
0.0
1.0-1.5
66.7
0.0
1.5
1.5
0.5
0.0
0.0
1.0
0.3
3.5
3+ Days Rest
3
4.0
1.7-2.7
62.5
0.0-0.3
0.0
1.3-2.0
66.7
0.3
1.0
1.3
0.3
0.0
0.0
0.3
0.0
4.7
Month
Split
GP
MIN
FG
FG%
3PT
3P%
FT
FT%
OR
DR
REB
AST
BLK
STL
PF
TO
PTS
October
2
3.5
1.5-2.5
60.0
0.0-0.0
0.0
0.0-0.0
0.0
0.0
1.0
1.0
0.5
0.0
0.0
0.0
0.0
3.0
November
6
9.5
2.0-3.2
63.2
0.5-1.0
50.0
1.3-1.7
80.0
0.5
1.2
1.7
0.5
0.2
0.0
2.0
0.2
5.8
Pre All-Star
8
8.0
1.9-3.0
62.5
0.4-0.8
50.0
1.0-1.3
80.0
0.4
1.1
1.5
0.5
0.1
0.0
1.5
0.1
5.1
Result
Split
GP
MIN
FG
FG%
3PT
3P%
FT
FT%
OR
DR
REB
AST
BLK
STL
PF
TO
PTS
Wins
6
7.7
2.0-2.8
70.6
0.5-0.5
100.0
1.3-1.7
80.0
0.3
0.8
1.2
0.3
0.2
0.0
1.5
0.0
5.8
Losses
2
9.0
1.5-3.5
42.9
0.0-1.5
0.0
0.0-0.0
0.0
0.5
2.0
2.5
1.0
0.0
0.0
1.5
0.5
3.0
Day
Split
GP
MIN
FG
FG%
3PT
3P%
FT
FT%
OR
DR
REB
AST
BLK
STL
PF
TO
PTS
Monday
2
8.5
2.0-2.0
100.0
0.5-0.5
100.0
1.5-1.5
100.0
0.0
0.0
0.0
0.5
0.0
0.0
1.5
0.0
6.0
Wednesday
1
7.0
2.0-3.0
66.7
0.0-1.0
0.0
0.0-0.0
0.0
1.0
1.0
2.0
1.0
0.0
0.0
0.0
0.0
4.0
Thursday
1
3.0
2.0-4.0
50.0
0.0-0.0
0.0
0.0-0.0
0.0
0.0
1.0
1.0
0.0
0.0
0.0
0.0
0.0
4.0
Friday
2
6.5
1.0-2.5
40.0
0.0-1.0
0.0
2.0-3.0
66.7
0.0
2.0
2.0
0.5
0.0
0.0
2.0
0.5
4.0
Saturday
2
12.0
2.5-4.0
62.5
1.0-1.0
100.0
0.5-0.5
100.0
1.0
1.5
2.5
0.5
0.5
0.0
2.5
0.0
6.5
Opponent
Split
GP
MIN
FG
FG%
3PT
3P%
FT
FT%
OR
DR
REB
AST
BLK
STL
PF
TO
PTS
Brooklyn Nets
1
20.0
4.0-7.0
57.1
2.0-2.0
100.0
1.0-1.0
100.0
2.0
2.0
4.0
0.0
1.0
0.0
5.0
0.0
11.0
Indiana Pacers
1
7.0
2.0-3.0
66.7
0.0-1.0
0.0
0.0-0.0
0.0
1.0
1.0
2.0
1.0
0.0
0.0
0.0
0.0
4.0
New Orleans Pelicans
1
2.0
1.0-1.0
100.0
0.0-0.0
0.0
4.0-6.0
66.7
0.0
1.0
1.0
0.0
0.0
0.0
1.0
0.0
6.0
Portland Trail Blazers
1
3.0
2.0-4.0
50.0
0.0-0.0
0.0
0.0-0.0
0.0
0.0
1.0
1.0
0.0
0.0
0.0
0.0
0.0
4.0
Sacramento Kings
1
4.0
1.0-1.0
100.0
0.0-0.0
0.0
0.0-0.0
0.0
0.0
1.0
1.0
1.0
0.0
0.0
0.0
0.0
2.0
Oklahoma City Thunder
1
11.0
1.0-4.0
25.0
0.0-2.0
0.0
0.0-0.0
0.0
0.0
3.0
3.0
1.0
0.0
0.0
3.0
1.0
2.0
Toronto Raptors
1
1.0
0.0-0.0
0.0
0.0-0.0
0.0
0.0-0.0
0.0
0.0
0.0
0.0
0.0
0.0
0.0
0.0
0.0
0.0
Washington Wizards
1
16.0
4.0-4.0
100.0
1.0-1.0
100.0
3.0-3.0
100.0
0.0
0.0
0.0
1.0
0.0
0.0
3.0
0.0
12.0
07 / SEASON-BY-SEASON HISTORY
Career statistics
Regular Season Averages
Season
Team
GP
GS
MIN
FG
FG%
3PT
3P%
FT
FT%
OR
DR
REB
AST
BLK
STL
PF
TO
PTS
2023-24
Dallas Mavericks
40
1
8.4
1.0-2.6
38.5
0.3-1.1
28.9
0.7-1.0
68.3
0.6
1.4
2.0
0.6
0.1
0.2
0.5
0.2
3.0
2024-25
Dallas Mavericks
52
4
11.2
1.3-3.3
40.2
0.2-1.0
23.5
0.9-1.5
64.5
0.8
1.6
2.4
0.8
0.1
0.5
0.5
0.3
3.9
2025-26
Memphis Grizzlies
53
24
18.6
3.6-6.6
54.9
1.1-2.8
40.5
1.6-2.2
75.4
1.1
2.4
3.5
1.0
0.2
0.8
1.6
0.9
10.0
2026-27
Memphis Grizzlies
8
0
8.0
1.9-3.0
62.5
0.4-0.8
50.0
1.0-1.3
80.0
0.4
1.1
1.5
0.5
0.1
0.0
1.5
0.1
5.1
Career
—
153
29
12.9
2.1-4.3
48.6
0.6-1.6
35.2
1.1-1.6
71.0
0.9
1.8
2.6
0.8
0.2
0.5
0.9
0.5
5.8
Regular Season Totals
Season
Team
FG
FG%
3PT
3P%
FT
FT%
OR
DR
REB
AST
BLK
STL
PF
TO
PTS
2023-24
Dallas Mavericks
40-104
38.5
13-45
28.9
28-41
68.3
25
54
79
22
4
7
20
8
121
2024-25
Dallas Mavericks
70-174
40.2
12-51
23.5
49-76
64.5
44
82
126
40
6
26
28
14
201
2025-26
Memphis Grizzlies
192-350
54.9
60-148
40.5
86-114
75.4
59
128
187
51
13
40
83
47
530
2026-27
Memphis Grizzlies
15-24
62.5
3-6
50.0
8-10
80.0
3
9
12
4
1
0
12
1
41
Career
—
317-652
48.6
88-250
35.2
171-241
71.0
131
273
404
117
24
73
143
70
893
Regular Season Misc Totals
Season
Team
DD2
TD3
DQ
EJECT
TECH
FLAG
AST/TO
STL/TO
SC-EFF
SH-EFF
2023-24
Dallas Mavericks
0
0
0
0
0
0
2.8
0.9
1.163
0.45
2024-25
Dallas Mavericks
0
0
0
0
0
0
2.9
1.9
1.155
0.44
2025-26
Memphis Grizzlies
1
0
0
0
0
0
1.1
0.9
1.514
0.63
2026-27
Memphis Grizzlies
0
0
0
0
0
0
4.0
0.0
1.708
0.69
Career
—
1
0
0
0
0
0
1.7
1.0
1.370
0.55
Scoring, rebounding and assist trend
08 / SHOT CHART AND ZONE SHOOTING
Shot profile
Shot-location data is not connected. Add a BALLDONTLIE GOAT-tier NBA API key in NBA Players → Settings to enable shot charts and zone shooting.
LATEST UPDATEProsper registered no counting stats in one minute during Monday's 118-102 victory over the Raptors.
Prosper cracked the rotation for just the fifth time this season, albeit for a brief appearance during garbage time. He has now played a total of 33 minutes, scoring 12 points. Simple math tells you that he has no value outside of the deepest leagues.




 Adama BalG #72
 Brendan HausenF
 Cam SpencerG #24
 Cameron BoozerF #27
 Cedric CowardF #23
 D’Angelo RussellG
 Dariq WhiteheadF
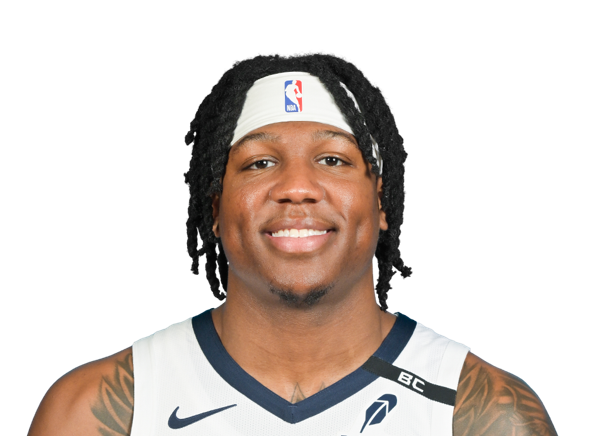 GG JacksonF #45
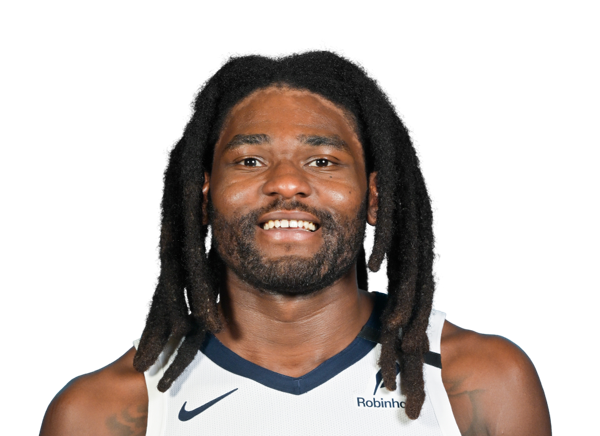 Isaiah StewartC #28
 Jahmai MashackG #21
 Javon SmallG #10
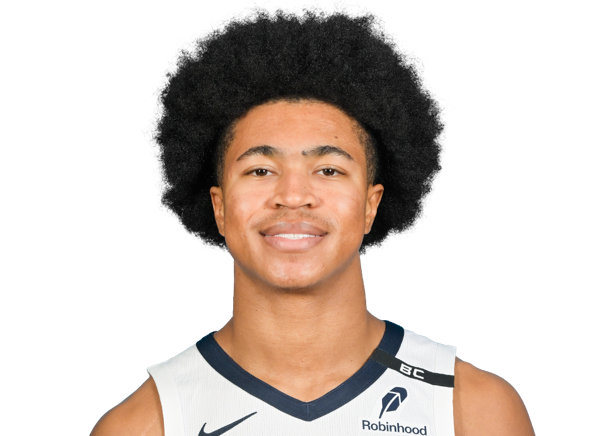 Jaylen WellsF
 Jerami GrantF #3
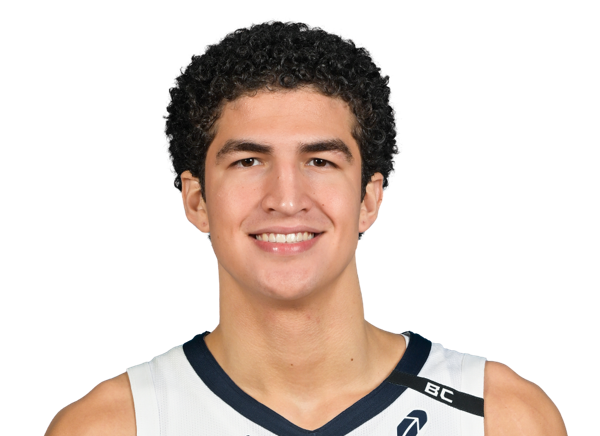 Karim LopezF #35
 Kris MurrayF #17
 Lucas WilliamsonG #55
 Quinten PostC #41
 Richie SaundersG #5
 Scotty Pippen Jr.G #1
 Taylor HendricksF #22
 Toby OkaniF #5
 Ty JeromeG #2
 Zach ClevelandF
 Zach EdeyC #14