Click a season to open this player’s full game log, splits and advanced stats for that year; click a team to open its page. A dash means no NBA games were recorded.
03 / EFFICIENCY, SHOOTING PROFILE, PER-36
Advanced metrics
True shooting %51.1%
Effective FG %48.3%
2-point FG %36.4%
3-point attempt rate44.1%
Free throw rate25.4%
Points per shot attempt1.14
% of points from 3s49.3%
Assist-to-turnover0.91
Points per 36 min16.1
Rebounds per 36 min7.2
Assists per 36 min2.4
Steals per 36 min0.72
Blocks per 36 min0.96
Turnovers per 36 min2.64
Stocks (STL + BLK) per game0.70
Pts + Reb + Ast per game10.7
Efficiency (EFF) per game6.3
Game Score per game (Hollinger)4.1
Minutes per game15.0
Calculated by BallersCulture from the supplied 2026-27 box-score totals using standard formulas (hover a tile to see the formula). Tracking-based metrics such as BPM, VORP, on/off and RAPTOR are not available from this data source.
04 / 12 GAMES IN 2026-27
Game log: Regular season
Date
Opp
Result
MIN
FG
FG%
3PT
3P%
FT
FT%
REB
AST
BLK
STL
PF
TO
PTS
Nov 15
vs BKN
W 129-110
3
1-1
100.0
1-1
100.0
0-0
0.0
0
0
0
0
0
0
3
Nov 14
@ NO
W 142-111
22
4-11
36.4
3-5
60.0
3-4
75.0
6
4
1
2
3
1
14
Nov 12
vs DEN
L 123-118
13
1-3
33.3
0-1
0.0
0-1
0.0
1
0
1
1
2
0
2
Nov 10
@ TOR
W 118-102
17
0-3
0.0
0-1
0.0
2-2
100.0
1
0
1
0
1
0
2
Nov 5
vs IND
L 107-103
7
0-1
0.0
0-1
0.0
1-2
50.0
2
0
0
0
1
1
1
Nov 3
vs NO
L 135-134 OT
16
3-8
37.5
0-4
0.0
0-0
0.0
0
1
0
0
0
2
6
Nov 1
vs SAC
W 136-105
21
7-10
70.0
5-5
100.0
2-2
100.0
3
2
0
0
4
1
21
Oct 30
@ POR
W 124-103
21
4-12
33.3
2-4
50.0
2-2
100.0
7
2
0
0
0
0
12
Oct 27
@ UTAH
W 110-105
16
2-7
28.6
0-3
0.0
0-0
0.0
1
2
0
1
2
1
4
Oct 26
@ SAC
W 123-112
10
0-1
0.0
0-1
0.0
1-2
50.0
3
0
0
0
0
2
1
Oct 24
@ GS
W 111-108
15
1-6
16.7
0-3
0.0
0-1
0.0
4
1
0
0
4
1
2
Oct 22
vs UTAH
W 123-103
19
4-8
50.0
2-2
100.0
2-2
100.0
8
0
2
0
2
4
12
05 / 2026-27 HOME / AWAY, RESULTS, MONTHS AND OPPONENTS
Splits
split
Split
GP
MIN
FG
FG%
3PT
3P%
FT
FT%
OR
DR
REB
AST
BLK
STL
PF
TO
PTS
All Splits
12
15.0
2.3-5.9
38.0
1.1-2.6
41.9
1.1-1.5
72.2
0.7
2.3
3.0
1.0
0.4
0.3
1.6
1.1
6.7
Home
6
13.2
2.7-5.2
51.6
1.3-2.3
57.1
0.8-1.2
71.4
0.3
2.0
2.3
0.5
0.5
0.2
1.5
1.3
7.5
Road
6
16.8
1.8-6.7
27.5
0.8-2.8
29.4
1.3-1.8
72.7
1.0
2.7
3.7
1.5
0.3
0.5
1.7
0.8
5.8
vs. Division
2
19.5
3.5-9.5
36.8
1.5-4.5
33.3
1.5-2.0
75.0
1.0
2.0
3.0
2.5
0.5
1.0
1.5
1.5
10.0
vs. Conference
9
17.0
2.9-7.3
39.4
1.3-3.1
42.9
1.1-1.6
71.4
0.9
2.8
3.7
1.3
0.4
0.4
1.9
1.3
8.2
3+ Days Rest
2
18.0
2.0-5.5
36.4
1.0-1.5
66.7
2.0-2.0
100.0
1.0
3.5
4.5
0.0
1.5
0.0
1.5
2.0
7.0
Month
Split
GP
MIN
FG
FG%
3PT
3P%
FT
FT%
OR
DR
REB
AST
BLK
STL
PF
TO
PTS
October
6
16.8
3.0-7.3
40.9
1.5-3.0
50.0
1.2-1.5
77.8
1.0
3.3
4.3
1.2
0.3
0.2
2.0
1.5
8.7
November
6
13.2
1.5-4.5
33.3
0.7-2.2
30.8
1.0-1.5
66.7
0.3
1.3
1.7
0.8
0.5
0.5
1.2
0.7
4.7
Pre All-Star
12
15.0
2.3-5.9
38.0
1.1-2.6
41.9
1.1-1.5
72.2
0.7
2.3
3.0
1.0
0.4
0.3
1.6
1.1
6.7
Result
Split
GP
MIN
FG
FG%
3PT
3P%
FT
FT%
OR
DR
REB
AST
BLK
STL
PF
TO
PTS
Wins
9
16.0
2.6-6.6
39.0
1.4-2.8
52.0
1.3-1.7
80.0
0.9
2.8
3.7
1.2
0.4
0.3
1.8
1.1
7.9
Losses
3
12.0
1.3-4.0
33.3
0.0-2.0
0.0
0.3-1.0
33.3
0.0
1.0
1.0
0.3
0.3
0.3
1.0
1.0
3.0
Position
Split
GP
MIN
FG
FG%
3PT
3P%
FT
FT%
OR
DR
REB
AST
BLK
STL
PF
TO
PTS
As Starter
1
15.0
1.0-6.0
16.7
0.0-3.0
0.0
0.0-1.0
0.0
1.0
3.0
4.0
1.0
0.0
0.0
4.0
1.0
2.0
Day
Split
GP
MIN
FG
FG%
3PT
3P%
FT
FT%
OR
DR
REB
AST
BLK
STL
PF
TO
PTS
Monday
3
16.3
1.7-6.0
27.8
0.0-2.7
0.0
0.7-0.7
100.0
0.0
0.7
0.7
1.0
0.3
0.3
1.0
1.0
4.0
Wednesday
3
13.0
1.7-4.0
41.7
0.7-1.3
50.0
1.0-1.7
60.0
0.7
3.0
3.7
0.0
1.0
0.3
1.7
1.7
5.0
Thursday
1
21.0
4.0-12.0
33.3
2.0-4.0
50.0
2.0-2.0
100.0
2.0
5.0
7.0
2.0
0.0
0.0
0.0
0.0
12.0
Friday
2
19.0
2.5-8.5
29.4
1.5-4.0
37.5
1.5-2.5
60.0
1.5
3.5
5.0
2.5
0.5
1.0
3.5
1.0
8.0
Saturday
2
12.0
4.0-5.5
72.7
3.0-3.0
100.0
1.0-1.0
100.0
0.0
1.5
1.5
1.0
0.0
0.0
2.0
0.5
12.0
Sunday
1
10.0
0.0-1.0
0.0
0.0-1.0
0.0
1.0-2.0
50.0
1.0
2.0
3.0
0.0
0.0
0.0
0.0
2.0
1.0
Opponent
Split
GP
MIN
FG
FG%
3PT
3P%
FT
FT%
OR
DR
REB
AST
BLK
STL
PF
TO
PTS
Brooklyn Nets
1
3.0
1.0-1.0
100.0
1.0-1.0
100.0
0.0-0.0
0.0
0.0
0.0
0.0
0.0
0.0
0.0
0.0
0.0
3.0
Denver Nuggets
1
13.0
1.0-3.0
33.3
0.0-1.0
0.0
0.0-1.0
0.0
0.0
1.0
1.0
0.0
1.0
1.0
2.0
0.0
2.0
Golden State Warriors
1
15.0
1.0-6.0
16.7
0.0-3.0
0.0
0.0-1.0
0.0
1.0
3.0
4.0
1.0
0.0
0.0
4.0
1.0
2.0
Indiana Pacers
1
7.0
0.0-1.0
0.0
0.0-1.0
0.0
1.0-2.0
50.0
0.0
2.0
2.0
0.0
0.0
0.0
1.0
1.0
1.0
New Orleans Pelicans
2
19.5
3.5-9.5
36.8
1.5-4.5
33.3
1.5-2.0
75.0
1.0
2.0
3.0
2.5
0.5
1.0
1.5
1.5
10.0
Portland Trail Blazers
1
21.0
4.0-12.0
33.3
2.0-4.0
50.0
2.0-2.0
100.0
2.0
5.0
7.0
2.0
0.0
0.0
0.0
0.0
12.0
Sacramento Kings
2
15.5
3.5-5.5
63.6
2.5-3.0
83.3
1.5-2.0
75.0
0.5
2.5
3.0
1.0
0.0
0.0
2.0
1.5
11.0
Toronto Raptors
1
17.0
0.0-3.0
0.0
0.0-1.0
0.0
2.0-2.0
100.0
0.0
1.0
1.0
0.0
1.0
0.0
1.0
0.0
2.0
Utah Jazz
2
17.0
3.0-7.5
40.0
1.0-2.5
40.0
1.0-1.0
100.0
1.0
3.5
4.5
1.0
1.0
0.5
2.0
2.5
8.0
06 / SEASON-BY-SEASON HISTORY
Career statistics
Regular Season Averages
Season
Team
GP
GS
MIN
FG
FG%
3PT
3P%
FT
FT%
OR
DR
REB
AST
BLK
STL
PF
TO
PTS
2023-24
Memphis Grizzlies
48
18
25.7
5.0-11.7
42.8
2.1-6.0
35.7
2.4-3.2
75.2
1.1
3.0
4.1
1.2
0.5
0.6
1.3
1.4
14.6
2024-25
Memphis Grizzlies
29
3
15.8
2.6-6.9
37.2
1.1-3.3
33.7
1.0-1.4
72.5
0.9
2.2
3.2
1.0
0.2
0.4
1.0
1.1
7.2
2025-26
Memphis Grizzlies
55
28
21.4
4.6-9.3
49.6
1.2-3.5
33.2
2.0-2.7
74.2
0.9
3.4
4.3
1.5
0.8
0.6
1.4
1.5
12.5
2026-27
Memphis Grizzlies
12
1
15.0
2.3-5.9
38.0
1.1-2.6
41.9
1.1-1.5
72.2
0.7
2.3
3.0
1.0
0.4
0.3
1.6
1.1
6.7
Career
—
144
50
21.2
4.1-9.4
44.3
1.5-4.2
34.9
1.9-2.5
74.3
1.0
2.9
3.9
1.3
0.5
0.5
1.3
1.3
11.6
Regular Season Totals
Season
Team
FG
FG%
3PT
3P%
FT
FT%
OR
DR
REB
AST
BLK
STL
PF
TO
PTS
2023-24
Memphis Grizzlies
241-563
42.8
102-286
35.7
115-153
75.2
53
143
196
59
24
28
64
65
699
2024-25
Memphis Grizzlies
74-199
37.2
32-95
33.7
29-40
72.5
27
65
92
29
5
12
30
31
209
2025-26
Memphis Grizzlies
255-514
49.6
64-193
33.2
112-151
74.2
49
186
235
81
44
31
75
85
686
2026-27
Memphis Grizzlies
27-71
38.0
13-31
41.9
13-18
72.2
8
28
36
12
5
4
19
13
80
Career
—
597-1347
44.3
211-605
34.9
269-362
74.3
137
422
559
181
78
75
188
194
1674
Regular Season Misc Totals
Season
Team
DD2
TD3
DQ
EJECT
TECH
FLAG
AST/TO
STL/TO
SC-EFF
SH-EFF
2023-24
Memphis Grizzlies
2
0
0
0
1
0
0.9
0.4
1.242
0.52
2024-25
Memphis Grizzlies
0
0
0
0
0
0
0.9
0.4
1.050
0.45
2025-26
Memphis Grizzlies
1
0
0
0
1
0
1.0
0.4
1.335
0.56
2026-27
Memphis Grizzlies
0
0
0
0
0
0
0.9
0.3
1.127
0.47
Career
—
3
0
0
0
2
0
0.9
0.4
1.243
0.52
Scoring, rebounding and assist trend
07 / SHOT CHART AND ZONE SHOOTING
Shot profile
Shot-location data is not connected. Add a BALLDONTLIE GOAT-tier NBA API key in NBA Players → Settings to enable shot charts and zone shooting.
LATEST UPDATEJackson will undergo surgery to repair the broken fifth metatarsal in his left foot and is set to miss significant time.
The Grizzlies will release a timeline for Jackson's return to basketball activities after he undergoes surgery, though he's facing a lengthy absence. With the 22-year-old forward on the shelf, Taylor Hendricks and Jerami Grant are candidates for increased playing time.


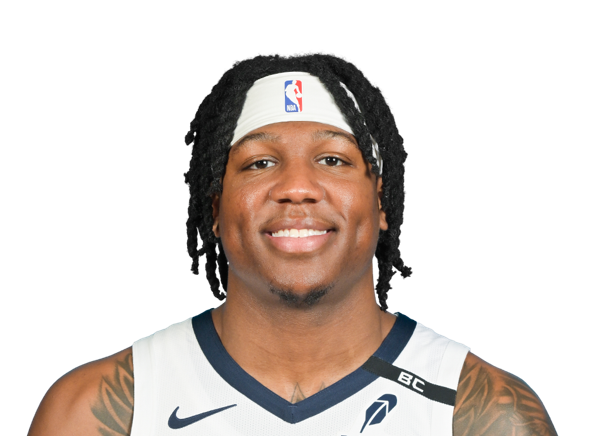

 Adama BalG #72
 Brendan HausenF
 Cam SpencerG #24
 Cameron BoozerF #27
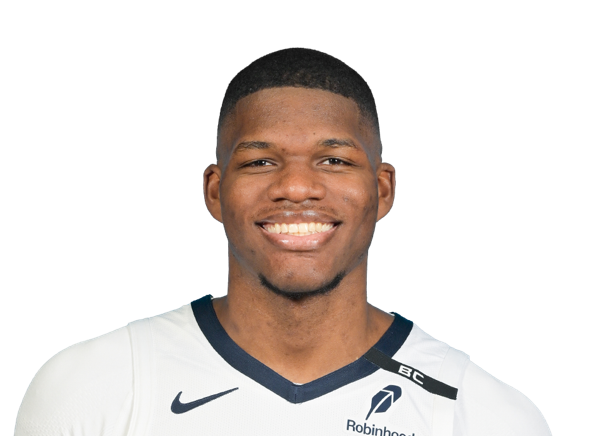 Cedric CowardF #23
 D’Angelo RussellG
 Dariq WhiteheadF
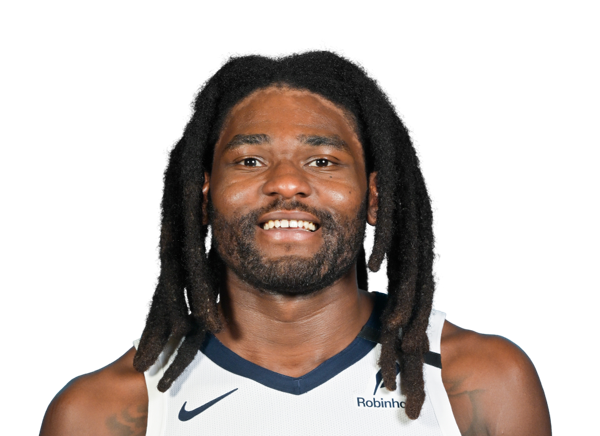 Isaiah StewartC #28
 Jahmai MashackG #21
 Javon SmallG #10
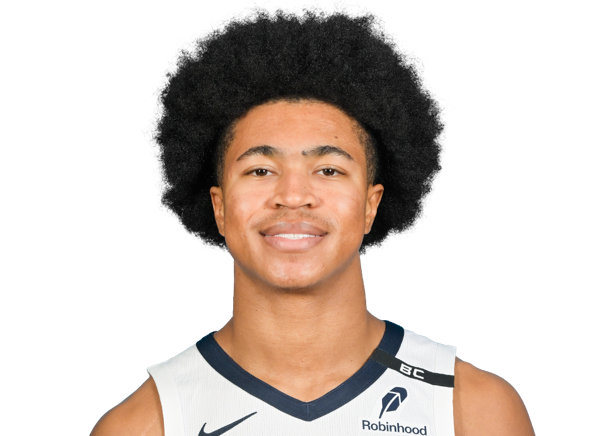 Jaylen WellsF
 Jerami GrantF #3
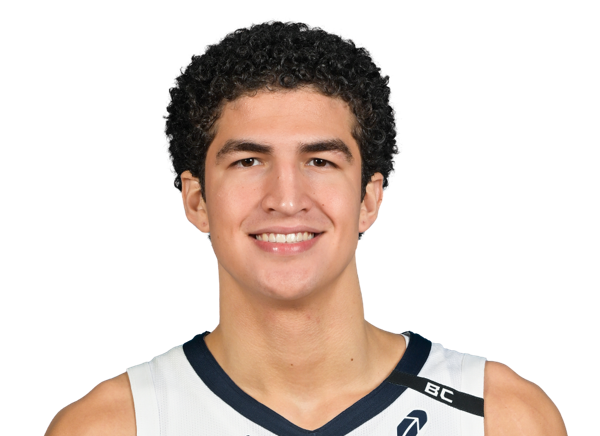 Karim LopezF #35
 Kris MurrayF #17
 Lucas WilliamsonG #55
 Olivier-Maxence ProsperF #18
 Quinten PostC #41
 Richie SaundersG #5
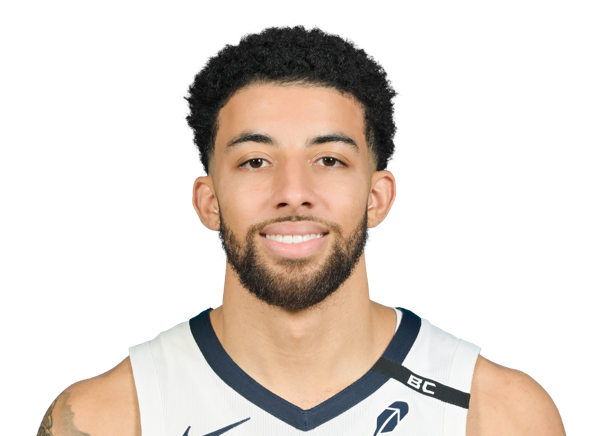 Scotty Pippen Jr.G #1
 Taylor HendricksF #22
 Toby OkaniF #5
 Ty JeromeG #2
 Zach ClevelandF
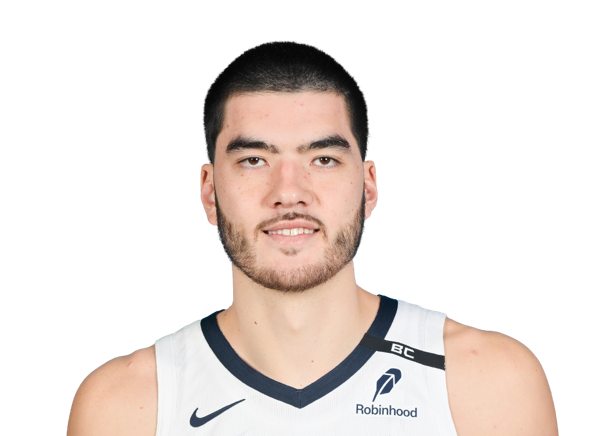 Zach EdeyC #14