Click a season to open this player’s full game log, splits and advanced stats for that year; click a team to open its page. A dash means no NBA games were recorded.
03 / EVERY CATEGORY THE PROVIDER REPORTS
Full statistical breakdown
Regular season 2026-27
Defensive
Metric
Total
NBA rank
Blocks
3
Tied-191st
Defensive Rebounds
32
Tied-161st
Steals
2
Tied-316th
Defensive Rebound Rate
0.0
—
Defensive Rebounds Per Game
4.6
—
Blocks Per Game
0.4
—
Steals Per Game
0.3
—
Defensive Rebounds Per 48
9.0
1,932nd
Blocks Per 48
0.8
2,292nd
Steals Per 48
0.6
3,792nd
General
Metric
Total
NBA rank
Disqualifications
0
Tied-21st
Flagrant Fouls
0
Tied-22nd
Fouls
17
Tied-250th
Player Efficiency Rating
13.65
—
Rebound Rate
0.0
—
Ejections
0
Tied-7th
Technical Fouls
0
Tied-101st
Rebounds
43
—
Value Over Replacement Player
7.2
—
Minutes
170
Tied-4th
Minutes Per Game
24.3
—
Rating
20.0
Tied-197th
Plus-Minus
+3
Tied-1st
Rebounds Per Game
6.1
—
Fouls Per Game
2.4
—
Flagrant Fouls Per Game
0.0
—
Technical Fouls Per Game
0.0
—
Ejections Per Game
0.0
—
Disqualifications Per Game
0.0
—
Assist To Turnover Ratio
1.4
—
Steal To Foul Ratio
0.1
—
Block To Foul Ratio
0.2
—
Team Rebounds Per Game
0.0
—
Rebounds
43
—
Total Technical Fouls
0
—
Assist To Turnover Ratio
0.0
—
Steal To Turnover Ratio
0.2
—
Rebounds Per 48 Minutes
12.1
—
Fouls Per 48 Minutes
4.8
3,000th
Flagrant Fouls Per 48 Minutes
0.0
264th
Technical Fouls Per 48 Minutes
0.0
1,212th
Ejections Per 48 Minutes
0.0
84th
Disqualifications Per 48 Minutes
0.0
252nd
R/40
10.1
—
Games Played
7
7th
Games Started
4
Tied-165th
Double Double
2
Tied-39th
Triple Double
0
Tied-12th
Offensive
Metric
Total
NBA rank
Assists
14
Tied-238th
Effective Field Goal Percentage
57.5
—
Field Goals
23/53
—
Field Goals Attempted
53
Tied-247th
Field Goals Made
23
Tied-251st
Field Goal Percentage
43.4
—
Free Throws
12/17
—
Free Throw Percentage
70.6
—
Free Throws Attempted
17
Tied-195th
Free Throws Made
12
Tied-200th
Offensive Rebounds
11
Tied-145th
Points
73
Tied-235th
Turnovers
10
Tied-214th
3-Point Field Goal Percentage
46.9
—
3-Point Field Goals Attempted
32
Tied-207th
3-Point Field Goals Made
15
Tied-144th
True Shooting Percentage
60.4
—
Total Turnovers
10
—
Assist Ratio
16.6
—
Points in the Paint
0
Tied-1st
Offensive Rebound Rate
0.0
—
Turnover Ratio
11.8
—
Brick Index
0.00
—
Usage Rate
0.0
—
Average Field Goals Made
3.3
—
Average Field Goals Attempted
7.6
—
Average 3-Point Field Goals Made
2.1
Tied-63rd
Average 3-Point Field Goals Attempted
4.6
—
Average Free Throws Made
1.7
—
Average Free Throws Attempted
2.4
—
Points Per Game
10.4
—
Offensive Rebounds Per Game
1.6
—
Assists Per Game
2.0
—
Turnovers Per Game
1.4
—
Offensive Rebound Percentage
0.4
—
Estimated Possessions
58.8
—
Estimated Possessions Per Game
8.4
—
Points Per Estimated Possession
1.2
—
Team Turnovers Per Game
0.0
—
Total Turnovers Per Game
1.4
—
3-Point Field Goal Percentage
46.9
—
2-Point Field Goals Made
8.0
Tied-107th
2-Point Field Goals Attempted
21.0
Tied-40th
2-Point Field Goals Made per Game
1.1
—
2-Point Field Goals Attempted per Game
3.0
—
2-Point Field Goal Percentage
38.1
—
Shooting Efficiency
0.58
—
Scoring Efficiency
1.377
—
Fieldgoals Made Per 48
6.5
3,012th
Fieldgoals Attempted Per 48
15.0
2,964th
3-Point Fieldgoals Made Per 48
4.2
1,728th
3-Point Fieldgoals Attempted Per 48
9.0
2,484th
Freethrows Made Per 48
3.4
2,400th
Freethrows Attempted Per 48
4.8
2,340th
Points Scored Per 48
20.6
2,820th
Offensive Rebounds Per 48
3.1
1,740th
Assists Per 48
4.0
2,856th
Turnovers
2.8
2,568th
P/40
17.2
—
A/40
3.3
—
04 / EFFICIENCY, SHOOTING PROFILE, PER-36
Advanced metrics
True shooting %60.1%
Effective FG %57.2%
2-point FG %40.0%
3-point attempt rate60.5%
Free throw rate31.6%
Points per shot attempt1.37
% of points from 3s60.6%
Assist-to-turnover1.43
Points per 36 min15.4
Rebounds per 36 min9.0
Assists per 36 min3.0
Steals per 36 min0.44
Blocks per 36 min0.59
Turnovers per 36 min2.07
Stocks (STL + BLK) per game0.70
Pts + Reb + Ast per game18.5
Efficiency (EFF) per game12.8
Game Score per game (Hollinger)8.2
Minutes per game24.3
Calculated by BallersCulture from the supplied 2026-27 box-score totals using standard formulas (hover a tile to see the formula). Tracking-based metrics such as BPM, VORP, on/off and RAPTOR are not available from this data source.
05 / 7 GAMES IN 2026-27
Game log: Regular season
Date
Opp
Result
MIN
FG
FG%
3PT
3P%
FT
FT%
REB
AST
BLK
STL
PF
TO
PTS
Nov 15
@ MEM
L 129-110
28
5-13
38.5
4-8
50.0
0-0
0.0
6
1
1
0
3
1
14
Nov 12
@ NO
W 145-111
29
3-8
37.5
1-2
50.0
3-4
75.0
11
4
2
1
2
2
10
Nov 9
@ DAL
L 130-93
36
2-7
28.6
1-3
33.3
5-6
83.3
3
2
0
1
2
1
10
Nov 8
@ ATL
L 124-121
31
4-10
40.0
2-7
28.6
1-4
25.0
10
1
0
0
3
3
11
Nov 5
vs CHA
W 114-104
19
4-6
66.7
2-4
50.0
3-3
100.0
5
3
0
0
4
0
13
Oct 31
vs DET
L 110-94
12
3-5
60.0
3-4
75.0
0-0
0.0
6
2
0
0
0
2
9
Oct 26
vs IND
L 136-109
15
2-4
50.0
2-4
50.0
0-0
0.0
2
1
0
0
3
1
6
06 / 2026-27 HOME / AWAY, RESULTS, MONTHS AND OPPONENTS
Splits
split
Split
GP
MIN
FG
FG%
3PT
3P%
FT
FT%
OR
DR
REB
AST
BLK
STL
PF
TO
PTS
All Splits
7
24.3
3.3-7.6
43.4
2.1-4.6
46.9
1.7-2.4
70.6
1.6
4.6
6.1
2.0
0.4
0.3
2.4
1.4
10.4
Home
3
15.3
3.0-5.0
60.0
2.3-4.0
58.3
1.0-1.0
100.0
0.3
4.0
4.3
2.0
0.0
0.0
2.3
1.0
9.3
Road
4
31.0
3.5-9.5
36.8
2.0-5.0
40.0
2.3-3.5
64.3
2.5
5.0
7.5
2.0
0.8
0.5
2.5
1.8
11.3
vs. Conference
4
19.3
3.3-6.3
52.0
2.3-4.8
47.4
1.0-1.8
57.1
1.0
4.8
5.8
1.8
0.0
0.0
2.5
1.5
9.8
3+ Days Rest
3
15.3
3.0-5.0
60.0
2.3-4.0
58.3
1.0-1.0
100.0
0.3
4.0
4.3
2.0
0.0
0.0
2.3
1.0
9.3
Month
Split
GP
MIN
FG
FG%
3PT
3P%
FT
FT%
OR
DR
REB
AST
BLK
STL
PF
TO
PTS
October
2
13.5
2.5-4.5
55.6
2.5-4.0
62.5
0.0-0.0
0.0
0.0
4.0
4.0
1.5
0.0
0.0
1.5
1.5
7.5
November
5
28.6
3.6-8.8
40.9
2.0-4.8
41.7
2.4-3.4
70.6
2.2
4.8
7.0
2.2
0.6
0.4
2.8
1.4
11.6
Pre All-Star
7
24.3
3.3-7.6
43.4
2.1-4.6
46.9
1.7-2.4
70.6
1.6
4.6
6.1
2.0
0.4
0.3
2.4
1.4
10.4
Result
Split
GP
MIN
FG
FG%
3PT
3P%
FT
FT%
OR
DR
REB
AST
BLK
STL
PF
TO
PTS
Wins
2
24.0
3.5-7.0
50.0
1.5-3.0
50.0
3.0-3.5
85.7
2.0
6.0
8.0
3.5
1.0
0.5
3.0
1.0
11.5
Losses
5
24.4
3.2-7.8
41.0
2.4-5.2
46.2
1.2-2.0
60.0
1.4
4.0
5.4
1.4
0.2
0.2
2.2
1.6
10.0
Position
Split
GP
MIN
FG
FG%
3PT
3P%
FT
FT%
OR
DR
REB
AST
BLK
STL
PF
TO
PTS
As Starter
4
31.0
3.5-9.5
36.8
2.0-5.0
40.0
2.3-3.5
64.3
2.5
5.0
7.5
2.0
0.8
0.5
2.5
1.8
11.3
Day
Split
GP
MIN
FG
FG%
3PT
3P%
FT
FT%
OR
DR
REB
AST
BLK
STL
PF
TO
PTS
Wednesday
2
24.0
3.5-7.0
50.0
1.5-3.0
50.0
3.0-3.5
85.7
2.0
6.0
8.0
3.5
1.0
0.5
3.0
1.0
11.5
Friday
1
12.0
3.0-5.0
60.0
3.0-4.0
75.0
0.0-0.0
0.0
0.0
6.0
6.0
2.0
0.0
0.0
0.0
2.0
9.0
Saturday
2
29.5
4.5-11.5
39.1
3.0-7.5
40.0
0.5-2.0
25.0
3.5
4.5
8.0
1.0
0.5
0.0
3.0
2.0
12.5
Sunday
2
25.5
2.0-5.5
36.4
1.5-3.5
42.9
2.5-3.0
83.3
0.0
2.5
2.5
1.5
0.0
0.5
2.5
1.0
8.0
Opponent
Split
GP
MIN
FG
FG%
3PT
3P%
FT
FT%
OR
DR
REB
AST
BLK
STL
PF
TO
PTS
Atlanta Hawks
1
31.0
4.0-10.0
40.0
2.0-7.0
28.6
1.0-4.0
25.0
3.0
7.0
10.0
1.0
0.0
0.0
3.0
3.0
11.0
Charlotte Hornets
1
19.0
4.0-6.0
66.7
2.0-4.0
50.0
3.0-3.0
100.0
1.0
4.0
5.0
3.0
0.0
0.0
4.0
0.0
13.0
Dallas Mavericks
1
36.0
2.0-7.0
28.6
1.0-3.0
33.3
5.0-6.0
83.3
0.0
3.0
3.0
2.0
0.0
1.0
2.0
1.0
10.0
Detroit Pistons
1
12.0
3.0-5.0
60.0
3.0-4.0
75.0
0.0-0.0
0.0
0.0
6.0
6.0
2.0
0.0
0.0
0.0
2.0
9.0
Indiana Pacers
1
15.0
2.0-4.0
50.0
2.0-4.0
50.0
0.0-0.0
0.0
0.0
2.0
2.0
1.0
0.0
0.0
3.0
1.0
6.0
Memphis Grizzlies
1
28.0
5.0-13.0
38.5
4.0-8.0
50.0
0.0-0.0
0.0
4.0
2.0
6.0
1.0
1.0
0.0
3.0
1.0
14.0
New Orleans Pelicans
1
29.0
3.0-8.0
37.5
1.0-2.0
50.0
3.0-4.0
75.0
3.0
8.0
11.0
4.0
2.0
1.0
2.0
2.0
10.0
07 / SEASON-BY-SEASON HISTORY
Career statistics
Regular Season Averages
Season
Team
GP
GS
MIN
FG
FG%
3PT
3P%
FT
FT%
OR
DR
REB
AST
BLK
STL
PF
TO
PTS
2025-26
Brooklyn Nets
57
15
20.8
3.1-7.7
40.5
1.2-3.7
32.2
1.5-1.9
77.1
1.0
3.9
4.9
2.2
0.6
0.5
2.2
1.3
8.9
2026-27
Brooklyn Nets
7
4
24.3
3.3-7.6
43.4
2.1-4.6
46.9
1.7-2.4
70.6
1.6
4.6
6.1
2.0
0.4
0.3
2.4
1.4
10.4
Career
—
64
19
21.2
3.1-7.7
40.8
1.3-3.8
34.2
1.5-2.0
76.2
1.1
4.0
5.1
2.2
0.5
0.5
2.2
1.3
9.1
Regular Season Totals
Season
Team
FG
FG%
3PT
3P%
FT
FT%
OR
DR
REB
AST
BLK
STL
PF
TO
PTS
2025-26
Brooklyn Nets
178-440
40.5
68-211
32.2
84-109
77.1
57
224
281
127
32
30
126
73
508
2026-27
Brooklyn Nets
23-53
43.4
15-32
46.9
12-17
70.6
11
32
43
14
3
2
17
10
73
Career
—
201-493
40.8
83-243
34.2
96-126
76.2
68
256
324
141
35
32
143
83
581
Regular Season Misc Totals
Season
Team
DD2
TD3
DQ
EJECT
TECH
FLAG
AST/TO
STL/TO
SC-EFF
SH-EFF
2025-26
Brooklyn Nets
2
0
1
0
1
0
1.7
0.4
1.155
0.48
2026-27
Brooklyn Nets
2
0
0
0
0
0
1.4
0.2
1.377
0.58
Career
—
4
0
1
0
1
0
1.7
0.4
1.178
0.49
Scoring, rebounding and assist trend
08 / SHOT CHART AND ZONE SHOOTING
Shot profile
Shot-location data is not connected. Add a BALLDONTLIE GOAT-tier NBA API key in NBA Players → Settings to enable shot charts and zone shooting.
LATEST UPDATEWolf finished with 14 points (5-13 FG, 4-8 3Pt), six rebounds, one assist and one block over 28 minutes in Saturday's 129-110 loss to Memphis.
Wolf started for the fourth consecutive game Saturday. While he couldn't secure his third double-double during that stretch, he ended the night by recording a season high in points and three-pointers. After a slow start to the 2026-27 campaign, Wolf has gotten more involved of late. That could continue as long as he remains in the starting lineup.




 Ben HumrichousF #12
 Ben SarafG #77
 Chaney JohnsonF #31
 Dain DainjaF #42
 Day’Ron SharpeC #20
 Dion BrownG
 Drake PowellG #4
 E.J. LiddellF #9
 Egor DeminG #8
 Grant NelsonF #16
 Josh MinottF #00
 Joshua JeffersonF #9
 Julius RandleF #30
 Keon EllisG #1
 Michael Porter Jr.F #17
 Mikel Brown Jr.G
 Moritz WagnerC #13
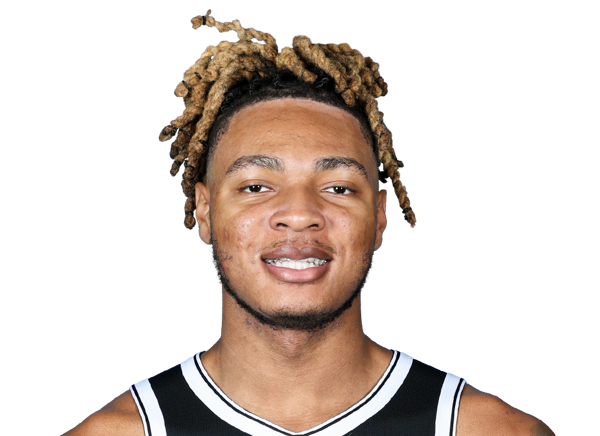 Noah ClowneyF #21
 Nolan TraoreG #10
 Terance MannG #14
 Trevon ScottF #13
 Tyler BilodeauF #34
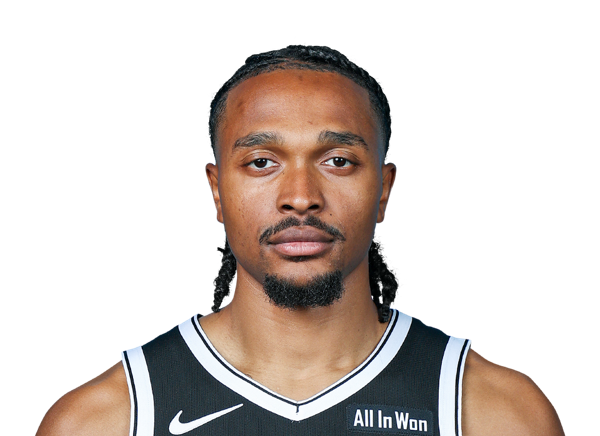 Tyson EtienneG #10