Click a season to open this player’s full game log, splits and advanced stats for that year; click a team to open its page. A dash means no NBA games were recorded.
03 / EVERY CATEGORY THE PROVIDER REPORTS
Full statistical breakdown
Regular season 2026-27
Defensive
Metric
Total
NBA rank
Blocks
1
Tied-289th
Defensive Rebounds
5
Tied-372nd
Steals
5
Tied-245th
Defensive Rebound Rate
0.0
—
Defensive Rebounds Per Game
0.7
—
Blocks Per Game
0.1
—
Steals Per Game
0.7
—
Defensive Rebounds Per 48
2.3
3,571st
Blocks Per 48
0.5
2,774th
Steals Per 48
2.3
2,352nd
General
Metric
Total
NBA rank
Disqualifications
0
Tied-21st
Flagrant Fouls
0
Tied-22nd
Fouls
17
Tied-250th
Player Efficiency Rating
3.44
—
Rebound Rate
0.0
—
Ejections
0
Tied-7th
Technical Fouls
1
Tied-29th
Rebounds
8
—
Value Over Replacement Player
0.0
—
Minutes
105
Tied-5th
Minutes Per Game
15.0
—
Rating
4.6
Tied-260th
Plus-Minus
-2
Tied-1st
Rebounds Per Game
1.1
—
Fouls Per Game
2.4
—
Flagrant Fouls Per Game
0.0
—
Technical Fouls Per Game
0.1
—
Ejections Per Game
0.0
—
Disqualifications Per Game
0.0
—
Assist To Turnover Ratio
10.0
—
Steal To Foul Ratio
0.3
—
Block To Foul Ratio
0.1
—
Team Rebounds Per Game
0.0
—
Rebounds
8
—
Total Technical Fouls
1
—
Assist To Turnover Ratio
0.0
—
Steal To Turnover Ratio
5.0
—
Rebounds Per 48 Minutes
3.7
—
Fouls Per 48 Minutes
7.8
2,400th
Flagrant Fouls Per 48 Minutes
0.0
211th
Technical Fouls Per 48 Minutes
0.5
278th
Ejections Per 48 Minutes
0.0
67th
Disqualifications Per 48 Minutes
0.0
201st
R/40
3.0
—
Games Played
7
7th
Games Started
0
Tied-257th
Double Double
0
Tied-119th
Triple Double
0
Tied-12th
Offensive
Metric
Total
NBA rank
Assists
10
Tied-278th
Effective Field Goal Percentage
29.4
—
Field Goals
4/17
—
Field Goals Attempted
17
Tied-351st
Field Goals Made
4
Tied-388th
Field Goal Percentage
23.5
—
Free Throws
0/0
—
Free Throw Percentage
0.0
—
Free Throws Attempted
0
Tied-418th
Free Throws Made
0
Tied-413th
Offensive Rebounds
3
Tied-328th
Points
10
Tied-396th
Turnovers
1
Tied-405th
3-Point Field Goal Percentage
16.7
—
3-Point Field Goals Attempted
12
Tied-292nd
3-Point Field Goals Made
2
Tied-315th
True Shooting Percentage
29.4
—
Total Turnovers
1
—
Assist Ratio
35.7
—
Points in the Paint
0
Tied-1st
Offensive Rebound Rate
0.0
—
Turnover Ratio
3.6
—
Brick Index
0.00
—
Usage Rate
0.0
—
Average Field Goals Made
0.6
—
Average Field Goals Attempted
2.4
—
Average 3-Point Field Goals Made
0.3
—
Average 3-Point Field Goals Attempted
1.7
—
Average Free Throws Made
0.0
—
Average Free Throws Attempted
0.0
—
Points Per Game
1.4
—
Offensive Rebounds Per Game
0.4
—
Assists Per Game
1.4
—
Turnovers Per Game
0.1
—
Offensive Rebound Percentage
0.2
—
Estimated Possessions
15.0
—
Estimated Possessions Per Game
2.1
—
Points Per Estimated Possession
0.7
—
Team Turnovers Per Game
0.0
—
Total Turnovers Per Game
0.1
—
3-Point Field Goal Percentage
16.7
—
2-Point Field Goals Made
2.0
Tied-73rd
2-Point Field Goals Attempted
5.0
Tied-59th
2-Point Field Goals Made per Game
0.3
—
2-Point Field Goals Attempted per Game
0.7
—
2-Point Field Goal Percentage
40.0
—
Shooting Efficiency
0.29
—
Scoring Efficiency
0.588
—
Fieldgoals Made Per 48
1.8
3,724th
Fieldgoals Attempted Per 48
7.8
3,369th
3-Point Fieldgoals Made Per 48
0.9
3,024th
3-Point Fieldgoals Attempted Per 48
5.5
2,803rd
Freethrows Made Per 48
0.0
3,964th
Freethrows Attempted Per 48
0.0
4,012th
Points Scored Per 48
4.6
3,801st
Offensive Rebounds Per 48
1.4
3,148th
Assists Per 48
4.6
2,668th
Turnovers
0.5
3,888th
P/40
3.8
—
A/40
3.8
—
04 / EFFICIENCY, SHOOTING PROFILE, PER-36
Advanced metrics
True shooting %29.2%
Effective FG %31.3%
2-point FG %42.9%
3-point attempt rate70.8%
Free throw rate0.0%
Points per shot attempt0.58
% of points from 3s64.3%
Assist-to-turnover14.00
Points per 36 min3.4
Rebounds per 36 min2.6
Assists per 36 min3.4
Steals per 36 min1.68
Blocks per 36 min0.24
Turnovers per 36 min0.24
Stocks (STL + BLK) per game0.80
Pts + Reb + Ast per game3.9
Efficiency (EFF) per game2.8
Game Score per game (Hollinger)1.1
Minutes per game15.0
Calculated by BallersCulture from the supplied 2026-27 box-score totals using standard formulas (hover a tile to see the formula). Tracking-based metrics such as BPM, VORP, on/off and RAPTOR are not available from this data source.
05 / 7 GAMES IN 2026-27
Game log: Regular season
Date
Opp
Result
MIN
FG
FG%
3PT
3P%
FT
FT%
REB
AST
BLK
STL
PF
TO
PTS
Nov 15
@ MEM
L 129-110
9
1-3
33.3
0-2
0.0
0-0
0.0
1
1
0
0
1
0
2
Nov 12
@ NO
W 145-111
18
2-4
50.0
2-3
66.7
0-0
0.0
1
3
0
1
2
0
6
Nov 9
@ DAL
L 130-93
22
0-2
0.0
0-1
0.0
0-0
0.0
1
1
0
1
4
0
0
Nov 8
@ ATL
L 124-121
13
0-2
0.0
0-2
0.0
0-0
0.0
2
0
0
0
2
1
0
Nov 5
vs CHA
W 114-104
16
0-4
0.0
0-3
0.0
0-0
0.0
2
2
0
1
3
0
0
Nov 2
@ IND
W 98-90
15
0-1
0.0
0-1
0.0
0-0
0.0
1
1
0
1
3
0
0
Oct 31
vs DET
L 110-94
12
1-1
100.0
0-0
0.0
0-0
0.0
0
2
1
1
2
0
2
06 / 2026-27 HOME / AWAY, RESULTS, MONTHS AND OPPONENTS
Splits
split
Split
GP
MIN
FG
FG%
3PT
3P%
FT
FT%
OR
DR
REB
AST
BLK
STL
PF
TO
PTS
All Splits
7
15.0
0.6-2.4
23.5
0.3-1.7
16.7
0.0-0.0
0.0
0.4
0.7
1.1
1.4
0.1
0.7
2.4
0.1
1.4
Home
2
14.0
0.5-2.5
20.0
0.0-1.5
0.0
0.0-0.0
0.0
0.5
0.5
1.0
2.0
0.5
1.0
2.5
0.0
1.0
Road
5
15.4
0.6-2.4
25.0
0.4-1.8
22.2
0.0-0.0
0.0
0.4
0.8
1.2
1.2
0.0
0.6
2.4
0.2
1.6
vs. Conference
4
14.0
0.3-2.0
12.5
0.0-1.5
0.0
0.0-0.0
0.0
0.5
0.8
1.3
1.3
0.3
0.8
2.5
0.3
0.5
3+ Days Rest
1
12.0
1.0-1.0
100.0
0.0-0.0
0.0
0.0-0.0
0.0
0.0
0.0
0.0
2.0
1.0
1.0
2.0
0.0
2.0
Month
Split
GP
MIN
FG
FG%
3PT
3P%
FT
FT%
OR
DR
REB
AST
BLK
STL
PF
TO
PTS
October
1
12.0
1.0-1.0
100.0
0.0-0.0
0.0
0.0-0.0
0.0
0.0
0.0
0.0
2.0
1.0
1.0
2.0
0.0
2.0
November
6
15.5
0.5-2.7
18.8
0.3-2.0
16.7
0.0-0.0
0.0
0.5
0.8
1.3
1.3
0.0
0.7
2.5
0.2
1.3
Pre All-Star
7
15.0
0.6-2.4
23.5
0.3-1.7
16.7
0.0-0.0
0.0
0.4
0.7
1.1
1.4
0.1
0.7
2.4
0.1
1.4
Result
Split
GP
MIN
FG
FG%
3PT
3P%
FT
FT%
OR
DR
REB
AST
BLK
STL
PF
TO
PTS
Wins
3
16.3
0.7-3.0
22.2
0.7-2.3
28.6
0.0-0.0
0.0
0.3
1.0
1.3
2.0
0.0
1.0
2.7
0.0
2.0
Losses
4
14.0
0.5-2.0
25.0
0.0-1.3
0.0
0.0-0.0
0.0
0.5
0.5
1.0
1.0
0.3
0.5
2.3
0.3
1.0
Day
Split
GP
MIN
FG
FG%
3PT
3P%
FT
FT%
OR
DR
REB
AST
BLK
STL
PF
TO
PTS
Wednesday
2
17.0
1.0-4.0
25.0
1.0-3.0
33.3
0.0-0.0
0.0
0.5
1.0
1.5
2.5
0.0
1.0
2.5
0.0
3.0
Friday
1
12.0
1.0-1.0
100.0
0.0-0.0
0.0
0.0-0.0
0.0
0.0
0.0
0.0
2.0
1.0
1.0
2.0
0.0
2.0
Saturday
2
11.5
0.5-2.5
20.0
0.0-2.0
0.0
0.0-0.0
0.0
1.0
0.5
1.5
0.5
0.0
0.0
1.5
0.5
1.0
Sunday
2
18.5
0.0-1.5
0.0
0.0-1.0
0.0
0.0-0.0
0.0
0.0
1.0
1.0
1.0
0.0
1.0
3.5
0.0
0.0
Opponent
Split
GP
MIN
FG
FG%
3PT
3P%
FT
FT%
OR
DR
REB
AST
BLK
STL
PF
TO
PTS
Atlanta Hawks
1
13.0
0.0-2.0
0.0
0.0-2.0
0.0
0.0-0.0
0.0
1.0
1.0
2.0
0.0
0.0
0.0
2.0
1.0
0.0
Charlotte Hornets
1
16.0
0.0-4.0
0.0
0.0-3.0
0.0
0.0-0.0
0.0
1.0
1.0
2.0
2.0
0.0
1.0
3.0
0.0
0.0
Dallas Mavericks
1
22.0
0.0-2.0
0.0
0.0-1.0
0.0
0.0-0.0
0.0
0.0
1.0
1.0
1.0
0.0
1.0
4.0
0.0
0.0
Detroit Pistons
1
12.0
1.0-1.0
100.0
0.0-0.0
0.0
0.0-0.0
0.0
0.0
0.0
0.0
2.0
1.0
1.0
2.0
0.0
2.0
Indiana Pacers
1
15.0
0.0-1.0
0.0
0.0-1.0
0.0
0.0-0.0
0.0
0.0
1.0
1.0
1.0
0.0
1.0
3.0
0.0
0.0
Memphis Grizzlies
1
9.0
1.0-3.0
33.3
0.0-2.0
0.0
0.0-0.0
0.0
1.0
0.0
1.0
1.0
0.0
0.0
1.0
0.0
2.0
New Orleans Pelicans
1
18.0
2.0-4.0
50.0
2.0-3.0
66.7
0.0-0.0
0.0
0.0
1.0
1.0
3.0
0.0
1.0
2.0
0.0
6.0
07 / SEASON-BY-SEASON HISTORY
Career statistics
Regular Season Averages
Season
Team
GP
GS
MIN
FG
FG%
3PT
3P%
FT
FT%
OR
DR
REB
AST
BLK
STL
PF
TO
PTS
2019-20
La Clippers
41
6
8.8
0.9-1.9
46.8
0.2-0.5
35.0
0.4-0.7
66.7
0.2
1.1
1.3
1.3
0.1
0.3
1.1
0.4
2.4
2020-21
La Clippers
67
10
18.9
2.7-5.2
50.9
0.6-1.4
41.8
1.2-1.4
83.0
0.8
2.8
3.6
1.6
0.2
0.4
1.9
0.6
7.0
2021-22
La Clippers
81
33
28.6
4.1-8.5
48.4
0.9-2.6
36.5
1.6-2.0
78.0
1.3
4.0
5.2
2.6
0.3
0.7
2.2
1.0
10.8
2022-23
La Clippers
81
36
23.1
3.4-6.5
51.9
1.0-2.4
38.9
1.1-1.5
78.0
1.0
2.5
3.4
2.3
0.3
0.5
1.8
1.0
8.8
2023-24
La Clippers
75
71
25.0
3.4-6.6
51.5
0.9-2.7
34.8
1.1-1.3
83.2
1.2
2.2
3.4
1.6
0.2
0.6
1.9
0.6
8.8
2024-25
La Clippers
37
12
19.8
2.4-5.3
44.6
0.7-2.0
34.7
0.6-0.9
71.9
0.9
2.0
2.9
1.6
0.3
0.8
1.8
0.7
6.0
2024-25
Atlanta Hawks
30
1
22.7
3.9-7.3
54.1
1.1-2.9
38.6
0.8-1.2
66.7
1.2
1.9
3.1
2.1
0.1
0.6
2.0
0.7
9.8
2024-25
2024 25 Totals
67
13
21.1
3.1-6.2
49.6
0.9-2.4
36.8
0.7-1.0
69.1
1.0
2.0
3.0
1.8
0.2
0.7
1.9
0.7
7.7
2025-26
Brooklyn Nets
63
51
24.3
2.7-5.8
45.7
0.9-2.4
36.4
1.0-1.3
78.8
1.1
2.1
3.2
3.0
0.2
0.7
2.5
1.1
7.2
2026-27
Brooklyn Nets
7
0
15.0
0.6-2.4
23.5
0.3-1.7
16.7
0.0-0.0
0.0
0.4
0.7
1.1
1.4
0.1
0.7
2.4
0.1
1.4
Career
—
482
220
22.3
3.0-6.1
49.5
0.8-2.2
36.9
1.0-1.3
78.2
1.0
2.5
3.4
2.1
0.2
0.6
2.0
0.8
7.9
Regular Season Totals
Season
Team
FG
FG%
3PT
3P%
FT
FT%
OR
DR
REB
AST
BLK
STL
PF
TO
PTS
2019-20
La Clippers
37-79
46.8
7-20
35.0
18-27
66.7
10
45
55
53
5
11
46
18
99
2020-21
La Clippers
178-350
50.9
38-91
41.8
78-94
83.0
56
186
242
104
13
29
126
40
472
2021-22
La Clippers
334-690
48.4
76-208
36.5
128-164
78.0
104
321
425
209
21
55
178
84
872
2022-23
La Clippers
272-524
51.9
77-198
38.9
92-118
78.0
77
199
276
184
22
42
149
80
713
2023-24
La Clippers
254-493
51.5
71-204
34.8
79-95
83.2
87
167
254
119
15
43
145
48
658
2024-25
La Clippers
87-195
44.6
26-75
34.7
23-32
71.9
32
75
107
59
11
28
68
25
223
2024-25
Atlanta Hawks
118-218
54.1
34-88
38.6
24-36
66.7
36
56
92
62
4
19
60
22
294
2024-25
2024 25 Totals
205-413
49.6
60-163
36.8
47-68
69.1
68
131
199
121
15
47
128
47
517
2025-26
Brooklyn Nets
168-368
45.7
56-154
36.4
63-80
78.8
70
130
200
190
15
41
155
71
455
2026-27
Brooklyn Nets
4-17
23.5
2-12
16.7
0-0
0.0
3
5
8
10
1
5
17
1
10
Career
—
1452-2934
49.5
387-1050
36.9
505-646
78.2
475
1184
1659
990
107
273
944
389
3796
Regular Season Misc Totals
Season
Team
DD2
TD3
DQ
EJECT
TECH
FLAG
AST/TO
STL/TO
SC-EFF
SH-EFF
2019-20
La Clippers
1
0
0
0
0
0
2.9
0.6
1.253
0.51
2020-21
La Clippers
2
0
1
0
0
0
2.6
0.7
1.349
0.56
2021-22
La Clippers
6
0
1
0
3
1
2.5
0.7
1.264
0.54
2022-23
La Clippers
1
0
0
1
5
0
2.3
0.5
1.361
0.59
2023-24
La Clippers
2
0
0
0
2
0
2.5
0.9
1.335
0.59
2024-25
La Clippers
0
0
0
0
0
0
2.4
1.1
1.144
0.51
2024-25
Atlanta Hawks
0
0
0
1
3
1
2.8
0.9
1.349
0.62
2024-25
2024 25 Totals
0
0
0
1
3
1
2.6
1.0
1.252
0.57
2025-26
Brooklyn Nets
0
0
0
0
5
1
2.7
0.6
1.236
0.53
2026-27
Brooklyn Nets
0
0
0
0
1
0
10.0
5.0
0.588
0.29
Career
—
12
0
2
2
19
3
2.5
0.7
1.294
0.56
Scoring, rebounding and assist trend
08 / SHOT CHART AND ZONE SHOOTING
Shot profile
Shot-location data is not connected. Add a BALLDONTLIE GOAT-tier NBA API key in NBA Players → Settings to enable shot charts and zone shooting.
LATEST UPDATEMann logged zero points (0-2 FG, 0-2 3Pt) and two rebounds over 13 minutes during Saturday's 124-121 loss to Atlanta.
Mann failed to score for the third straight game, and to this point he has scored only two points all season. Based on what we have seen thus far, it appears as though Mann is on the outside looking in when it comes to regular playing time. Assuming nothing much changes over the coming months, Mann can be safely ignored in all formats.




 Ben HumrichousF #12
 Ben SarafG #77
 Chaney JohnsonF #31
 Dain DainjaF #42
 Danny WolfF #2
 Day’Ron SharpeC #20
 Dion BrownG
 Drake PowellG #4
 E.J. LiddellF #9
 Egor DeminG #8
 Grant NelsonF #16
 Josh MinottF #00
 Joshua JeffersonF #9
 Julius RandleF #30
 Keon EllisG #1
 Michael Porter Jr.F #17
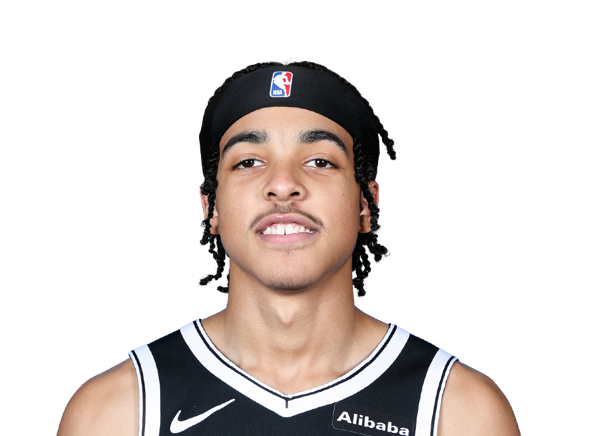 Mikel Brown Jr.G
 Moritz WagnerC #13
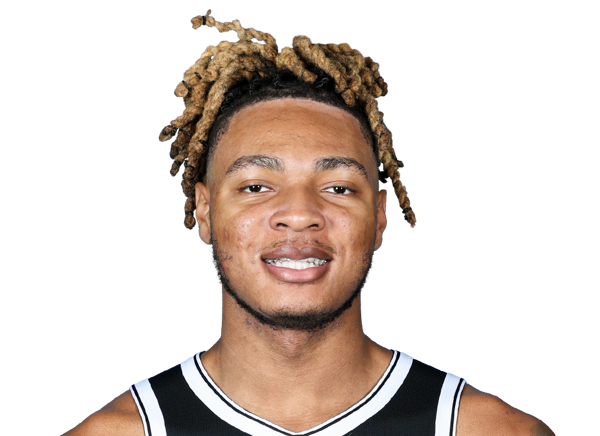 Noah ClowneyF #21
 Nolan TraoreG #10
 Trevon ScottF #13
 Tyler BilodeauF #34
 Tyson EtienneG #10