Click a season to open this player’s full game log, splits and advanced stats for that year; click a team to open its page. A dash means no NBA games were recorded.
03 / EVERY CATEGORY THE PROVIDER REPORTS
Full statistical breakdown
Regular season 2026-27
Defensive
Metric
Total
NBA rank
Blocks
3
Tied-194th
Defensive Rebounds
59
52nd
Steals
13
Tied-88th
Defensive Rebound Rate
0.0
—
Defensive Rebounds Per Game
4.5
50th
Blocks Per Game
0.2
Tied-182nd
Steals Per Game
1.0
81st
Defensive Rebounds Per 48
6.6
2,496th
Blocks Per 48
0.3
Tied-9,312th
Steals Per 48
1.5
Tied-4,224th
General
Metric
Total
NBA rank
Disqualifications
0
Tied-22nd
Flagrant Fouls
0
Tied-24th
Fouls
39
Tied-30th
Player Efficiency Rating
17.75
78th
Rebound Rate
0.0
—
Ejections
0
Tied-7th
Technical Fouls
0
Tied-104th
Rebounds
81
—
Value Over Replacement Player
0.0
—
Minutes
430
1st
Minutes Per Game
33.1
—
Rating
34.1
Tied-39th
Plus-Minus
-24
Tied-1st
Rebounds Per Game
6.2
Tied-55th
Fouls Per Game
3.0
Tied-31st
Flagrant Fouls Per Game
0.0
Tied-21st
Technical Fouls Per Game
0.0
Tied-84th
Ejections Per Game
0.0
Tied-6th
Disqualifications Per Game
0.0
Tied-21st
Assist To Turnover Ratio
1.3
—
Steal To Foul Ratio
0.3
—
Block To Foul Ratio
0.1
—
Team Rebounds Per Game
0.0
—
Rebounds
81
—
Total Technical Fouls
0
—
Assist To Turnover Ratio
0.0
—
Steal To Turnover Ratio
0.3
—
Rebounds Per 48 Minutes
9.0
—
Fouls Per 48 Minutes
4.4
Tied-1,440th
Flagrant Fouls Per 48 Minutes
0.0
Tied-1,152nd
Technical Fouls Per 48 Minutes
0.0
Tied-4,992nd
Ejections Per 48 Minutes
0.0
Tied-336th
Disqualifications Per 48 Minutes
0.0
Tied-1,056th
R/40
7.5
—
Games Played
13
13th
Games Started
13
Tied-38th
Double Double
1
Tied-68th
Triple Double
0
Tied-13th
Offensive
Metric
Total
NBA rank
Assists
61
Tied-40th
Effective Field Goal Percentage
51.8
—
Field Goals
91/195
—
Field Goals Attempted
195
36th
Field Goals Made
91
Tied-33rd
Field Goal Percentage
46.7
Tied-67th
Free Throws
70/89
—
Free Throw Percentage
78.7
135th
Free Throws Attempted
89
14th
Free Throws Made
70
19th
Offensive Rebounds
22
Tied-62nd
Points
272
29th
Turnovers
47
Tied-6th
3-Point Field Goal Percentage
33.9
148th
3-Point Field Goals Attempted
59
Tied-94th
3-Point Field Goals Made
20
Tied-104th
True Shooting Percentage
58.1
—
Total Turnovers
47
—
Assist Ratio
17.8
—
Points in the Paint
0
Tied-1st
Offensive Rebound Rate
0.0
—
Turnover Ratio
13.7
—
Brick Index
0.00
—
Usage Rate
0.0
—
Average Field Goals Made
7.0
36th
Average Field Goals Attempted
15.0
Tied-429th
Average 3-Point Field Goals Made
1.5
119th
Average 3-Point Field Goals Attempted
4.5
Tied-97th
Average Free Throws Made
5.4
20th
Average Free Throws Attempted
6.8
16th
Points Per Game
20.9
33rd
Offensive Rebounds Per Game
1.7
Tied-63rd
Assists Per Game
4.7
43rd
Turnovers Per Game
3.6
5th
Offensive Rebound Percentage
0.2
—
Estimated Possessions
255.6
—
Estimated Possessions Per Game
19.7
—
Points Per Estimated Possession
1.1
—
Team Turnovers Per Game
0.0
—
Total Turnovers Per Game
3.6
—
3-Point Field Goal Percentage
33.9
124th
2-Point Field Goals Made
71.0
71st
2-Point Field Goals Attempted
136.0
130th
2-Point Field Goals Made per Game
5.5
—
2-Point Field Goals Attempted per Game
10.5
—
2-Point Field Goal Percentage
52.2
—
Shooting Efficiency
0.52
—
Scoring Efficiency
1.395
—
Fieldgoals Made Per 48
10.2
Tied-1,584th
Fieldgoals Attempted Per 48
21.8
1,728th
3-Point Fieldgoals Made Per 48
2.2
Tied-4,992nd
3-Point Fieldgoals Attempted Per 48
6.6
Tied-4,512th
Freethrows Made Per 48
7.8
912th
Freethrows Attempted Per 48
9.9
672nd
Points Scored Per 48
30.4
1,392nd
Offensive Rebounds Per 48
2.5
Tied-2,976th
Assists Per 48
6.8
Tied-1,920th
Turnovers
5.2
Tied-288th
P/40
25.3
—
A/40
5.7
—
04 / EFFICIENCY, SHOOTING PROFILE, PER-36
Advanced metrics
True shooting %58.1%
Effective FG %51.7%
2-point FG %52.4%
3-point attempt rate30.0%
Free throw rate45.3%
Points per shot attempt1.39
% of points from 3s21.5%
Assist-to-turnover1.31
Points per 36 min22.7
Rebounds per 36 min6.7
Assists per 36 min5.1
Steals per 36 min1.09
Blocks per 36 min0.22
Turnovers per 36 min3.92
Stocks (STL + BLK) per game1.20
Pts + Reb + Ast per game31.8
Efficiency (EFF) per game20.0
Game Score per game (Hollinger)14.8
Minutes per game33.1
Calculated by BallersCulture from the supplied 2026-27 box-score totals using standard formulas (hover a tile to see the formula). Tracking-based metrics such as BPM, VORP, on/off and RAPTOR are not available from this data source.
05 / 13 GAMES IN 2026-27
Game log: Regular season
Date
Opp
Result
MIN
FG
FG%
3PT
3P%
FT
FT%
REB
AST
BLK
STL
PF
TO
PTS
Nov 17
vs PHI
L 135-123
34
13-20
65.0
2-4
50.0
5-5
100.0
6
1
1
2
5
1
33
Nov 15
@ MEM
L 129-110
31
8-16
50.0
3-6
50.0
3-6
50.0
4
5
0
3
2
4
22
Nov 12
@ NO
W 145-111
29
6-16
37.5
0-5
0.0
5-6
83.3
4
5
0
0
2
2
17
Nov 9
@ DAL
L 130-93
30
5-10
50.0
0-1
0.0
3-6
50.0
4
4
1
0
2
3
13
Nov 8
@ ATL
L 124-121
34
8-14
57.1
1-2
50.0
2-2
100.0
6
8
0
1
4
6
19
Nov 5
vs CHA
W 114-104
31
7-13
53.8
2-4
50.0
6-7
85.7
3
4
0
1
3
2
22
Nov 3
@ NY
L 103-90
36
5-16
31.3
0-4
0.0
11-15
73.3
11
2
0
1
2
4
21
Nov 2
@ IND
W 98-90
37
5-15
33.3
4-9
44.4
6-6
100.0
5
6
0
2
5
4
20
Oct 31
vs DET
L 110-94
25
4-13
30.8
3-6
50.0
4-4
100.0
8
3
0
0
3
5
15
Oct 28
@ BOS
L 125-124 OT
44
10-23
43.5
0-7
0.0
4-5
80.0
9
4
0
2
6
5
24
Oct 26
vs IND
L 136-109
24
2-8
25.0
0-2
0.0
6-8
75.0
7
7
0
1
0
3
10
Oct 25
@ CLE
L 125-121
35
7-13
53.8
2-4
50.0
7-8
87.5
6
5
0
0
1
4
23
Oct 22
vs CHA
L 110-103
38
11-18
61.1
3-5
60.0
8-11
72.7
8
7
1
0
4
4
33
06 / 2026-27 HOME / AWAY, RESULTS, MONTHS AND OPPONENTS
Splits
split
Split
GP
MIN
FG
FG%
3PT
3P%
FT
FT%
OR
DR
REB
AST
BLK
STL
PF
TO
PTS
All Splits
13
33.1
7.0-15.0
46.7
1.5-4.5
33.9
5.4-6.8
78.7
1.7
4.5
6.2
4.7
0.2
1.0
3.0
3.6
20.9
Home
5
30.4
7.4-14.4
51.4
2.0-4.2
47.6
5.8-7.0
82.9
1.2
5.2
6.4
4.4
0.4
0.8
3.0
3.0
22.6
Road
8
34.8
6.8-15.4
43.9
1.3-4.8
26.3
5.1-6.8
75.9
2.0
4.1
6.1
4.9
0.1
1.1
3.0
4.0
19.9
vs. Division
3
38.0
9.3-19.7
47.5
0.7-5.0
13.3
6.7-8.3
80.0
3.3
5.3
8.7
2.3
0.3
1.7
4.3
3.3
26.0
vs. Conference
10
33.9
7.2-15.3
47.1
1.7-4.7
36.2
5.9-7.1
83.1
1.9
5.0
6.9
4.7
0.2
1.0
3.3
3.8
22.0
3+ Days Rest
1
38.0
11.0-18.0
61.1
3.0-5.0
60.0
8.0-11.0
72.7
0.0
8.0
8.0
7.0
1.0
0.0
4.0
4.0
33.0
Month
Split
GP
MIN
FG
FG%
3PT
3P%
FT
FT%
OR
DR
REB
AST
BLK
STL
PF
TO
PTS
October
5
33.2
6.8-15.0
45.3
1.6-4.8
33.3
5.8-7.2
80.6
1.4
6.2
7.6
5.2
0.2
0.6
2.8
4.2
21.0
November
8
32.9
7.1-15.0
47.5
1.5-4.4
34.3
5.1-6.6
77.4
1.9
3.5
5.4
4.4
0.3
1.3
3.1
3.3
20.9
Pre All-Star
13
33.1
7.0-15.0
46.7
1.5-4.5
33.9
5.4-6.8
78.7
1.7
4.5
6.2
4.7
0.2
1.0
3.0
3.6
20.9
Result
Split
GP
MIN
FG
FG%
3PT
3P%
FT
FT%
OR
DR
REB
AST
BLK
STL
PF
TO
PTS
Wins
3
32.7
6.0-14.7
40.9
2.0-6.0
33.3
5.7-6.3
89.5
0.7
3.3
4.0
5.0
0.0
1.0
3.3
2.7
19.7
Losses
10
33.2
7.3-15.1
48.3
1.4-4.1
34.1
5.3-7.0
75.7
2.0
4.9
6.9
4.6
0.3
1.0
2.9
3.9
21.3
Position
Split
GP
MIN
FG
FG%
3PT
3P%
FT
FT%
OR
DR
REB
AST
BLK
STL
PF
TO
PTS
As Starter
13
33.1
7.0-15.0
46.7
1.5-4.5
33.9
5.4-6.8
78.7
1.7
4.5
6.2
4.7
0.2
1.0
3.0
3.6
20.9
Day
Split
GP
MIN
FG
FG%
3PT
3P%
FT
FT%
OR
DR
REB
AST
BLK
STL
PF
TO
PTS
Monday
2
35.0
9.0-18.0
50.0
1.0-4.0
25.0
8.0-10.0
80.0
4.0
4.5
8.5
1.5
0.5
1.5
3.5
2.5
27.0
Tuesday
1
44.0
10.0-23.0
43.5
0.0-7.0
0.0
4.0-5.0
80.0
2.0
7.0
9.0
4.0
0.0
2.0
6.0
5.0
24.0
Wednesday
3
32.7
8.0-15.7
51.1
1.7-4.7
35.7
6.3-8.0
79.2
0.3
4.7
5.0
5.3
0.3
0.3
3.0
2.7
24.0
Friday
1
25.0
4.0-13.0
30.8
3.0-6.0
50.0
4.0-4.0
100.0
2.0
6.0
8.0
3.0
0.0
0.0
3.0
5.0
15.0
Saturday
3
33.7
7.7-14.3
53.5
2.0-4.0
50.0
4.0-5.3
75.0
1.7
3.7
5.3
6.0
0.0
1.3
2.3
4.7
21.3
Sunday
3
30.7
4.0-11.0
36.4
1.3-4.0
33.3
5.0-6.7
75.0
1.3
4.0
5.3
5.7
0.3
1.0
2.3
3.3
14.3
Opponent
Split
GP
MIN
FG
FG%
3PT
3P%
FT
FT%
OR
DR
REB
AST
BLK
STL
PF
TO
PTS
Atlanta Hawks
1
34.0
8.0-14.0
57.1
1.0-2.0
50.0
2.0-2.0
100.0
3.0
3.0
6.0
8.0
0.0
1.0
4.0
6.0
19.0
Boston Celtics
1
44.0
10.0-23.0
43.5
0.0-7.0
0.0
4.0-5.0
80.0
2.0
7.0
9.0
4.0
0.0
2.0
6.0
5.0
24.0
Charlotte Hornets
2
34.5
9.0-15.5
58.1
2.5-4.5
55.6
7.0-9.0
77.8
0.0
5.5
5.5
5.5
0.5
0.5
3.5
3.0
27.5
Cleveland Cavaliers
1
35.0
7.0-13.0
53.8
2.0-4.0
50.0
7.0-8.0
87.5
1.0
5.0
6.0
5.0
0.0
0.0
1.0
4.0
23.0
Dallas Mavericks
1
30.0
5.0-10.0
50.0
0.0-1.0
0.0
3.0-6.0
50.0
1.0
3.0
4.0
4.0
1.0
0.0
2.0
3.0
13.0
Detroit Pistons
1
25.0
4.0-13.0
30.8
3.0-6.0
50.0
4.0-4.0
100.0
2.0
6.0
8.0
3.0
0.0
0.0
3.0
5.0
15.0
Indiana Pacers
2
30.5
3.5-11.5
30.4
2.0-5.5
36.4
6.0-7.0
85.7
1.5
4.5
6.0
6.5
0.0
1.5
2.5
3.5
15.0
Memphis Grizzlies
1
31.0
8.0-16.0
50.0
3.0-6.0
50.0
3.0-6.0
50.0
1.0
3.0
4.0
5.0
0.0
3.0
2.0
4.0
22.0
New Orleans Pelicans
1
29.0
6.0-16.0
37.5
0.0-5.0
0.0
5.0-6.0
83.3
1.0
3.0
4.0
5.0
0.0
0.0
2.0
2.0
17.0
New York Knicks
1
36.0
5.0-16.0
31.3
0.0-4.0
0.0
11.0-15.0
73.3
6.0
5.0
11.0
2.0
0.0
1.0
2.0
4.0
21.0
Philadelphia 76ers
1
34.0
13.0-20.0
65.0
2.0-4.0
50.0
5.0-5.0
100.0
2.0
4.0
6.0
1.0
1.0
2.0
5.0
1.0
33.0
07 / SEASON-BY-SEASON HISTORY
Career statistics
Regular Season Averages
Season
Team
GP
GS
MIN
FG
FG%
3PT
3P%
FT
FT%
OR
DR
REB
AST
BLK
STL
PF
TO
PTS
2014-15
Los Angeles Lakers
1
0
14.0
1.0-3.0
33.3
0.0-0.0
0.0
0.0-2.0
0.0
0.0
0.0
0.0
0.0
0.0
0.0
1.0
1.0
2.0
2015-16
Los Angeles Lakers
81
60
28.2
4.4-10.3
42.9
0.1-0.4
27.8
2.4-3.3
71.5
2.1
8.1
10.2
1.8
0.4
0.7
3.0
1.8
11.3
2016-17
Los Angeles Lakers
74
73
28.8
5.1-10.5
48.7
0.2-0.9
27.0
2.8-3.8
72.3
2.0
6.6
8.6
3.6
0.5
0.7
3.4
2.3
13.2
2017-18
Los Angeles Lakers
82
49
26.7
6.1-11.0
55.8
0.1-0.5
22.2
3.7-5.2
71.8
2.2
5.8
8.0
2.6
0.5
0.5
3.3
2.6
16.1
2018-19
New Orleans Pelicans
73
49
30.6
7.8-14.9
52.4
0.9-2.7
34.4
4.9-6.7
73.1
2.2
6.5
8.7
3.1
0.6
0.7
3.4
2.8
21.4
2019-20
New York Knicks
64
64
32.5
7.2-15.7
46.0
1.0-3.6
27.7
4.0-5.5
73.3
2.4
7.4
9.7
3.1
0.3
0.8
2.8
3.0
19.5
2020-21
New York Knicks
71
71
37.6
8.5-18.6
45.6
2.3-5.5
41.1
4.9-6.0
81.1
1.2
9.0
10.2
6.0
0.3
0.9
3.2
3.4
24.1
2021-22
New York Knicks
72
72
35.3
7.1-17.3
41.1
1.7-5.4
30.8
4.2-5.6
75.6
1.7
8.2
9.9
5.1
0.5
0.7
2.8
3.4
20.1
2022-23
New York Knicks
77
77
35.5
8.5-18.6
46.0
2.8-8.3
34.3
5.2-6.9
75.7
1.8
8.1
10.0
4.1
0.3
0.6
3.0
2.8
25.1
2023-24
New York Knicks
46
46
35.4
8.6-18.2
47.2
1.7-5.3
31.1
5.1-6.6
78.1
2.2
7.0
9.2
5.0
0.3
0.5
2.7
3.5
24.0
2024-25
Minnesota Timberwolves
69
69
32.3
6.6-13.6
48.5
1.6-4.6
34.4
3.9-4.9
80.6
2.1
5.0
7.1
4.7
0.2
0.7
2.5
2.8
18.7
2025-26
Minnesota Timberwolves
79
79
33.0
7.3-15.3
48.1
1.4-4.4
31.5
5.0-6.3
80.2
1.7
5.1
6.7
5.0
0.2
1.1
2.8
2.7
21.1
2026-27
Brooklyn Nets
13
13
33.1
7.0-15.0
46.7
1.5-4.5
33.9
5.4-6.8
78.7
1.7
4.5
6.2
4.7
0.2
1.0
3.0
3.6
20.9
Career
—
802
722
32.1
6.9-14.7
47.2
1.2-3.7
33.2
4.2-5.5
76.0
2.0
6.9
8.9
4.0
0.4
0.7
3.0
2.8
19.3
Regular Season Totals
Season
Team
FG
FG%
3PT
3P%
FT
FT%
OR
DR
REB
AST
BLK
STL
PF
TO
PTS
2014-15
Los Angeles Lakers
1-3
33.3
0-0
0.0
0-2
0.0
0
0
0
0
0
0
1
1
2
2015-16
Los Angeles Lakers
358-835
42.9
10-36
27.8
193-270
71.5
172
657
829
144
29
53
242
149
919
2016-17
Los Angeles Lakers
377-774
48.7
17-63
27.0
204-282
72.3
151
486
637
264
37
49
248
173
975
2017-18
Los Angeles Lakers
504-904
55.8
10-45
22.2
305-425
71.8
181
473
654
210
45
43
274
213
1323
2018-19
New Orleans Pelicans
571-1089
52.4
67-195
34.4
356-487
73.1
162
472
634
229
45
52
246
208
1565
2019-20
New York Knicks
463-1006
46.0
64-231
27.7
258-352
73.3
151
471
622
198
22
51
178
193
1248
2020-21
New York Knicks
602-1321
45.6
160-389
41.1
348-429
81.1
84
640
724
427
18
64
225
241
1712
2021-22
New York Knicks
512-1246
41.1
120-390
30.8
303-401
75.6
125
591
716
370
39
53
205
245
1447
2022-23
New York Knicks
658-1432
46.0
218-636
34.3
402-531
75.7
141
626
767
316
21
49
233
216
1936
2023-24
New York Knicks
395-836
47.2
76-244
31.1
236-302
78.1
99
324
423
229
12
25
125
159
1102
2024-25
Minnesota Timberwolves
455-939
48.5
108-314
34.4
270-335
80.6
144
343
487
323
16
47
175
196
1288
2025-26
Minnesota Timberwolves
580-1207
48.1
109-346
31.5
398-496
80.2
132
400
532
398
18
86
223
217
1667
2026-27
Brooklyn Nets
91-195
46.7
20-59
33.9
70-89
78.7
22
59
81
61
3
13
39
47
272
Career
—
5567-11787
47.2
979-2948
33.2
3343-4401
76.0
1564
5542
7106
3169
305
585
2414
2258
15456
Regular Season Misc Totals
Season
Team
DD2
TD3
DQ
EJECT
TECH
FLAG
AST/TO
STL/TO
SC-EFF
SH-EFF
2014-15
Los Angeles Lakers
0
0
0
0
0
0
0.0
0.0
0.667
0.33
2015-16
Los Angeles Lakers
34
1
2
0
2
0
1.0
0.4
1.101
0.43
2016-17
Los Angeles Lakers
18
3
2
0
7
0
1.5
0.3
1.260
0.50
2017-18
Los Angeles Lakers
28
1
6
0
7
0
1.0
0.2
1.463
0.56
2018-19
New Orleans Pelicans
31
1
3
0
4
0
1.1
0.3
1.437
0.56
2019-20
New York Knicks
30
0
1
0
6
2
1.0
0.3
1.241
0.49
2020-21
New York Knicks
41
6
1
1
11
0
1.8
0.3
1.296
0.52
2021-22
New York Knicks
31
1
1
2
12
1
1.5
0.2
1.161
0.46
2022-23
New York Knicks
40
0
1
1
11
1
1.5
0.2
1.352
0.54
2023-24
New York Knicks
18
1
0
0
2
0
1.4
0.2
1.318
0.52
2024-25
Minnesota Timberwolves
14
0
0
0
1
1
1.6
0.2
1.372
0.54
2025-26
Minnesota Timberwolves
15
3
0
0
1
2
1.8
0.4
1.381
0.53
2026-27
Brooklyn Nets
1
0
0
0
0
0
1.3
0.3
1.395
0.52
Career
—
301
17
17
4
64
7
1.4
0.3
1.311
0.51
Scoring, rebounding and assist trend
08 / SHOT CHART AND ZONE SHOOTING
Shot profile
Shot-location data is not connected. Add a BALLDONTLIE GOAT-tier NBA API key in NBA Players → Settings to enable shot charts and zone shooting.
LATEST UPDATERandle collected 33 points (13-20 FG, 2-4 3Pt, 5-5 FT), six rebounds, one assist, two steals and one block in 33 minutes during Monday's 135-123 loss to the 76ers.
Randle suffered an injury to his mouth during the fourth quarter that required stitches, but he missed only a few minutes before gaining clearance to return. He had his way on the offensive end Monday and managed to tie his best mark of the season, which he also reached in the season opener against Charlotte. Randle also managed to record at least one steal and one block in a game for the first time this year and has racked up five total steals over his last two showings.




 Ben HumrichousF #12
 Ben SarafG #77
 Chaney JohnsonF #31
 Dain DainjaF #42
 Danny WolfF #2
 Day’Ron SharpeC #20
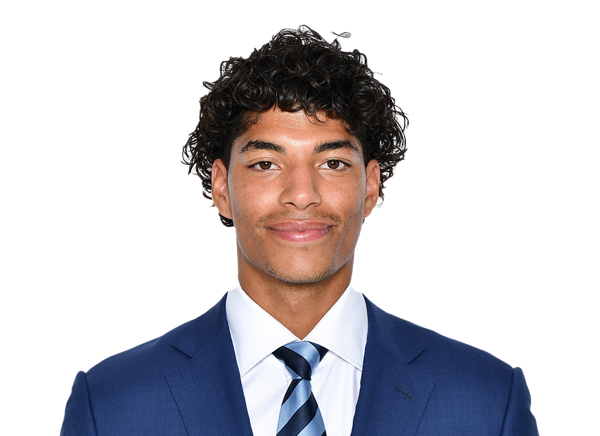 Dion BrownG
 Drake PowellG #4
 E.J. LiddellF #9
 Egor DeminG #8
 Grant NelsonF #16
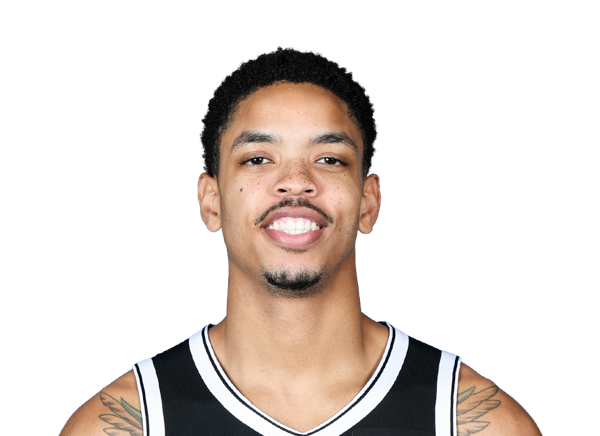 Josh MinottF #00
 Joshua JeffersonF #9
 Keon EllisG #1
 Michael Porter Jr.F #17
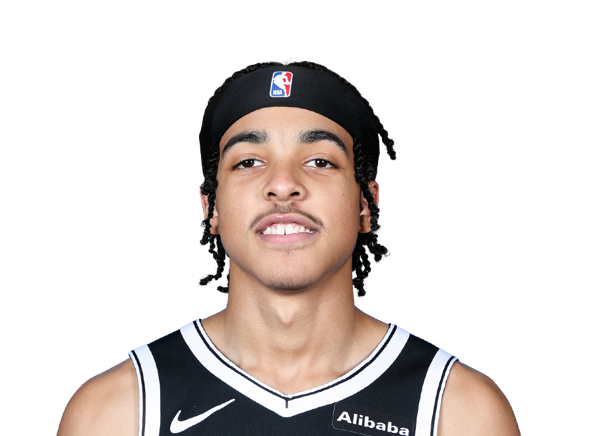 Mikel Brown Jr.G
 Moritz WagnerC #13
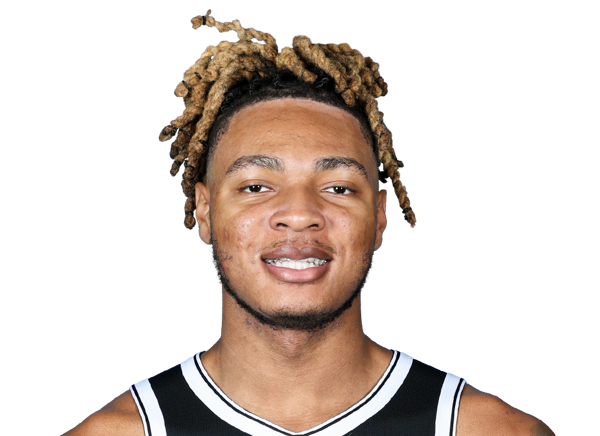 Noah ClowneyF #21
 Nolan TraoreG #10
 Terance MannG #14
 Trevon ScottF #13
 Tyler BilodeauF #34
 Tyson EtienneG #10