Click a season to open this player’s full game log, splits and advanced stats for that year; click a team to open its page. A dash means no NBA games were recorded.
03 / EVERY CATEGORY THE PROVIDER REPORTS
Full statistical breakdown
Regular season 2026-27
Defensive
Metric
Total
NBA rank
Blocks
6
Tied-110th
Defensive Rebounds
60
45th
Steals
16
Tied-33rd
Defensive Rebound Rate
0.0
—
Defensive Rebounds Per Game
4.6
48th
Blocks Per Game
0.5
Tied-116th
Steals Per Game
1.2
45th
Defensive Rebounds Per 48
6.7
—
Blocks Per 48
0.7
—
Steals Per 48
1.8
—
General
Metric
Total
NBA rank
Disqualifications
0
Tied-21st
Flagrant Fouls
0
Tied-22nd
Fouls
39
Tied-25th
Player Efficiency Rating
19.86
40th
Rebound Rate
0.0
—
Ejections
0
Tied-7th
Technical Fouls
0
Tied-101st
Rebounds
64
—
Value Over Replacement Player
0.0
—
Minutes
429
—
Minutes Per Game
33.0
—
Rating
38.1
Tied-19th
Plus-Minus
+53
Tied-1st
Rebounds Per Game
4.9
96th
Fouls Per Game
3.0
Tied-34th
Flagrant Fouls Per Game
0.0
Tied-19th
Technical Fouls Per Game
0.0
Tied-82nd
Ejections Per Game
0.0
Tied-6th
Disqualifications Per Game
0.0
Tied-20th
Assist To Turnover Ratio
1.8
—
Steal To Foul Ratio
0.4
—
Block To Foul Ratio
0.2
—
Team Rebounds Per Game
0.0
—
Rebounds
64
—
Total Technical Fouls
0
—
Assist To Turnover Ratio
0.0
—
Steal To Turnover Ratio
0.4
—
Rebounds Per 48 Minutes
7.2
—
Fouls Per 48 Minutes
4.4
—
Flagrant Fouls Per 48 Minutes
0.0
—
Technical Fouls Per 48 Minutes
0.0
—
Ejections Per 48 Minutes
0.0
—
Disqualifications Per 48 Minutes
0.0
—
R/40
6.0
—
Games Played
13
13th
Games Started
13
Tied-22nd
Double Double
2
Tied-39th
Triple Double
0
Tied-12th
Offensive
Metric
Total
NBA rank
Assists
73
Tied-27th
Effective Field Goal Percentage
56.5
—
Field Goals
103/215
—
Field Goals Attempted
215
Tied-17th
Field Goals Made
103
Tied-15th
Field Goal Percentage
47.9
54th
Free Throws
56/72
—
Free Throw Percentage
77.8
Tied-138th
Free Throws Attempted
72
Tied-28th
Free Throws Made
56
Tied-29th
Offensive Rebounds
4
Tied-296th
Points
299
Tied-12th
Turnovers
40
Tied-15th
3-Point Field Goal Percentage
38.1
99th
3-Point Field Goals Attempted
97
Tied-13th
3-Point Field Goals Made
37
Tied-15th
True Shooting Percentage
60.6
—
Total Turnovers
40
—
Assist Ratio
20.3
—
Points in the Paint
0
Tied-1st
Offensive Rebound Rate
0.0
—
Turnover Ratio
11.1
—
Brick Index
0.00
—
Usage Rate
0.0
—
Average Field Goals Made
7.9
26th
Average Field Goals Attempted
16.5
445th
Average 3-Point Field Goals Made
2.8
19th
Average 3-Point Field Goals Attempted
7.5
Tied-17th
Average Free Throws Made
4.3
Tied-36th
Average Free Throws Attempted
5.5
Tied-32nd
Points Per Game
23.0
21st
Offensive Rebounds Per Game
0.3
Tied-255th
Assists Per Game
5.6
26th
Turnovers Per Game
3.1
19th
Offensive Rebound Percentage
0.0
—
Estimated Possessions
279.8
—
Estimated Possessions Per Game
21.5
—
Points Per Estimated Possession
1.1
—
Team Turnovers Per Game
0.0
—
Total Turnovers Per Game
3.1
—
3-Point Field Goal Percentage
38.1
84th
2-Point Field Goals Made
66.0
—
2-Point Field Goals Attempted
118.0
Tied-4th
2-Point Field Goals Made per Game
5.1
—
2-Point Field Goals Attempted per Game
9.1
—
2-Point Field Goal Percentage
55.9
54th
Shooting Efficiency
0.57
—
Scoring Efficiency
1.391
—
Fieldgoals Made Per 48
11.5
—
Fieldgoals Attempted Per 48
24.1
—
3-Point Fieldgoals Made Per 48
4.1
—
3-Point Fieldgoals Attempted Per 48
10.9
—
Freethrows Made Per 48
6.3
—
Freethrows Attempted Per 48
8.1
—
Points Scored Per 48
33.5
—
Offensive Rebounds Per 48
0.4
—
Assists Per 48
8.2
—
Turnovers
4.5
—
P/40
27.9
—
A/40
6.8
—
04 / EFFICIENCY, SHOOTING PROFILE, PER-36
Advanced metrics
True shooting %60.8%
Effective FG %56.4%
2-point FG %56.7%
3-point attempt rate45.5%
Free throw rate33.3%
Points per shot attempt1.39
% of points from 3s36.5%
Assist-to-turnover1.81
Points per 36 min25.1
Rebounds per 36 min5.3
Assists per 36 min6.1
Steals per 36 min1.31
Blocks per 36 min0.55
Turnovers per 36 min3.38
Stocks (STL + BLK) per game1.70
Pts + Reb + Ast per game33.5
Efficiency (EFF) per game22.3
Game Score per game (Hollinger)16.9
Minutes per game33.0
Calculated by BallersCulture from the supplied 2026-27 box-score totals using standard formulas (hover a tile to see the formula). Tracking-based metrics such as BPM, VORP, on/off and RAPTOR are not available from this data source.
05 / 13 GAMES IN 2026-27
Game log: Regular season
Date
Opp
Result
MIN
FG
FG%
3PT
3P%
FT
FT%
REB
AST
BLK
STL
PF
TO
PTS
Nov 14
@ MIA
L 133-121
33
9-21
42.9
5-12
41.7
2-4
50.0
4
7
0
0
5
3
25
Nov 12
@ NY
W 115-107
36
8-15
53.3
2-7
28.6
5-5
100.0
7
6
1
2
2
4
23
Nov 10
@ CHA
L 124-112
23
4-11
36.4
1-3
33.3
2-2
100.0
2
4
0
1
1
0
11
Nov 8
vs NY
L 109-97
37
13-22
59.1
5-13
38.5
6-11
54.5
4
4
1
2
4
5
37
Nov 7
vs PHI
W 119-95
33
7-18
38.9
1-6
16.7
8-10
80.0
7
8
1
2
1
4
23
Nov 5
@ OKC
L 124-116
33
10-17
58.8
5-10
50.0
2-2
100.0
3
6
0
1
5
2
27
Nov 3
vs OKC
L 117-112
36
6-17
35.3
4-9
44.4
1-4
25.0
5
11
0
0
3
3
17
Nov 1
@ MIL
W 136-111
24
5-7
71.4
2-4
50.0
3-3
100.0
4
3
0
0
5
2
15
Oct 30
@ ATL
L 114-111
33
7-19
36.8
1-9
11.1
7-8
87.5
3
3
0
1
2
0
22
Oct 29
vs WSH
W 121-111
31
6-13
46.2
2-5
40.0
5-5
100.0
5
7
0
2
2
5
19
Oct 27
vs MIN
W 127-125 OT
38
10-21
47.6
5-9
55.6
1-1
100.0
5
7
1
2
2
3
26
Oct 25
vs BKN
W 125-121
35
7-15
46.7
2-6
33.3
6-6
100.0
5
4
1
1
4
4
22
Oct 23
@ PHI
L 114-106
35
11-19
57.9
2-4
50.0
8-11
72.7
10
3
1
2
3
5
32
06 / 2026-27 HOME / AWAY, RESULTS, MONTHS AND OPPONENTS
Splits
split
Split
GP
MIN
FG
FG%
3PT
3P%
FT
FT%
OR
DR
REB
AST
BLK
STL
PF
TO
PTS
All Splits
13
33.0
7.9-16.5
47.9
2.8-7.5
38.1
4.3-5.5
77.8
0.3
4.6
4.9
5.6
0.5
1.2
3.0
3.1
23.0
Home
6
35.3
8.2-17.7
46.2
3.2-8.0
39.6
4.5-6.2
73.0
0.5
4.7
5.2
6.8
0.7
1.5
2.7
4.0
24.0
Road
7
31.0
7.7-15.6
49.5
2.6-7.0
36.7
4.1-5.0
82.9
0.1
4.6
4.7
4.6
0.3
1.0
3.3
2.3
22.1
vs. Division
1
24.0
5.0-7.0
71.4
2.0-4.0
50.0
3.0-3.0
100.0
0.0
4.0
4.0
3.0
0.0
0.0
5.0
2.0
15.0
vs. Conference
10
32.2
7.7-16.0
48.1
2.3-6.9
33.3
5.2-6.5
80.0
0.3
4.8
5.1
4.9
0.5
1.3
2.9
3.2
22.9
3+ Days Rest
1
35.0
11.0-19.0
57.9
2.0-4.0
50.0
8.0-11.0
72.7
0.0
10.0
10.0
3.0
1.0
2.0
3.0
5.0
32.0
Month
Split
GP
MIN
FG
FG%
3PT
3P%
FT
FT%
OR
DR
REB
AST
BLK
STL
PF
TO
PTS
October
6
33.0
7.7-15.7
48.9
2.3-6.2
37.8
5.0-5.7
88.2
0.5
4.8
5.3
4.5
0.5
1.3
3.0
3.2
22.7
November
7
33.1
8.1-17.3
47.1
3.3-8.6
38.3
3.7-5.4
68.4
0.1
4.4
4.6
6.6
0.4
1.1
3.0
3.0
23.3
Pre All-Star
13
33.0
7.9-16.5
47.9
2.8-7.5
38.1
4.3-5.5
77.8
0.3
4.6
4.9
5.6
0.5
1.2
3.0
3.1
23.0
Result
Split
GP
MIN
FG
FG%
3PT
3P%
FT
FT%
OR
DR
REB
AST
BLK
STL
PF
TO
PTS
Wins
6
33.2
7.2-14.8
48.3
2.3-6.2
37.8
4.7-5.0
93.3
0.5
5.0
5.5
5.8
0.7
1.5
2.7
3.7
21.3
Losses
7
33.0
8.6-18.0
47.6
3.3-8.6
38.3
4.0-6.0
66.7
0.1
4.3
4.4
5.4
0.3
1.0
3.3
2.6
24.4
Position
Split
GP
MIN
FG
FG%
3PT
3P%
FT
FT%
OR
DR
REB
AST
BLK
STL
PF
TO
PTS
As Starter
13
33.0
7.9-16.5
47.9
2.8-7.5
38.1
4.3-5.5
77.8
0.3
4.6
4.9
5.6
0.5
1.2
3.0
3.1
23.0
Day
Split
GP
MIN
FG
FG%
3PT
3P%
FT
FT%
OR
DR
REB
AST
BLK
STL
PF
TO
PTS
Monday
3
32.3
6.7-16.3
40.8
3.3-7.0
47.6
1.3-2.3
57.1
0.3
3.7
4.0
7.3
0.3
1.0
2.0
2.0
18.0
Wednesday
3
33.3
8.0-15.0
53.3
3.0-7.3
40.9
4.0-4.0
100.0
0.3
4.7
5.0
6.3
0.3
1.7
3.0
3.7
23.0
Thursday
2
34.0
9.0-19.0
47.4
1.5-6.5
23.1
7.5-9.5
78.9
0.5
6.0
6.5
3.0
0.5
1.5
2.5
2.5
27.0
Friday
2
33.0
8.0-19.5
41.0
3.0-9.0
33.3
5.0-7.0
71.4
0.5
5.0
5.5
7.5
0.5
1.0
3.0
3.5
24.0
Saturday
3
32.3
8.3-14.7
56.8
3.0-7.7
39.1
5.0-6.7
75.0
0.0
4.3
4.3
3.7
0.7
1.0
4.3
3.7
24.7
Opponent
Split
GP
MIN
FG
FG%
3PT
3P%
FT
FT%
OR
DR
REB
AST
BLK
STL
PF
TO
PTS
Atlanta Hawks
1
33.0
7.0-19.0
36.8
1.0-9.0
11.1
7.0-8.0
87.5
1.0
2.0
3.0
3.0
0.0
1.0
2.0
0.0
22.0
Brooklyn Nets
1
35.0
7.0-15.0
46.7
2.0-6.0
33.3
6.0-6.0
100.0
0.0
5.0
5.0
4.0
1.0
1.0
4.0
4.0
22.0
Charlotte Hornets
1
23.0
4.0-11.0
36.4
1.0-3.0
33.3
2.0-2.0
100.0
0.0
2.0
2.0
4.0
0.0
1.0
1.0
0.0
11.0
Miami Heat
1
33.0
9.0-21.0
42.9
5.0-12.0
41.7
2.0-4.0
50.0
0.0
4.0
4.0
7.0
0.0
0.0
5.0
3.0
25.0
Milwaukee Bucks
1
24.0
5.0-7.0
71.4
2.0-4.0
50.0
3.0-3.0
100.0
0.0
4.0
4.0
3.0
0.0
0.0
5.0
2.0
15.0
Minnesota Timberwolves
1
38.0
10.0-21.0
47.6
5.0-9.0
55.6
1.0-1.0
100.0
1.0
4.0
5.0
7.0
1.0
2.0
2.0
3.0
26.0
New York Knicks
2
36.5
10.5-18.5
56.8
3.5-10.0
35.0
5.5-8.0
68.8
0.0
5.5
5.5
5.0
1.0
2.0
3.0
4.5
30.0
Philadelphia 76ers
2
34.5
9.0-18.5
48.6
1.5-5.0
30.0
8.0-10.5
76.2
0.5
8.0
8.5
5.5
1.0
2.0
2.0
4.5
27.5
Oklahoma City Thunder
2
34.5
8.0-17.0
47.1
4.5-9.5
47.4
1.5-3.0
50.0
0.0
4.0
4.0
8.5
0.0
0.5
4.0
2.5
22.0
Washington Wizards
1
31.0
6.0-13.0
46.2
2.0-5.0
40.0
5.0-5.0
100.0
1.0
4.0
5.0
7.0
0.0
2.0
2.0
5.0
19.0
07 / SEASON-BY-SEASON HISTORY
Career statistics
Regular Season Averages
Season
Team
GP
GS
MIN
FG
FG%
3PT
3P%
FT
FT%
OR
DR
REB
AST
BLK
STL
PF
TO
PTS
2017-18
Utah Jazz
79
71
33.4
7.5-17.2
43.7
2.4-7.0
34.0
3.0-3.8
80.5
0.7
3.1
3.7
3.7
0.3
1.5
2.7
2.7
20.5
2018-19
Utah Jazz
77
77
33.7
8.6-19.9
43.2
2.4-6.7
36.2
4.1-5.1
80.6
0.8
3.3
4.1
4.2
0.4
1.4
2.7
2.8
23.8
2019-20
Utah Jazz
69
69
34.3
8.7-19.4
44.9
2.5-6.9
36.6
4.0-4.7
86.3
0.8
3.6
4.4
4.3
0.2
1.0
2.5
2.7
24.0
2020-21
Utah Jazz
53
53
33.4
9.0-20.6
43.8
3.4-8.7
38.6
5.0-6.0
84.5
0.9
3.5
4.4
5.2
0.3
1.0
2.2
2.8
26.4
2021-22
Utah Jazz
67
67
33.8
9.2-20.5
44.8
3.5-9.8
35.5
4.0-4.7
85.3
0.8
3.4
4.2
5.3
0.2
1.5
2.4
3.0
25.9
2022-23
Cleveland Cavaliers
68
68
35.8
10.0-20.6
48.4
3.6-9.3
38.6
4.7-5.4
86.7
0.9
3.3
4.3
4.4
0.4
1.5
2.5
2.6
28.3
2023-24
Cleveland Cavaliers
55
55
35.3
9.1-19.8
46.2
3.3-9.0
36.8
5.0-5.8
86.5
0.8
4.3
5.1
6.1
0.5
1.8
2.1
2.8
26.6
2024-25
Cleveland Cavaliers
71
71
31.4
8.2-18.6
44.3
3.3-8.9
36.8
4.2-5.1
82.3
0.8
3.7
4.5
5.0
0.2
1.3
2.0
2.1
24.0
2025-26
Cleveland Cavaliers
70
70
33.5
9.7-20.0
48.3
3.2-8.8
36.4
5.3-6.1
86.5
0.7
3.8
4.5
5.7
0.3
1.5
2.3
2.8
27.9
2026-27
Cleveland Cavaliers
13
13
33.0
7.9-16.5
47.9
2.8-7.5
38.1
4.3-5.5
77.8
0.3
4.6
4.9
5.6
0.5
1.2
3.0
3.1
23.0
Career
—
622
614
33.8
8.8-19.5
45.3
3.0-8.3
36.6
4.3-5.1
84.2
0.8
3.6
4.3
4.8
0.3
1.4
2.4
2.7
25.0
Regular Season Totals
Season
Team
FG
FG%
3PT
3P%
FT
FT%
OR
DR
REB
AST
BLK
STL
PF
TO
PTS
2017-18
Utah Jazz
595-1362
43.7
187-550
34.0
239-297
80.5
52
244
296
291
27
118
213
215
1616
2018-19
Utah Jazz
661-1530
43.2
188-519
36.2
319-396
80.6
59
257
316
322
31
106
208
218
1829
2019-20
Utah Jazz
602-1342
44.9
173-473
36.6
278-322
86.3
53
251
304
294
14
70
172
184
1655
2020-21
Utah Jazz
478-1091
43.8
178-461
38.6
267-316
84.5
50
185
235
277
15
52
117
147
1401
2021-22
Utah Jazz
617-1376
44.8
232-654
35.5
267-313
85.3
55
227
282
358
12
99
164
200
1733
2022-23
Cleveland Cavaliers
679-1402
48.4
245-635
38.6
319-368
86.7
63
226
289
301
27
99
168
180
1922
2023-24
Cleveland Cavaliers
503-1089
46.2
182-494
36.8
275-318
86.5
46
234
280
333
30
101
118
154
1463
2024-25
Cleveland Cavaliers
585-1320
44.3
233-633
36.8
298-362
82.3
57
265
322
354
17
95
140
149
1701
2025-26
Cleveland Cavaliers
678-1403
48.3
224-616
36.4
372-430
86.5
50
266
316
398
20
104
163
198
1952
2026-27
Cleveland Cavaliers
103-215
47.9
37-97
38.1
56-72
77.8
4
60
64
73
6
16
39
40
299
Career
—
5501-12130
45.3
1879-5132
36.6
2690-3194
84.2
489
2215
2704
3001
199
860
1502
1685
15571
Regular Season Misc Totals
Season
Team
DD2
TD3
DQ
EJECT
TECH
FLAG
AST/TO
STL/TO
SC-EFF
SH-EFF
2017-18
Utah Jazz
0
0
0
0
2
0
1.4
0.5
1.186
0.51
2018-19
Utah Jazz
1
0
0
0
2
0
1.5
0.5
1.195
0.49
2019-20
Utah Jazz
1
0
0
0
6
2
1.6
0.4
1.233
0.51
2020-21
Utah Jazz
2
0
0
1
5
0
1.9
0.4
1.284
0.52
2021-22
Utah Jazz
3
0
0
1
5
0
1.8
0.5
1.259
0.53
2022-23
Cleveland Cavaliers
5
0
0
1
4
1
1.7
0.6
1.371
0.57
2023-24
Cleveland Cavaliers
6
0
0
1
4
0
2.2
0.7
1.343
0.55
2024-25
Cleveland Cavaliers
6
0
0
0
1
0
2.4
0.6
1.289
0.53
2025-26
Cleveland Cavaliers
5
0
1
0
5
0
2.0
0.5
1.391
0.56
2026-27
Cleveland Cavaliers
2
0
0
0
0
0
1.8
0.4
1.391
0.57
Career
—
31
0
1
4
34
3
1.8
0.5
1.284
0.53
Scoring, rebounding and assist trend
08 / SHOT CHART AND ZONE SHOOTING
Shot profile
Shot-location data is not connected. Add a BALLDONTLIE GOAT-tier NBA API key in NBA Players → Settings to enable shot charts and zone shooting.
LATEST UPDATEMitchell (knee) is not listed on the injury report for Monday's game against the Bulls.
Mitchell sat out Saturday's 127-117 victory over Dallas due to a left knee contusion. Mitchell and the rest of the Cavs' starting five missed the win against the Mavericks after the team dealt with flight issues following Friday's loss in Miami. However, the superstar guard will be back as Cleveland's offensive engine Monday. He's averaging 23.0 points, 4.9 rebounds, 5.6 assists, 1.2 steals and 2.8 three-pointers in 33.0 minutes across 13 outings in 2026-27.


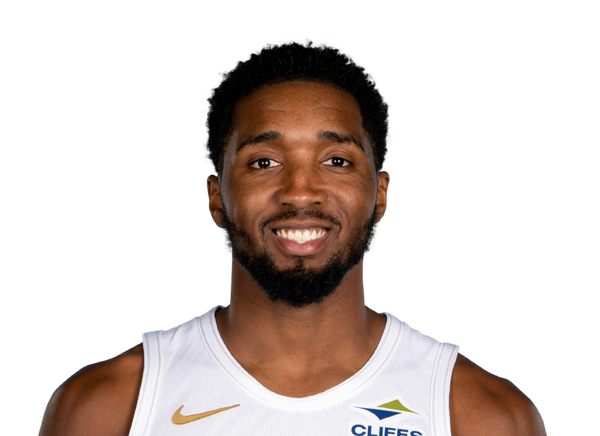

 Craig Porter Jr.G #9
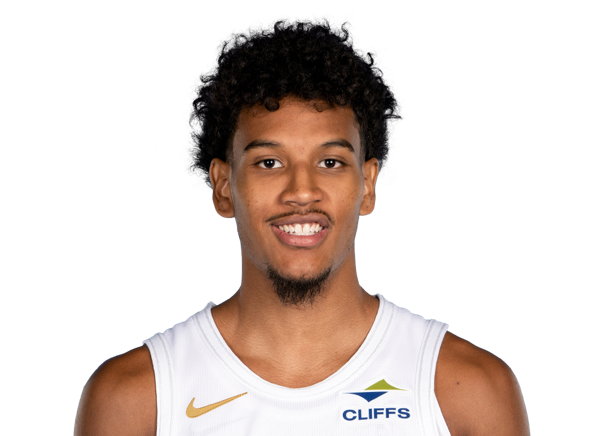 Curtis JonesG #14
 Ernest Udeh Jr.C #88
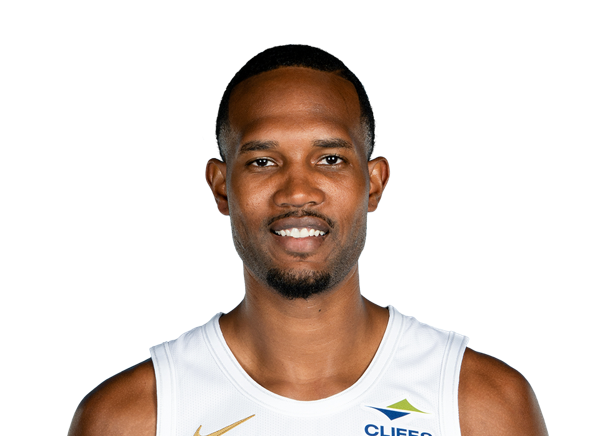 Evan MobleyC #4
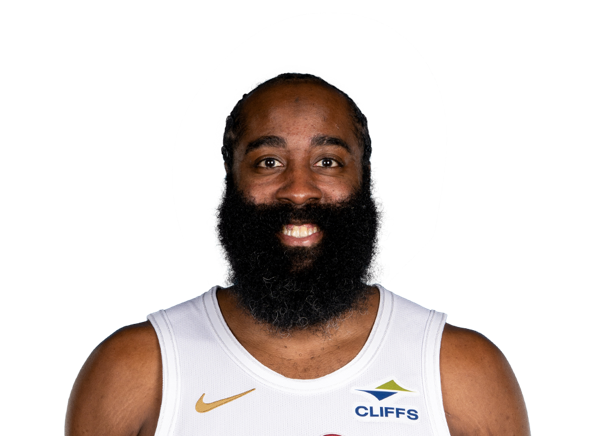 James HardenG #1
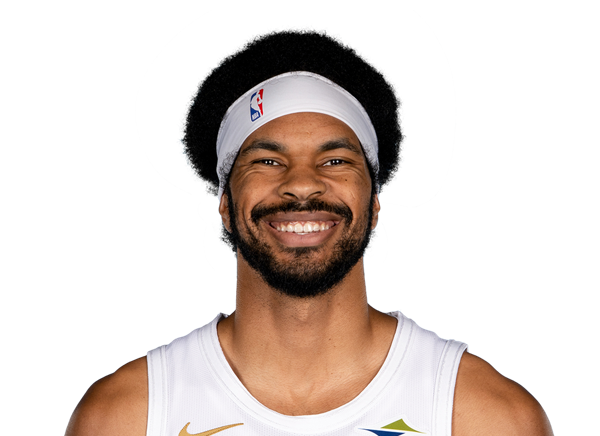 Jarrett AllenC #31
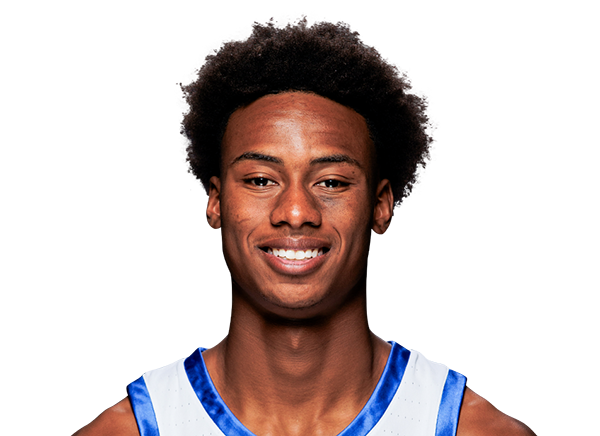 Jaxson RobinsonF #2
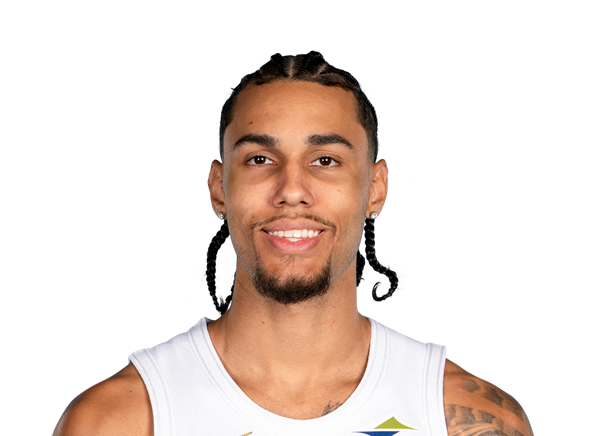 Jaylon TysonG #20
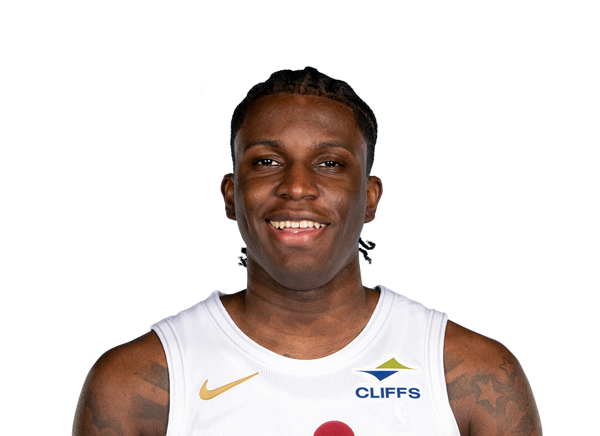 Kadary RichmondG #16
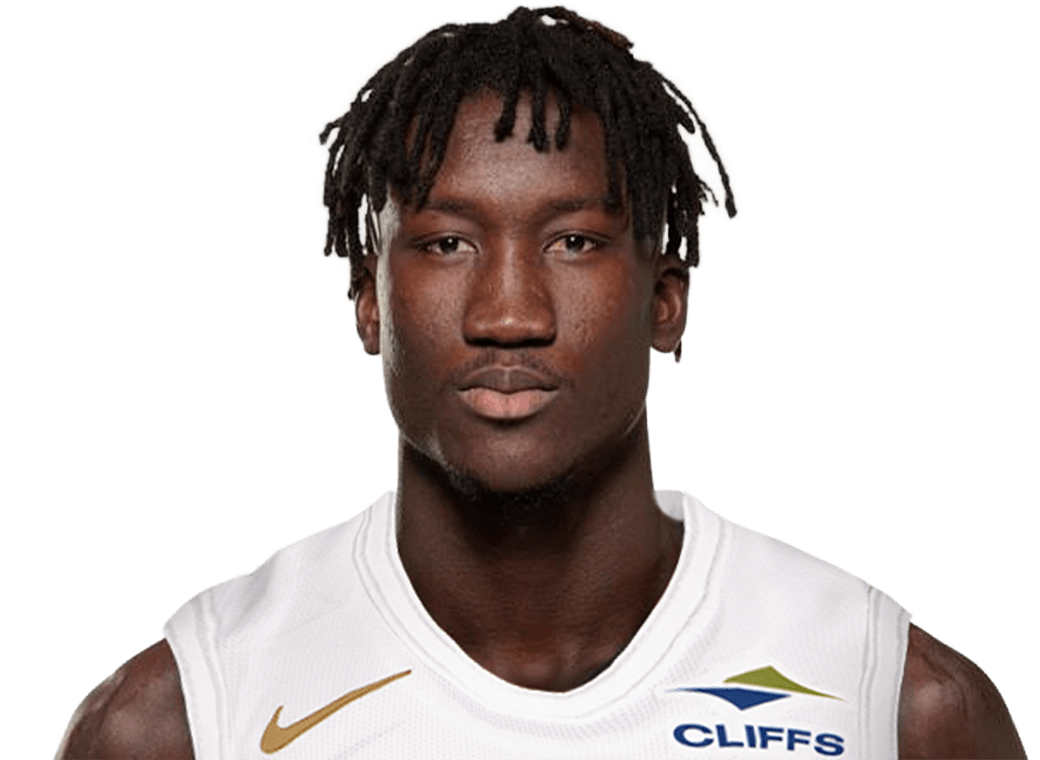 Khalifa DiopC #18
 Luke TraversF #33
 Mario HezonjaF #33
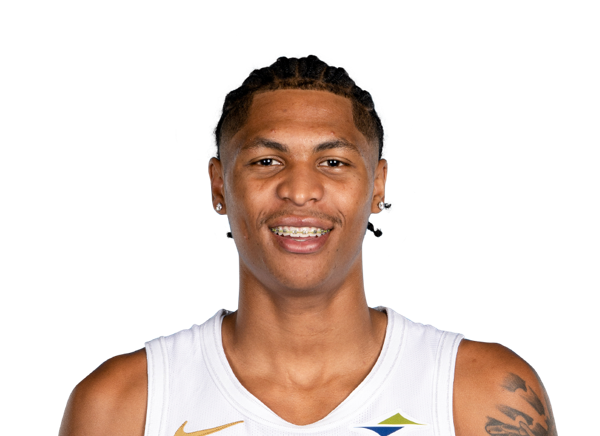 Meleek ThomasG #15
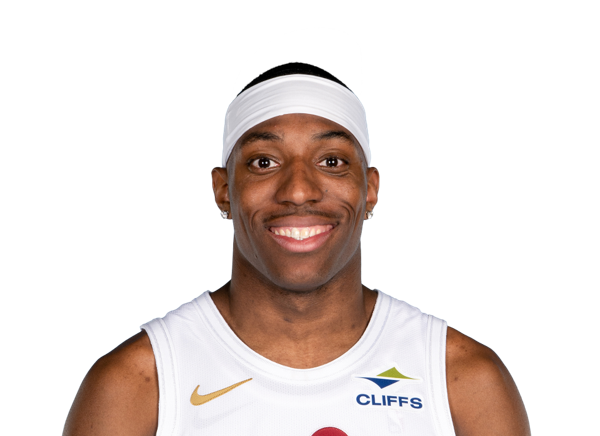 Nae’Qwan TomlinF #35
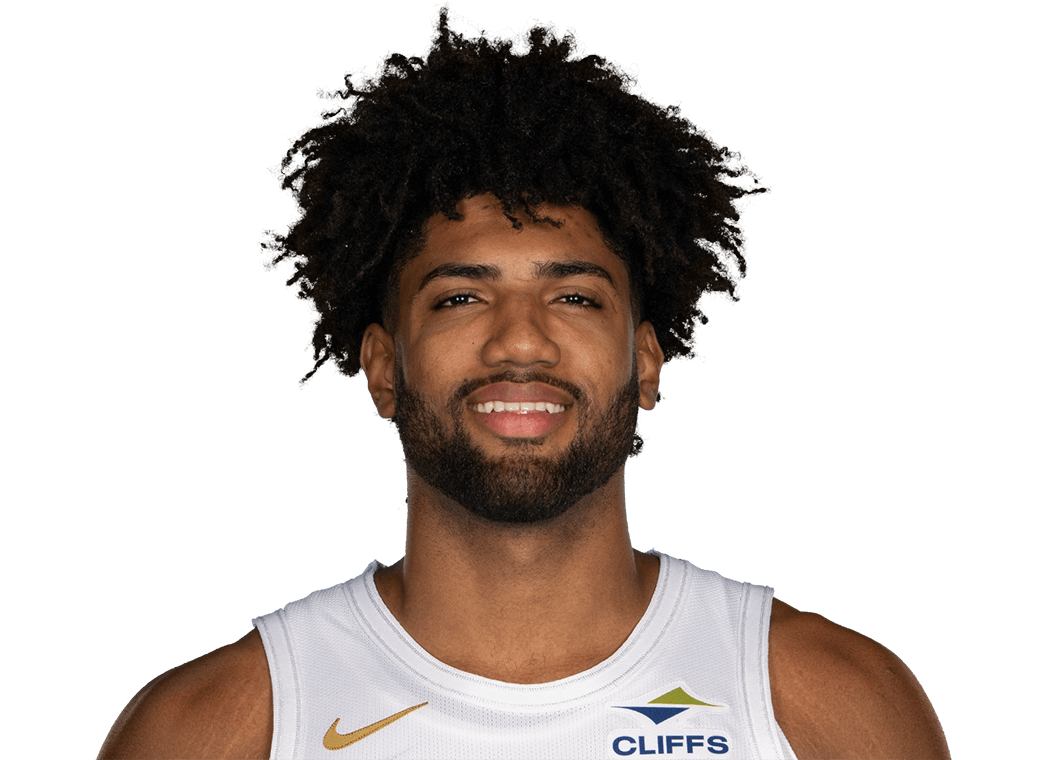 Norchad OmierC #77
 Olivier SarrF #33
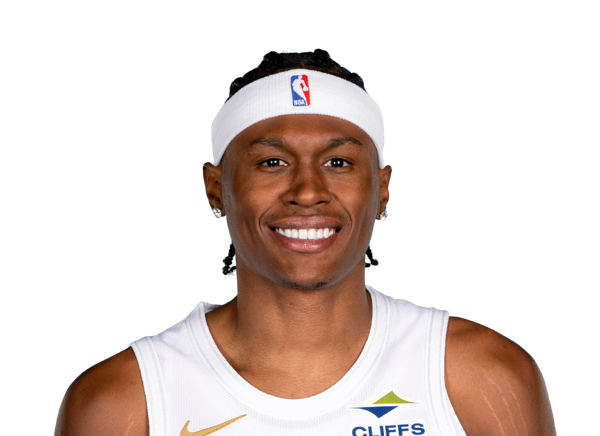 Peyton WatsonG #8
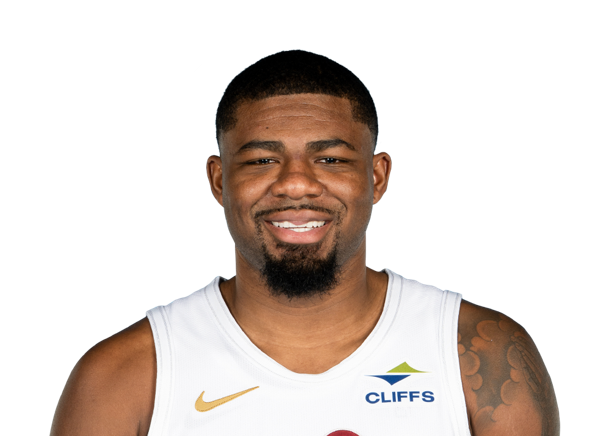 Rashaun AgeeF #19
 Riley MinixF #12
 Sam MerrillG #5
 Thomas BryantC #3
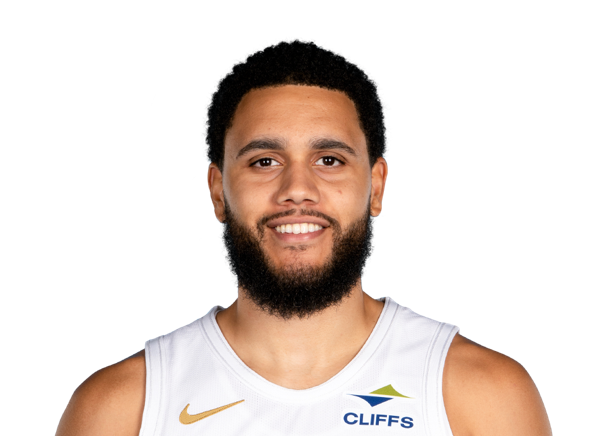 Tristan EnarunaF #21
 Tyrese ProctorG #24
 Zack AustinF #55