


BALLERSCULTURE PLAYER PROFILE · 2026-27
Riley Minix
Cleveland Cavaliers · F • #12 • 6' 7" 230 lbs

01 / 2026-27 PER-GAME AVERAGES
Season snapshot
PTS3.0
REB2.0
AST0.0
STL0.0
BLK0.0
TO0.0
MIN13.8
FG%29.4
3P%18.2
FT%0.0
GP4
GS0
FG1.3-4.3
3PT0.5-2.8
FT0.0-0.0
OR1.0
Per-game averages, regular season 2026-27 (Cleveland Cavaliers).
02 / EVERY SEASON SINCE 2022-23, SIDE BY SIDE
2022-23 to 2026-27
Per game
| Season | Team | GP | GS | MIN | PTS | REB | AST | STL | BLK | TO | FG% | 3P% | FT% |
|---|---|---|---|---|---|---|---|---|---|---|---|---|---|
| 2022-23 | — | — | — | — | — | — | — | — | — | — | — | — | — |
| 2023-24 | — | — | — | — | — | — | — | — | — | — | — | — | — |
| 2024-25 | San Antonio Spurs | 1 | 0 | 7.0 | 0.0 | 2.0 | 0.0 | 0.0 | 0.0 | 0.0 | 0.0 | 0.0 | 0.0 |
| 2025-26 | San Antonio Spurs | 9 | 0 | 6.4 | 3.9 | 0.7 | 0.6 | 0.2 | 0.1 | 0.3 | 60.9 | 33.3 | 100.0 |
| 2026-27 | Cleveland Cavaliers | 4 | 0 | 13.8 | 3.0 | 2.0 | 0.0 | 0.0 | 0.0 | 0.0 | 29.4 | 18.2 | 0.0 |
Season totals
| Season | Team | GP | GS | MIN | PTS | REB | AST | STL | BLK | TO | FG% | 3P% | FT% |
|---|---|---|---|---|---|---|---|---|---|---|---|---|---|
| 2022-23 | — | — | — | — | — | — | — | — | — | — | — | — | — |
| 2023-24 | — | — | — | — | — | — | — | — | — | — | — | — | — |
| 2024-25 | San Antonio Spurs | — | — | — | 0 | 2 | 0 | 0 | 0 | 0 | 0.0 | 0.0 | 0.0 |
| 2025-26 | San Antonio Spurs | — | — | — | 9 | 2 | 1 | 1 | 0 | 0 | 66.7 | 33.3 | 0.0 |
| 2026-27 | Cleveland Cavaliers | — | — | — | 12 | 8 | 0 | 0 | 0 | 0 | 29.4 | 18.2 | 0.0 |
Click a season to open this player’s full game log, splits and advanced stats for that year; click a team to open its page. A dash means no NBA games were recorded.
03 / EVERY CATEGORY THE PROVIDER REPORTS
Full statistical breakdown
Regular season 2026-27
Defensive
| Metric | Total | NBA rank |
|---|---|---|
| Blocks | 0 | Tied-376th |
| Defensive Rebounds | 4 | Tied-382nd |
| Steals | 0 | Tied-405th |
| Defensive Rebound Rate | 0.0 | — |
| Defensive Rebounds Per Game | 1.0 | — |
| Blocks Per Game | 0.0 | — |
| Steals Per Game | 0.0 | — |
| Defensive Rebounds Per 48 | 3.5 | 3,056th |
| Blocks Per 48 | 0.0 | 3,008th |
| Steals Per 48 | 0.0 | 3,240th |
General
| Metric | Total | NBA rank |
|---|---|---|
| Disqualifications | 0 | Tied-22nd |
| Flagrant Fouls | 0 | Tied-24th |
| Fouls | 5 | Tied-368th |
| Player Efficiency Rating | 2.65 | — |
| Rebound Rate | 0.0 | — |
| Ejections | 0 | Tied-7th |
| Technical Fouls | 0 | Tied-104th |
| Rebounds | 8 | — |
| Value Over Replacement Player | -6.7 | — |
| Minutes | 55 | Tied-6th |
| Minutes Per Game | 13.8 | — |
| Rating | 4.1 | Tied-571st |
| Plus-Minus | +11 | Tied-1st |
| Rebounds Per Game | 2.0 | — |
| Fouls Per Game | 1.3 | — |
| Flagrant Fouls Per Game | 0.0 | — |
| Technical Fouls Per Game | 0.0 | — |
| Ejections Per Game | 0.0 | — |
| Disqualifications Per Game | 0.0 | — |
| Assist To Turnover Ratio | 0.0 | — |
| Steal To Foul Ratio | 0.0 | — |
| Block To Foul Ratio | 0.0 | — |
| Team Rebounds Per Game | 0.0 | — |
| Rebounds | 8 | — |
| Total Technical Fouls | 0 | — |
| Assist To Turnover Ratio | 0.0 | — |
| Steal To Turnover Ratio | 0.0 | — |
| Rebounds Per 48 Minutes | 7.0 | — |
| Fouls Per 48 Minutes | 4.4 | 2,944th |
| Flagrant Fouls Per 48 Minutes | 0.0 | 192nd |
| Technical Fouls Per 48 Minutes | 0.0 | 832nd |
| Ejections Per 48 Minutes | 0.0 | 56th |
| Disqualifications Per 48 Minutes | 0.0 | 176th |
| R/40 | 5.8 | — |
| Games Played | 4 | 4th |
| Games Started | 0 | Tied-258th |
| Double Double | 0 | Tied-121st |
| Triple Double | 0 | Tied-13th |
Offensive
| Metric | Total | NBA rank |
|---|---|---|
| Assists | 0 | Tied-434th |
| Effective Field Goal Percentage | 35.3 | — |
| Field Goals | 5/17 | — |
| Field Goals Attempted | 17 | Tied-360th |
| Field Goals Made | 5 | Tied-384th |
| Field Goal Percentage | 29.4 | — |
| Free Throws | 0/0 | — |
| Free Throw Percentage | 0.0 | — |
| Free Throws Attempted | 0 | Tied-422nd |
| Free Throws Made | 0 | Tied-416th |
| Offensive Rebounds | 4 | Tied-305th |
| Points | 12 | Tied-390th |
| Turnovers | 0 | Tied-438th |
| 3-Point Field Goal Percentage | 18.2 | — |
| 3-Point Field Goals Attempted | 11 | Tied-300th |
| 3-Point Field Goals Made | 2 | Tied-320th |
| True Shooting Percentage | 35.3 | — |
| Total Turnovers | 0 | — |
| Assist Ratio | 0.0 | — |
| Points in the Paint | 0 | Tied-1st |
| Offensive Rebound Rate | 0.0 | — |
| Turnover Ratio | 0.0 | — |
| Brick Index | 0.00 | — |
| Usage Rate | 0.0 | — |
| Average Field Goals Made | 1.3 | — |
| Average Field Goals Attempted | 4.3 | — |
| Average 3-Point Field Goals Made | 0.5 | — |
| Average 3-Point Field Goals Attempted | 2.8 | — |
| Average Free Throws Made | 0.0 | — |
| Average Free Throws Attempted | 0.0 | — |
| Points Per Game | 3.0 | — |
| Offensive Rebounds Per Game | 1.0 | — |
| Assists Per Game | 0.0 | — |
| Turnovers Per Game | 0.0 | — |
| Offensive Rebound Percentage | 0.3 | — |
| Estimated Possessions | 13.0 | — |
| Estimated Possessions Per Game | 3.3 | — |
| Points Per Estimated Possession | 0.9 | — |
| Team Turnovers Per Game | 0.0 | — |
| Total Turnovers Per Game | 0.0 | — |
| 3-Point Field Goal Percentage | 18.2 | — |
| 2-Point Field Goals Made | 3.0 | Tied-64th |
| 2-Point Field Goals Attempted | 6.0 | Tied-60th |
| 2-Point Field Goals Made per Game | 0.8 | — |
| 2-Point Field Goals Attempted per Game | 1.5 | — |
| 2-Point Field Goal Percentage | 50.0 | — |
| Shooting Efficiency | 0.35 | — |
| Scoring Efficiency | 0.706 | — |
| Fieldgoals Made Per 48 | 4.4 | 3,072nd |
| Fieldgoals Attempted Per 48 | 14.8 | 2,880th |
| 3-Point Fieldgoals Made Per 48 | 1.7 | 2,560th |
| 3-Point Fieldgoals Attempted Per 48 | 9.6 | 2,400th |
| Freethrows Made Per 48 | 0.0 | 3,328th |
| Freethrows Attempted Per 48 | 0.0 | 3,376th |
| Points Scored Per 48 | 10.5 | 3,120th |
| Offensive Rebounds Per 48 | 3.5 | 2,440th |
| Assists Per 48 | 0.0 | 3,472nd |
| Turnovers | 0.0 | 3,504th |
| P/40 | 8.7 | — |
| A/40 | 0.0 | — |
04 / EFFICIENCY, SHOOTING PROFILE, PER-36
Advanced metrics
True shooting %34.9%
Effective FG %36.0%
2-point FG %53.3%
3-point attempt rate65.1%
Free throw rate0.0%
Points per shot attempt0.70
% of points from 3s50.0%
Points per 36 min7.8
Rebounds per 36 min5.2
Assists per 36 min0.0
Steals per 36 min0.00
Blocks per 36 min0.00
Turnovers per 36 min0.00
Stocks (STL + BLK) per game0.00
Pts + Reb + Ast per game5.0
Efficiency (EFF) per game2.0
Game Score per game (Hollinger)1.0
Minutes per game13.8
Calculated by BallersCulture from the supplied 2026-27 box-score totals using standard formulas (hover a tile to see the formula). Tracking-based metrics such as BPM, VORP, on/off and RAPTOR are not available from this data source.
05 / 4 GAMES IN 2026-27
Game log: Regular season
| Date | Opp | Result | MIN | FG | FG% | 3PT | 3P% | FT | FT% | REB | AST | BLK | STL | PF | TO | PTS |
|---|---|---|---|---|---|---|---|---|---|---|---|---|---|---|---|---|
| Nov 15 | vs DAL | W 127-117 | 22 | 1-6 | 16.7 | 0-3 | 0.0 | 0-0 | 0.0 | 0 | 0 | 0 | 0 | 4 | 0 | 2 |
| Nov 10 | @ CHA | L 124-112 | 17 | 1-4 | 25.0 | 0-3 | 0.0 | 0-0 | 0.0 | 2 | 0 | 0 | 0 | 1 | 0 | 2 |
| Nov 8 | vs NY | L 109-97 | 10 | 3-4 | 75.0 | 2-3 | 66.7 | 0-0 | 0.0 | 3 | 0 | 0 | 0 | 0 | 0 | 8 |
| Nov 1 | @ MIL | W 136-111 | 6 | 0-3 | 0.0 | 0-2 | 0.0 | 0-0 | 0.0 | 3 | 0 | 0 | 0 | 0 | 0 | 0 |
06 / 2026-27 HOME / AWAY, RESULTS, MONTHS AND OPPONENTS
Splits
split
| Split | GP | MIN | FG | FG% | 3PT | 3P% | FT | FT% | OR | DR | REB | AST | BLK | STL | PF | TO | PTS |
|---|---|---|---|---|---|---|---|---|---|---|---|---|---|---|---|---|---|
| All Splits | 4 | 13.8 | 1.3-4.3 | 29.4 | 0.5-2.8 | 18.2 | 0.0-0.0 | 0.0 | 1.0 | 1.0 | 2.0 | 0.0 | 0.0 | 0.0 | 1.3 | 0.0 | 3.0 |
| Home | 2 | 16.0 | 2.0-5.0 | 40.0 | 1.0-3.0 | 33.3 | 0.0-0.0 | 0.0 | 0.5 | 1.0 | 1.5 | 0.0 | 0.0 | 0.0 | 2.0 | 0.0 | 5.0 |
| Road | 2 | 11.0 | 0.5-3.5 | 14.3 | 0.0-2.5 | 0.0 | 0.0-0.0 | 0.0 | 1.5 | 1.0 | 2.5 | 0.0 | 0.0 | 0.0 | 0.5 | 0.0 | 1.0 |
| vs. Division | 1 | 6.0 | 0.0-3.0 | 0.0 | 0.0-2.0 | 0.0 | 0.0-0.0 | 0.0 | 3.0 | 0.0 | 3.0 | 0.0 | 0.0 | 0.0 | 0.0 | 0.0 | 0.0 |
| vs. Conference | 3 | 11.0 | 1.3-3.7 | 36.4 | 0.7-2.7 | 25.0 | 0.0-0.0 | 0.0 | 1.3 | 1.3 | 2.7 | 0.0 | 0.0 | 0.0 | 0.3 | 0.0 | 3.3 |
| 3+ Days Rest | 3 | 12.7 | 1.3-4.3 | 30.8 | 0.7-2.7 | 25.0 | 0.0-0.0 | 0.0 | 1.3 | 0.7 | 2.0 | 0.0 | 0.0 | 0.0 | 1.3 | 0.0 | 3.3 |
Month
| Split | GP | MIN | FG | FG% | 3PT | 3P% | FT | FT% | OR | DR | REB | AST | BLK | STL | PF | TO | PTS |
|---|---|---|---|---|---|---|---|---|---|---|---|---|---|---|---|---|---|
| October | 1 | 6.0 | 0.0-3.0 | 0.0 | 0.0-2.0 | 0.0 | 0.0-0.0 | 0.0 | 3.0 | 0.0 | 3.0 | 0.0 | 0.0 | 0.0 | 0.0 | 0.0 | 0.0 |
| November | 3 | 16.3 | 1.7-4.7 | 35.7 | 0.7-3.0 | 22.2 | 0.0-0.0 | 0.0 | 0.3 | 1.3 | 1.7 | 0.0 | 0.0 | 0.0 | 1.7 | 0.0 | 4.0 |
| Pre All-Star | 4 | 13.8 | 1.3-4.3 | 29.4 | 0.5-2.8 | 18.2 | 0.0-0.0 | 0.0 | 1.0 | 1.0 | 2.0 | 0.0 | 0.0 | 0.0 | 1.3 | 0.0 | 3.0 |
Result
| Split | GP | MIN | FG | FG% | 3PT | 3P% | FT | FT% | OR | DR | REB | AST | BLK | STL | PF | TO | PTS |
|---|---|---|---|---|---|---|---|---|---|---|---|---|---|---|---|---|---|
| Wins | 2 | 14.0 | 0.5-4.5 | 11.1 | 0.0-2.5 | 0.0 | 0.0-0.0 | 0.0 | 1.5 | 0.0 | 1.5 | 0.0 | 0.0 | 0.0 | 2.0 | 0.0 | 1.0 |
| Losses | 2 | 13.5 | 2.0-4.0 | 50.0 | 1.0-3.0 | 33.3 | 0.0-0.0 | 0.0 | 0.5 | 2.0 | 2.5 | 0.0 | 0.0 | 0.0 | 0.5 | 0.0 | 5.0 |
Day
| Split | GP | MIN | FG | FG% | 3PT | 3P% | FT | FT% | OR | DR | REB | AST | BLK | STL | PF | TO | PTS |
|---|---|---|---|---|---|---|---|---|---|---|---|---|---|---|---|---|---|
| Monday | 1 | 17.0 | 1.0-4.0 | 25.0 | 0.0-3.0 | 0.0 | 0.0-0.0 | 0.0 | 0.0 | 2.0 | 2.0 | 0.0 | 0.0 | 0.0 | 1.0 | 0.0 | 2.0 |
| Saturday | 3 | 12.7 | 1.3-4.3 | 30.8 | 0.7-2.7 | 25.0 | 0.0-0.0 | 0.0 | 1.3 | 0.7 | 2.0 | 0.0 | 0.0 | 0.0 | 1.3 | 0.0 | 3.3 |
Opponent
| Split | GP | MIN | FG | FG% | 3PT | 3P% | FT | FT% | OR | DR | REB | AST | BLK | STL | PF | TO | PTS |
|---|---|---|---|---|---|---|---|---|---|---|---|---|---|---|---|---|---|
| Charlotte Hornets | 1 | 17.0 | 1.0-4.0 | 25.0 | 0.0-3.0 | 0.0 | 0.0-0.0 | 0.0 | 0.0 | 2.0 | 2.0 | 0.0 | 0.0 | 0.0 | 1.0 | 0.0 | 2.0 |
| Dallas Mavericks | 1 | 22.0 | 1.0-6.0 | 16.7 | 0.0-3.0 | 0.0 | 0.0-0.0 | 0.0 | 0.0 | 0.0 | 0.0 | 0.0 | 0.0 | 0.0 | 4.0 | 0.0 | 2.0 |
| Milwaukee Bucks | 1 | 6.0 | 0.0-3.0 | 0.0 | 0.0-2.0 | 0.0 | 0.0-0.0 | 0.0 | 3.0 | 0.0 | 3.0 | 0.0 | 0.0 | 0.0 | 0.0 | 0.0 | 0.0 |
| New York Knicks | 1 | 10.0 | 3.0-4.0 | 75.0 | 2.0-3.0 | 66.7 | 0.0-0.0 | 0.0 | 1.0 | 2.0 | 3.0 | 0.0 | 0.0 | 0.0 | 0.0 | 0.0 | 8.0 |
07 / SEASON-BY-SEASON HISTORY
Career statistics
Regular Season Averages
| Season | Team | GP | GS | MIN | FG | FG% | 3PT | 3P% | FT | FT% | OR | DR | REB | AST | BLK | STL | PF | TO | PTS |
|---|---|---|---|---|---|---|---|---|---|---|---|---|---|---|---|---|---|---|---|
| 2024-25 | San Antonio Spurs | 1 | 0 | 7.0 | 0.0-1.0 | 0.0 | 0.0-1.0 | 0.0 | 0.0-0.0 | 0.0 | 0.0 | 2.0 | 2.0 | 0.0 | 0.0 | 0.0 | 0.0 | 0.0 | 0.0 |
| 2025-26 | San Antonio Spurs | 3 | 0 | 2.7 | 1.3-2.0 | 66.7 | 0.3-1.0 | 33.3 | 0.0-0.0 | 0.0 | 0.3 | 0.3 | 0.7 | 0.3 | 0.0 | 0.3 | 0.3 | 0.0 | 3.0 |
| 2025-26 | Cleveland Cavaliers | 6 | 0 | 8.3 | 1.7-2.8 | 58.8 | 0.5-1.5 | 33.3 | 0.5-0.5 | 100.0 | 0.2 | 0.5 | 0.7 | 0.7 | 0.2 | 0.2 | 0.7 | 0.5 | 4.3 |
| 2025-26 | 2025 26 Totals | 9 | 0 | 6.4 | 1.6-2.6 | 60.9 | 0.4-1.3 | 33.3 | 0.3-0.3 | 100.0 | 0.2 | 0.4 | 0.7 | 0.6 | 0.1 | 0.2 | 0.6 | 0.3 | 3.9 |
| 2026-27 | Cleveland Cavaliers | 4 | 0 | 13.8 | 1.3-4.3 | 29.4 | 0.5-2.8 | 18.2 | 0.0-0.0 | 0.0 | 1.0 | 1.0 | 2.0 | 0.0 | 0.0 | 0.0 | 1.3 | 0.0 | 3.0 |
| Career | — | 14 | 0 | 8.6 | 1.4-2.9 | 46.3 | 0.4-1.7 | 25.0 | 0.2-0.2 | 100.0 | 0.4 | 0.7 | 1.1 | 0.4 | 0.1 | 0.1 | 0.7 | 0.2 | 3.4 |
Regular Season Totals
| Season | Team | FG | FG% | 3PT | 3P% | FT | FT% | OR | DR | REB | AST | BLK | STL | PF | TO | PTS |
|---|---|---|---|---|---|---|---|---|---|---|---|---|---|---|---|---|
| 2024-25 | San Antonio Spurs | 0-1 | 0.0 | 0-1 | 0.0 | 0-0 | 0.0 | 0 | 2 | 2 | 0 | 0 | 0 | 0 | 0 | 0 |
| 2025-26 | San Antonio Spurs | 4-6 | 66.7 | 1-3 | 33.3 | 0-0 | 0.0 | 1 | 1 | 2 | 1 | 0 | 1 | 1 | 0 | 9 |
| 2025-26 | Cleveland Cavaliers | 10-17 | 58.8 | 3-9 | 33.3 | 3-3 | 100.0 | 1 | 3 | 4 | 4 | 1 | 1 | 4 | 3 | 26 |
| 2025-26 | 2025 26 Totals | 14-23 | 60.9 | 4-12 | 33.3 | 3-3 | 100.0 | 2 | 4 | 6 | 5 | 1 | 2 | 5 | 3 | 35 |
| 2026-27 | Cleveland Cavaliers | 5-17 | 29.4 | 2-11 | 18.2 | 0-0 | 0.0 | 4 | 4 | 8 | 0 | 0 | 0 | 5 | 0 | 12 |
| Career | — | 19-41 | 46.3 | 6-24 | 25.0 | 3-3 | 100.0 | 6 | 10 | 16 | 5 | 1 | 2 | 10 | 3 | 47 |
Regular Season Misc Totals
| Season | Team | DD2 | TD3 | DQ | EJECT | TECH | FLAG | AST/TO | STL/TO | SC-EFF | SH-EFF |
|---|---|---|---|---|---|---|---|---|---|---|---|
| 2025-26 | San Antonio Spurs | 0 | 0 | 0 | 0 | 0 | 0 | INF | INF | 1.500 | 0.75 |
| 2025-26 | Cleveland Cavaliers | 0 | 0 | 0 | 0 | 0 | 0 | 1.3 | 0.3 | 1.529 | 0.68 |
| 2025-26 | 2025 26 Totals | 0 | 0 | 0 | 0 | 0 | 0 | 1.7 | 0.7 | 1.522 | 0.70 |
| 2026-27 | Cleveland Cavaliers | 0 | 0 | 0 | 0 | 0 | 0 | 0.0 | 0.0 | 0.706 | 0.35 |
| Career | — | 0 | 0 | 0 | 0 | 0 | 0 | 1.7 | 0.7 | 1.146 | 0.54 |
Scoring, rebounding and assist trend
08 / SHOT CHART AND ZONE SHOOTING
Shot profile
Shot-location data is not connected. Add a BALLDONTLIE GOAT-tier NBA API key in NBA Players → Settings to enable shot charts and zone shooting.
09 / RECORD, TEAM STATS AND TEAMMATES
Team
Overall8-7
Home6-2
Road2-5
DIV2-0
CONF6-5
Last Ten Games5-5
Team records for 2026-27 (regular season).
Team statistics 2026-27
Defensive
| Metric | Total | Per game | NBA rank |
|---|---|---|---|
| Blocks | 78 | 5.2 | 1st |
| Defensive Rebounds | 524 | 34.933 | 1st |
| Steals | 113 | 7.533 | Tied-1st |
| Points Conceded Off Turnovers | 0 | 16 | — |
| Defensive Rebound Rate | 0.0 | — | — |
| Defensive Rebounds Per Game | 34.9 | — | — |
| Blocks Per Game | 5.2 | — | — |
| Steals Per Game | 7.5 | — | — |
| Defensive Rebounds Per 48 | 0.0 | — | — |
| Blocks Per 48 | 0.0 | — | — |
| Steals Per 48 | 0.0 | — | — |
General
| Metric | Total | Per game | NBA rank |
|---|---|---|---|
| Disqualifications | 2 | — | Tied-2nd |
| Flagrant Fouls | 0 | — | — |
| Fouls | 324 | 21.6 | 1st |
| Rebound Rate | 52.2 | — | 1st |
| Ejections | 0 | — | — |
| Technical Fouls | 4 | 0.133 | 5th |
| Rebounds | 689 | 45.933 | — |
| Minutes | 0 | — | — |
| Minutes Per Game | 0.0 | — | — |
| Fantasy Rating | 0.0 | — | — |
| Rating | 220.2 | — | 2nd |
| Plus-Minus | -1 | -1 | Tied-1st |
| Game Day of Year | 0 | — | — |
| Rebounds Per Game | 45.9 | — | — |
| Fouls Per Game | 21.6 | — | — |
| Flagrant Fouls Per Game | 0.0 | — | — |
| Technical Fouls Per Game | 0.3 | — | — |
| Ejections Per Game | 0.0 | — | — |
| Disqualifications Per Game | 0.1 | — | — |
| Assist To Turnover Ratio | 2.0 | 2.05 | — |
| Steal To Foul Ratio | 0.3 | 0.349 | — |
| Block To Foul Ratio | 0.2 | 0.241 | — |
| Team Rebounds Per Game | 0.0 | — | — |
| Rebounds | 689 | 45.933 | — |
| Total Technical Fouls | 4 | 0.133 | — |
| Assist To Turnover Ratio | 45.8 | — | — |
| Team Rebounds | 0 | — | — |
| Steal To Turnover Ratio | 0.6 | 0.562 | — |
| Rebounds Per 48 Minutes | 0.0 | — | — |
| Fouls Per 48 Minutes | 0.0 | — | — |
| Flagrant Fouls Per 48 Minutes | 0.0 | — | — |
| Technical Fouls Per 48 Minutes | 0.0 | — | — |
| Ejections Per 48 Minutes | 0.0 | — | — |
| Disqualifications Per 48 Minutes | 0.0 | — | — |
| Games Played | 15 | — | 1st |
| Games Started | 0 | — | — |
| Double Double | 0 | — | — |
| Triple Double | 0 | — | — |
Offensive
| Metric | Total | Per game | NBA rank |
|---|---|---|---|
| Assists | 412 | 27.467 | 1st |
| Effective Field Goal Percentage | 55.9 | — | 1st |
| Field Goals | 636/1339 | 0.475 | — |
| Field Goals Attempted | 1339 | 89.267 | 1st |
| Field Goals Made | 636 | 42.4 | 1st |
| Field Goal Percentage | 47.5 | 0.475 | 1st |
| Free Throws | 273/361 | 0.756 | — |
| Free Throw Percentage | 75.6 | 0.756 | 4th |
| Free Throws Attempted | 361 | 24.067 | 2nd |
| Free Throws Made | 273 | 18.2 | 2nd |
| Offensive Rebounds | 165 | 11 | 2nd |
| Points | 1771 | 118.067 | 1st |
| Turnovers | 201 | 13.4 | 3rd |
| 3-Point Field Goal Percentage | 36.7 | 0.367 | 1st |
| 3-Point Field Goals Attempted | 616 | 41.067 | Tied-1st |
| 3-Point Field Goals Made | 226 | 15.067 | 1st |
| True Shooting Percentage | 59.1 | — | 1st |
| Team Turnovers | 9 | — | 3rd |
| Total Turnovers | 210 | 13.4 | — |
| Assist Ratio | 19.4 | — | 3rd |
| Points in the Paint | 706 | 47 | 2nd |
| Offensive Rebound Rate | 26.7 | — | 4th |
| Turnover Ratio | 12.3 | — | 5th |
| Fast Break Points | 210 | — | — |
| Possessions | 1543 | — | 1st |
| Pace Factor | 98.7 | — | 5th |
| Average Field Goals Made | 42.4 | — | — |
| Average Field Goals Attempted | 89.3 | — | — |
| Average 3-Point Field Goals Made | 15.1 | — | — |
| Average 3-Point Field Goals Attempted | 41.1 | — | — |
| Average Free Throws Made | 18.2 | — | — |
| Average Free Throws Attempted | 24.1 | — | — |
| Points Per Game | 118.1 | — | — |
| Offensive Rebounds Per Game | 11.0 | — | — |
| Assists Per Game | 27.5 | — | — |
| Turnovers Per Game | 13.4 | — | — |
| Offensive Rebound Percentage | 0.2 | 0.235 | — |
| Estimated Possessions | 1528.4 | 101.294 | — |
| Estimated Possessions Per Game | 101.9 | — | — |
| Points Per Estimated Possession | 1.2 | 1.166 | — |
| Team Turnovers Per Game | 0.6 | — | — |
| Total Turnovers Per Game | 14.0 | — | — |
| 3-Point Field Goal Percentage | 36.7 | 0.367 | — |
| 2-Point Field Goals Made | 410.0 | 27.333 | — |
| 2-Point Field Goals Attempted | 723.0 | 48.2 | 2nd |
| 2-Point Field Goals Made per Game | 27.3 | — | — |
| 2-Point Field Goals Attempted per Game | 48.2 | — | — |
| 2-Point Field Goal Percentage | 56.7 | 0.567 | — |
| Shooting Efficiency | 0.56 | 0.559 | — |
| Scoring Efficiency | 1.323 | 1.323 | — |
| Fieldgoals Made Per 48 | 0.0 | — | — |
| Fieldgoals Attempted Per 48 | 0.0 | — | — |
| 3-Point Fieldgoals Made Per 48 | 0.0 | — | — |
| 3-Point Fieldgoals Attempted Per 48 | 0.0 | — | — |
| Freethrows Made Per 48 | 0.0 | — | — |
| Freethrows Attempted Per 48 | 0.0 | — | — |
| Points Scored Per 48 | 0.0 | — | — |
| Offensive Rebounds Per 48 | 0.0 | — | — |
| Assists Per 48 | 0.0 | — | — |
| Turnovers | 0.0 | — | — |
Teammates
 Craig Porter Jr.G #9
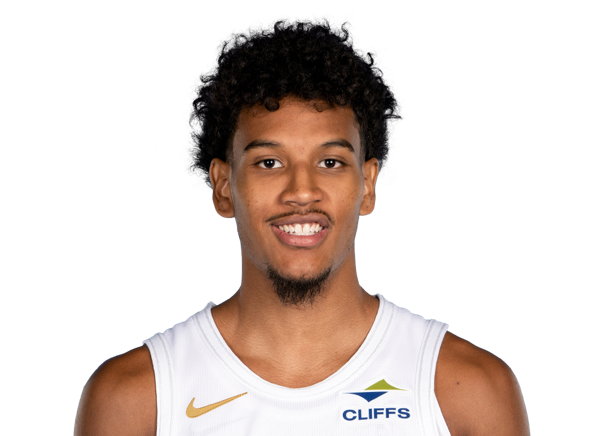 Curtis JonesG #14
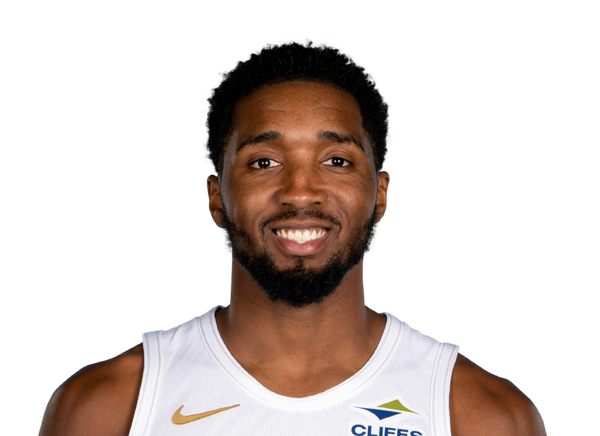 Donovan MitchellG #45
 Ernest Udeh Jr.C #88
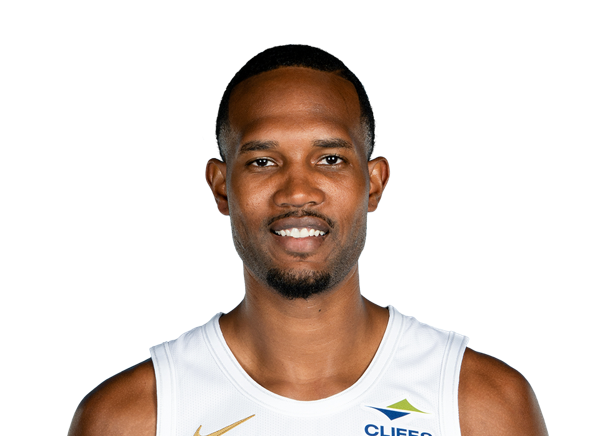 Evan MobleyC #4
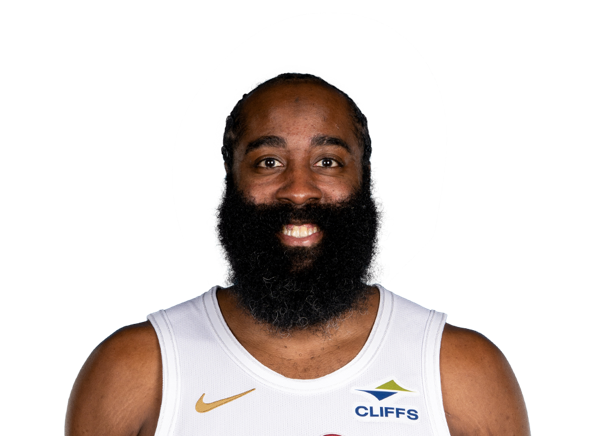 James HardenG #1
 Jarrett AllenC #31
 Jaxson RobinsonF #2
 Jaylon TysonG #20
 Kadary RichmondG #16
 Khalifa DiopC #18
 Luke TraversF #33
 Mario HezonjaF #33
 Meleek ThomasG #15
 Nae’Qwan TomlinF #35
 Norchad OmierC #77
 Olivier SarrF #33
 Peyton WatsonG #8
 Rashaun AgeeF #19
 Sam MerrillG #5
 Thomas BryantC #3
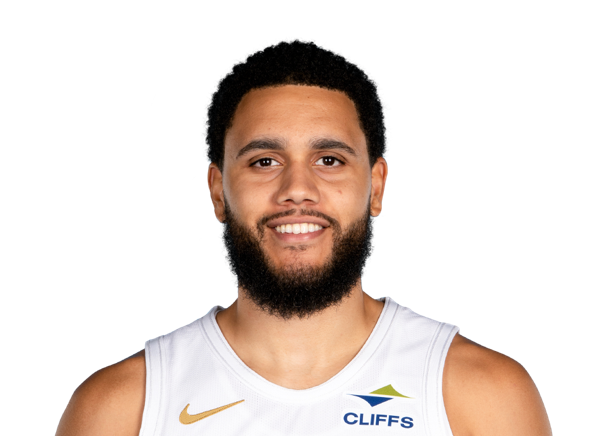 Tristan EnarunaF #21
 Tyrese ProctorG #24
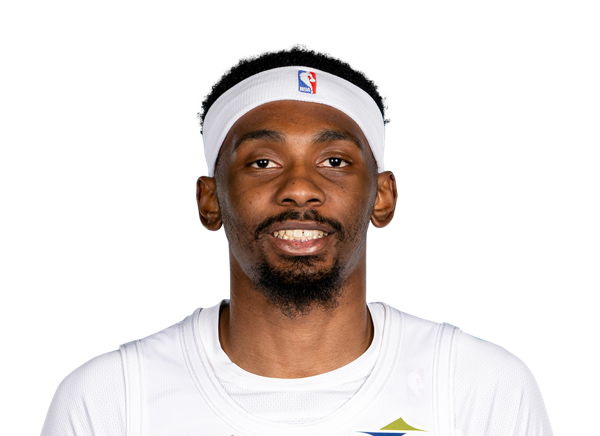 Zack AustinF #55
10 / SALARY BY SEASON
Contract
No contract is on file for this player yet.
11 / LATEST REPORT
Injury status
No current injury report entry for this player.
12 / SIGNINGS, TRADES AND ROSTER MOVES
Transactions
- Signed F Norchad Omier to a two-way contract. Waived F Riley Minix.
13 / LATEST COVERAGE
Player news
LATEST UPDATEMinix signed a two-way contract with the Cavs on Saturday.
Minix will return to the Cavs on a two-way deal after getting waived Thursday. He's made one appearance for Cleveland this season, finishing with three rebounds across six minutes.
18 July 2026Thomas scores 24 as Cavs top Bulls in teams' summer finale↗
16 July 2026New Orleans Pelicans vs. Cleveland Cavaliers: Game Highlights↗
11 July 2026Pacers withstand Cavs rally to win their summer league opener↗
31 March 2026Brooks Jr.'s double-double leads Boom past Charge 134-112↗
11 March 2026Brown records first career triple-double, Branham scores 24 as Charge defeat Go-Go↗
27 February 2026Enaruna sparks Charge's rout of Magic↗
26 February 2026Hayes scores 18 in second half as Charge hold off Boom↗
5 February 2026Hayes' double-double powers Charge to high-scoring win over Skyhawks↗
14 / BIO, DRAFT AND CONTACT DETAILS
Biography & profile
TeamCleveland Cavaliers
PositionForward
Jersey12
Height6' 7"
Weight230 lbs
Age26
Date of birthSep 22, 2000
BirthplaceVero Beach, FL, USA
CollegeMorehead State
Experience3 yrs
StatusActive