Click a season to open this player’s full game log, splits and advanced stats for that year; click a team to open its page. A dash means no NBA games were recorded.
03 / EVERY CATEGORY THE PROVIDER REPORTS
Full statistical breakdown
Regular season 2026-27
Defensive
Metric
Total
NBA rank
Blocks
1
Tied-292nd
Defensive Rebounds
38
Tied-129th
Steals
8
Tied-174th
Defensive Rebound Rate
0.0
—
Defensive Rebounds Per Game
2.7
Tied-156th
Blocks Per Game
0.1
Tied-263rd
Steals Per Game
0.6
189th
Defensive Rebounds Per 48
6.6
2,064th
Blocks Per 48
0.2
4,672nd
Steals Per 48
1.4
2,784th
General
Metric
Total
NBA rank
Disqualifications
0
Tied-22nd
Flagrant Fouls
0
Tied-24th
Fouls
28
Tied-130th
Player Efficiency Rating
18.73
59th
Rebound Rate
0.0
—
Ejections
0
Tied-7th
Technical Fouls
0
Tied-104th
Rebounds
49
—
Value Over Replacement Player
32.9
—
Minutes
278
Tied-3rd
Minutes Per Game
19.9
—
Rating
19.2
Tied-43rd
Plus-Minus
+13
Tied-1st
Rebounds Per Game
3.5
Tied-159th
Fouls Per Game
2.0
Tied-160th
Flagrant Fouls Per Game
0.0
Tied-21st
Technical Fouls Per Game
0.0
Tied-84th
Ejections Per Game
0.0
Tied-6th
Disqualifications Per Game
0.0
Tied-21st
Assist To Turnover Ratio
3.9
—
Steal To Foul Ratio
0.3
—
Block To Foul Ratio
0.0
—
Team Rebounds Per Game
0.0
—
Rebounds
49
—
Total Technical Fouls
0
—
Assist To Turnover Ratio
0.0
—
Steal To Turnover Ratio
0.8
—
Rebounds Per 48 Minutes
8.5
—
Fouls Per 48 Minutes
4.8
2,080th
Flagrant Fouls Per 48 Minutes
0.0
384th
Technical Fouls Per 48 Minutes
0.0
1,664th
Ejections Per 48 Minutes
0.0
112th
Disqualifications Per 48 Minutes
0.0
352nd
R/40
7.1
—
Games Played
14
14th
Games Started
3
Tied-181st
Double Double
1
Tied-68th
Triple Double
1
Tied-3rd
Offensive
Metric
Total
NBA rank
Assists
39
Tied-93rd
Effective Field Goal Percentage
65.1
—
Field Goals
50/96
—
Field Goals Attempted
96
Tied-157th
Field Goals Made
50
Tied-123rd
Field Goal Percentage
52.1
—
Free Throws
13/18
—
Free Throw Percentage
72.2
Tied-191st
Free Throws Attempted
18
Tied-193rd
Free Throws Made
13
Tied-194th
Offensive Rebounds
11
Tied-156th
Points
138
125th
Turnovers
10
Tied-221st
3-Point Field Goal Percentage
45.5
Tied-30th
3-Point Field Goals Attempted
55
Tied-111th
3-Point Field Goals Made
25
Tied-69th
True Shooting Percentage
66.4
—
Total Turnovers
10
—
Assist Ratio
25.5
—
Points in the Paint
0
Tied-1st
Offensive Rebound Rate
0.0
—
Turnover Ratio
6.5
—
Brick Index
0.00
—
Usage Rate
0.0
—
Average Field Goals Made
3.6
—
Average Field Goals Attempted
6.9
275th
Average 3-Point Field Goals Made
1.8
Tied-95th
Average 3-Point Field Goals Attempted
3.9
Tied-128th
Average Free Throws Made
0.9
—
Average Free Throws Attempted
1.3
Tied-193rd
Points Per Game
9.9
145th
Offensive Rebounds Per Game
0.8
Tied-167th
Assists Per Game
2.8
Tied-102nd
Turnovers Per Game
0.7
220th
Offensive Rebound Percentage
0.2
—
Estimated Possessions
102.2
—
Estimated Possessions Per Game
7.3
—
Points Per Estimated Possession
1.4
—
Team Turnovers Per Game
0.0
—
Total Turnovers Per Game
0.7
—
3-Point Field Goal Percentage
45.5
—
2-Point Field Goals Made
25.0
Tied-54th
2-Point Field Goals Attempted
41.0
Tied-46th
2-Point Field Goals Made per Game
1.8
—
2-Point Field Goals Attempted per Game
2.9
—
2-Point Field Goal Percentage
61.0
—
Shooting Efficiency
0.65
—
Scoring Efficiency
1.438
—
Fieldgoals Made Per 48
8.6
1,968th
Fieldgoals Attempted Per 48
16.6
2,512th
3-Point Fieldgoals Made Per 48
4.3
1,104th
3-Point Fieldgoals Attempted Per 48
9.5
1,776th
Freethrows Made Per 48
2.2
3,104th
Freethrows Attempted Per 48
3.1
3,088th
Points Scored Per 48
23.8
Tied-2,000th
Offensive Rebounds Per 48
1.9
2,496th
Assists Per 48
6.7
1,488th
Turnovers
1.7
3,536th
P/40
19.9
—
A/40
5.6
—
04 / EFFICIENCY, SHOOTING PROFILE, PER-36
Advanced metrics
True shooting %66.2%
Effective FG %65.2%
2-point FG %60.0%
3-point attempt rate56.5%
Free throw rate18.8%
Points per shot attempt1.43
% of points from 3s54.5%
Assist-to-turnover4.00
Points per 36 min17.9
Rebounds per 36 min6.3
Assists per 36 min5.1
Steals per 36 min1.09
Blocks per 36 min0.18
Turnovers per 36 min1.27
Stocks (STL + BLK) per game0.70
Pts + Reb + Ast per game16.2
Efficiency (EFF) per game12.5
Game Score per game (Hollinger)8.8
Minutes per game19.9
Calculated by BallersCulture from the supplied 2026-27 box-score totals using standard formulas (hover a tile to see the formula). Tracking-based metrics such as BPM, VORP, on/off and RAPTOR are not available from this data source.
05 / 14 GAMES IN 2026-27
Game log: Regular season
Date
Opp
Result
MIN
FG
FG%
3PT
3P%
FT
FT%
REB
AST
BLK
STL
PF
TO
PTS
Nov 17
vs CHI
W 126-115
29
6-13
46.2
2-6
33.3
3-5
60.0
3
2
1
2
3
4
17
Nov 15
vs DAL
W 127-117
34
10-19
52.6
4-13
30.8
0-0
0.0
11
10
0
0
2
1
24
Nov 14
@ MIA
L 133-121
27
7-9
77.8
5-7
71.4
3-4
75.0
4
3
0
1
4
0
22
Nov 12
@ NY
W 115-107
23
6-12
50.0
3-8
37.5
0-0
0.0
3
1
0
0
2
1
15
Nov 10
@ CHA
L 124-112
23
2-4
50.0
0-1
0.0
2-3
66.7
1
4
0
1
3
1
6
Nov 8
vs NY
L 109-97
23
2-5
40.0
2-4
50.0
1-2
50.0
3
3
0
0
1
0
7
Nov 7
vs PHI
W 119-95
19
1-4
25.0
0-1
0.0
1-1
100.0
6
3
0
2
2
1
3
Nov 5
@ OKC
L 124-116
22
4-7
57.1
2-3
66.7
1-1
100.0
1
0
0
0
3
0
11
Nov 3
vs OKC
L 117-112
19
3-4
75.0
2-3
66.7
2-2
100.0
4
2
0
0
2
1
10
Nov 1
@ MIL
W 136-111
18
3-9
33.3
3-5
60.0
0-0
0.0
4
5
0
1
2
0
9
Oct 30
@ ATL
L 114-111
20
3-5
60.0
1-2
50.0
0-0
0.0
6
2
0
0
1
0
7
Oct 29
vs WSH
W 121-111
6
1-1
100.0
0-0
0.0
0-0
0.0
1
1
0
0
0
0
2
Oct 25
vs BKN
W 125-121
11
2-3
66.7
1-2
50.0
0-0
0.0
2
3
0
1
1
1
5
Oct 23
@ PHI
L 114-106
5
0-1
0.0
0-0
0.0
0-0
0.0
0
0
0
0
2
0
0
06 / 2026-27 HOME / AWAY, RESULTS, MONTHS AND OPPONENTS
Splits
split
Split
GP
MIN
FG
FG%
3PT
3P%
FT
FT%
OR
DR
REB
AST
BLK
STL
PF
TO
PTS
All Splits
14
19.9
3.6-6.9
52.1
1.8-3.9
45.5
0.9-1.3
72.2
0.8
2.7
3.5
2.8
0.1
0.6
2.0
0.7
9.9
Home
7
20.1
3.6-7.0
51.0
1.6-4.1
37.9
1.0-1.4
70.0
1.3
3.0
4.3
3.4
0.1
0.7
1.6
1.1
9.7
Road
7
19.6
3.6-6.7
53.2
2.0-3.7
53.8
0.9-1.1
75.0
0.3
2.4
2.7
2.1
0.0
0.4
2.4
0.3
10.0
vs. Division
2
23.5
4.5-11.0
40.9
2.5-5.5
45.5
1.5-2.5
60.0
0.0
3.5
3.5
3.5
0.5
1.5
2.5
2.0
13.0
vs. Conference
11
18.5
3.0-6.0
50.0
1.5-3.3
47.2
0.9-1.4
66.7
0.6
2.4
3.0
2.5
0.1
0.7
1.9
0.7
8.5
3+ Days Rest
2
5.5
0.5-1.0
50.0
0.0-0.0
0.0
0.0-0.0
0.0
0.5
0.0
0.5
0.5
0.0
0.0
1.0
0.0
1.0
Month
Split
GP
MIN
FG
FG%
3PT
3P%
FT
FT%
OR
DR
REB
AST
BLK
STL
PF
TO
PTS
October
5
12.0
1.8-3.8
47.4
1.0-1.8
55.6
0.0-0.0
0.0
0.4
2.2
2.6
2.2
0.0
0.4
1.2
0.2
4.6
November
9
24.2
4.6-8.6
53.2
2.2-5.1
43.5
1.4-2.0
72.2
1.0
3.0
4.0
3.1
0.1
0.7
2.4
1.0
12.8
Pre All-Star
14
19.9
3.6-6.9
52.1
1.8-3.9
45.5
0.9-1.3
72.2
0.8
2.7
3.5
2.8
0.1
0.6
2.0
0.7
9.9
Result
Split
GP
MIN
FG
FG%
3PT
3P%
FT
FT%
OR
DR
REB
AST
BLK
STL
PF
TO
PTS
Wins
7
20.0
4.1-8.7
47.5
1.9-5.0
37.1
0.6-0.9
66.7
1.3
3.0
4.3
3.6
0.1
0.9
1.7
1.1
10.7
Losses
7
19.6
3.0-5.0
60.0
1.7-2.9
60.0
1.3-1.7
75.0
0.3
2.4
2.7
2.0
0.0
0.3
2.3
0.3
9.0
Position
Split
GP
MIN
FG
FG%
3PT
3P%
FT
FT%
OR
DR
REB
AST
BLK
STL
PF
TO
PTS
As Starter
3
28.3
6.7-13.0
51.3
2.7-7.3
36.4
1.3-2.0
66.7
1.3
3.7
5.0
4.0
0.3
0.7
2.7
1.7
17.3
Day
Split
GP
MIN
FG
FG%
3PT
3P%
FT
FT%
OR
DR
REB
AST
BLK
STL
PF
TO
PTS
Monday
3
23.3
3.7-7.0
52.4
1.3-3.3
40.0
2.3-3.3
70.0
0.0
2.7
2.7
2.7
0.3
1.0
2.7
2.0
11.0
Wednesday
3
17.0
3.7-6.7
55.0
1.7-3.7
45.5
0.3-0.3
100.0
0.3
1.3
1.7
0.7
0.0
0.0
1.7
0.3
9.3
Thursday
2
12.0
1.5-3.0
50.0
0.5-1.0
50.0
0.0-0.0
0.0
0.5
2.5
3.0
1.0
0.0
0.0
1.5
0.0
3.5
Friday
2
23.5
4.0-6.5
61.5
2.5-4.0
62.5
2.0-2.5
80.0
2.5
2.5
5.0
3.0
0.0
1.5
3.0
0.5
12.5
Saturday
4
21.5
4.3-9.0
47.2
2.5-6.0
41.7
0.3-0.5
50.0
1.0
4.0
5.0
5.3
0.0
0.5
1.5
0.5
11.3
Opponent
Split
GP
MIN
FG
FG%
3PT
3P%
FT
FT%
OR
DR
REB
AST
BLK
STL
PF
TO
PTS
Atlanta Hawks
1
20.0
3.0-5.0
60.0
1.0-2.0
50.0
0.0-0.0
0.0
1.0
5.0
6.0
2.0
0.0
0.0
1.0
0.0
7.0
Brooklyn Nets
1
11.0
2.0-3.0
66.7
1.0-2.0
50.0
0.0-0.0
0.0
0.0
2.0
2.0
3.0
0.0
1.0
1.0
1.0
5.0
Charlotte Hornets
1
23.0
2.0-4.0
50.0
0.0-1.0
0.0
2.0-3.0
66.7
0.0
1.0
1.0
4.0
0.0
1.0
3.0
1.0
6.0
Chicago Bulls
1
29.0
6.0-13.0
46.2
2.0-6.0
33.3
3.0-5.0
60.0
0.0
3.0
3.0
2.0
1.0
2.0
3.0
4.0
17.0
Dallas Mavericks
1
34.0
10.0-19.0
52.6
4.0-13.0
30.8
0.0-0.0
0.0
4.0
7.0
11.0
10.0
0.0
0.0
2.0
1.0
24.0
Miami Heat
1
27.0
7.0-9.0
77.8
5.0-7.0
71.4
3.0-4.0
75.0
1.0
3.0
4.0
3.0
0.0
1.0
4.0
0.0
22.0
Milwaukee Bucks
1
18.0
3.0-9.0
33.3
3.0-5.0
60.0
0.0-0.0
0.0
0.0
4.0
4.0
5.0
0.0
1.0
2.0
0.0
9.0
New York Knicks
2
22.5
4.0-8.5
47.1
2.5-6.0
41.7
0.5-1.0
50.0
0.0
3.0
3.0
2.0
0.0
0.0
1.5
0.5
11.0
Philadelphia 76ers
2
12.0
0.5-2.5
20.0
0.0-0.5
0.0
0.5-0.5
100.0
2.0
1.0
3.0
1.5
0.0
1.0
2.0
0.5
1.5
Oklahoma City Thunder
2
20.0
3.5-5.5
63.6
2.0-3.0
66.7
1.5-1.5
100.0
0.0
2.5
2.5
1.0
0.0
0.0
2.5
0.5
10.5
Washington Wizards
1
6.0
1.0-1.0
100.0
0.0-0.0
0.0
0.0-0.0
0.0
1.0
0.0
1.0
1.0
0.0
0.0
0.0
0.0
2.0
07 / SEASON-BY-SEASON HISTORY
Career statistics
Regular Season Averages
Season
Team
GP
GS
MIN
FG
FG%
3PT
3P%
FT
FT%
OR
DR
REB
AST
BLK
STL
PF
TO
PTS
2025-26
Cleveland Cavaliers
50
1
10.9
1.9-4.5
41.3
0.9-2.6
35.1
0.8-0.9
88.9
0.2
1.1
1.3
1.5
0.0
0.5
1.2
0.8
5.4
2026-27
Cleveland Cavaliers
14
3
19.9
3.6-6.9
52.1
1.8-3.9
45.5
0.9-1.3
72.2
0.8
2.7
3.5
2.8
0.1
0.6
2.0
0.7
9.9
Career
—
64
4
12.9
2.2-5.0
44.5
1.1-2.9
38.2
0.8-1.0
84.1
0.3
1.4
1.8
1.8
0.0
0.5
1.4
0.8
6.4
Regular Season Totals
Season
Team
FG
FG%
3PT
3P%
FT
FT%
OR
DR
REB
AST
BLK
STL
PF
TO
PTS
2025-26
Cleveland Cavaliers
93-225
41.3
46-131
35.1
40-45
88.9
11
53
64
74
0
25
59
40
272
2026-27
Cleveland Cavaliers
50-96
52.1
25-55
45.5
13-18
72.2
11
38
49
39
1
8
28
10
138
Career
—
143-321
44.5
71-186
38.2
53-63
84.1
22
91
113
113
1
33
87
50
410
Regular Season Misc Totals
Season
Team
DD2
TD3
DQ
EJECT
TECH
FLAG
AST/TO
STL/TO
SC-EFF
SH-EFF
2025-26
Cleveland Cavaliers
1
0
0
0
0
0
1.9
0.6
1.209
0.52
2026-27
Cleveland Cavaliers
1
1
0
0
0
0
3.9
0.8
1.438
0.65
Career
—
2
1
0
0
0
0
2.3
0.7
1.277
0.56
Scoring, rebounding and assist trend
08 / SHOT CHART AND ZONE SHOOTING
Shot profile
Shot-location data is not connected. Add a BALLDONTLIE GOAT-tier NBA API key in NBA Players → Settings to enable shot charts and zone shooting.
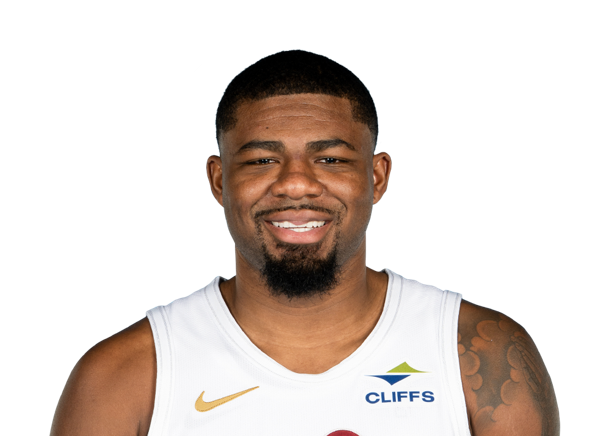
LATEST UPDATEProctor had 17 points (6-13 FG, 2-6 3Pt, 3-5 FT), three rebounds, two assists, two steals and one block over 29 minutes during Monday's 126-115 victory over the Bulls.
After dropping a triple-double in Saturday's win over Dallas, Proctor remained in the starting five Monday in the absences of Evan Mobley (toe) and Jaylon Tyson (ankle). Although he didn't record a triple-double against Chicago, Proctor still contributed in multiple categories while finishing as Cleveland's second-leading scorer. He's logged at least 23 minutes in six consecutive contests, averaging 15.2 points, 4.2 rebounds and 3.8 assists in 26.5 minutes per game during that span.




 Craig Porter Jr.G #9
 Curtis JonesG #14
 Donovan MitchellG #45
 Ernest Udeh Jr.C #88
 Evan MobleyC #4
 James HardenG #1
 Jarrett AllenC #31
 Jaxson RobinsonF #2
 Jaylon TysonG #20
 Kadary RichmondG #16
 Khalifa DiopC #18
 Luke TraversF #33
 Mario HezonjaF #33
 Meleek ThomasG #15
 Nae’Qwan TomlinF #35
 Norchad OmierC #77
 Olivier SarrF #33
 Peyton WatsonG #8
 Rashaun AgeeF #19
 Riley MinixF #12
 Sam MerrillG #5
 Thomas BryantC #3
 Tristan EnarunaF #21
 Zack AustinF #55