

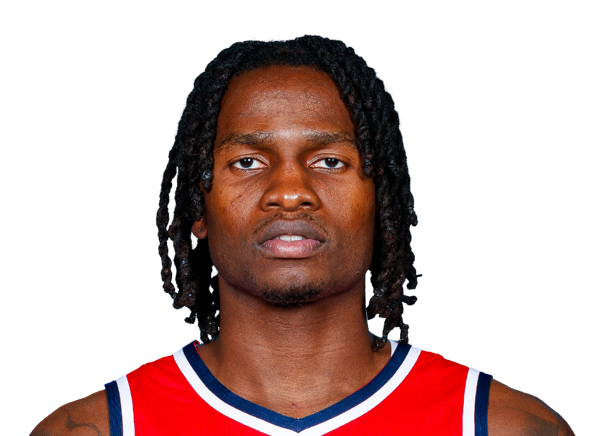
BALLERSCULTURE PLAYER PROFILE · 2026-27
Felix Okpara
Washington Wizards · F • #34 • 6' 11" 237 lbs

01 / 2026-27 PER-GAME AVERAGES
Season snapshot
PTS1.0
REB0.7
AST0.0
STL0.0
BLK0.0
TO0.0
MIN1.7
FG%50.0
3P%0.0
FT%50.0
GP3
GS0
FG0.3-0.7
3PT0.0-0.0
FT0.3-0.7
OR0.0
Per-game averages, regular season 2026-27 (Washington Wizards).
02 / EVERY SEASON SINCE 2022-23, SIDE BY SIDE
2022-23 to 2026-27
Per game
| Season | Team | GP | GS | MIN | PTS | REB | AST | STL | BLK | TO | FG% | 3P% | FT% |
|---|---|---|---|---|---|---|---|---|---|---|---|---|---|
| 2022-23 | — | — | — | — | — | — | — | — | — | — | — | — | — |
| 2023-24 | — | — | — | — | — | — | — | — | — | — | — | — | — |
| 2024-25 | — | — | — | — | — | — | — | — | — | — | — | — | — |
| 2025-26 | — | — | — | — | — | — | — | — | — | — | — | — | — |
| 2026-27 | Washington Wizards | 3 | 0 | 1.7 | 1.0 | 0.7 | 0.0 | 0.0 | 0.0 | 0.0 | 50.0 | 0.0 | 50.0 |
Season totals
| Season | Team | GP | GS | MIN | PTS | REB | AST | STL | BLK | TO | FG% | 3P% | FT% |
|---|---|---|---|---|---|---|---|---|---|---|---|---|---|
| 2022-23 | — | — | — | — | — | — | — | — | — | — | — | — | — |
| 2023-24 | — | — | — | — | — | — | — | — | — | — | — | — | — |
| 2024-25 | — | — | — | — | — | — | — | — | — | — | — | — | — |
| 2025-26 | — | — | — | — | — | — | — | — | — | — | — | — | — |
| 2026-27 | Washington Wizards | — | — | — | 3 | 2 | 0 | 0 | 0 | 0 | 50.0 | 0.0 | 50.0 |
Click a season to open this player’s full game log, splits and advanced stats for that year; click a team to open its page. A dash means no NBA games were recorded.
03 / EVERY CATEGORY THE PROVIDER REPORTS
Full statistical breakdown
Regular season 2026-27
Defensive
| Metric | Total | NBA rank |
|---|---|---|
| Blocks | 0 | Tied-376th |
| Defensive Rebounds | 2 | Tied-408th |
| Steals | 0 | Tied-405th |
| Defensive Rebound Rate | 0.0 | — |
| Defensive Rebounds Per Game | 0.7 | — |
| Blocks Per Game | 0.0 | — |
| Steals Per Game | 0.0 | — |
| Defensive Rebounds Per 48 | 19.2 | 2,448th |
| Blocks Per 48 | 0.0 | 2,256th |
| Steals Per 48 | 0.0 | 2,430th |
General
| Metric | Total | NBA rank |
|---|---|---|
| Disqualifications | 0 | Tied-22nd |
| Flagrant Fouls | 0 | Tied-24th |
| Fouls | 1 | Tied-425th |
| Player Efficiency Rating | 14.70 | — |
| Rebound Rate | 0.0 | — |
| Ejections | 0 | Tied-7th |
| Technical Fouls | 0 | Tied-104th |
| Rebounds | 2 | — |
| Value Over Replacement Player | 0.3 | — |
| Minutes | 5 | Tied-8th |
| Minutes Per Game | 1.7 | — |
| Rating | 1.6 | Tied-798th |
| Plus-Minus | +6 | Tied-1st |
| Rebounds Per Game | 0.7 | — |
| Fouls Per Game | 0.3 | — |
| Flagrant Fouls Per Game | 0.0 | — |
| Technical Fouls Per Game | 0.0 | — |
| Ejections Per Game | 0.0 | — |
| Disqualifications Per Game | 0.0 | — |
| Assist To Turnover Ratio | 0.0 | — |
| Steal To Foul Ratio | 0.0 | — |
| Block To Foul Ratio | 0.0 | — |
| Team Rebounds Per Game | 0.0 | — |
| Rebounds | 2 | — |
| Total Technical Fouls | 0 | — |
| Assist To Turnover Ratio | 0.0 | — |
| Steal To Turnover Ratio | 0.0 | — |
| Rebounds Per 48 Minutes | 19.2 | — |
| Fouls Per 48 Minutes | 9.6 | 2,550th |
| Flagrant Fouls Per 48 Minutes | 0.0 | 144th |
| Technical Fouls Per 48 Minutes | 0.0 | 624th |
| Ejections Per 48 Minutes | 0.0 | 42nd |
| Disqualifications Per 48 Minutes | 0.0 | 132nd |
| R/40 | 16.0 | — |
| Games Played | 3 | 3rd |
| Games Started | 0 | Tied-258th |
| Double Double | 0 | Tied-121st |
| Triple Double | 0 | Tied-13th |
Offensive
| Metric | Total | NBA rank |
|---|---|---|
| Assists | 0 | Tied-434th |
| Effective Field Goal Percentage | 50.0 | — |
| Field Goals | 1/2 | — |
| Field Goals Attempted | 2 | Tied-449th |
| Field Goals Made | 1 | Tied-435th |
| Field Goal Percentage | 50.0 | — |
| Free Throws | 1/2 | — |
| Free Throw Percentage | 50.0 | — |
| Free Throws Attempted | 2 | Tied-374th |
| Free Throws Made | 1 | Tied-391st |
| Offensive Rebounds | 0 | Tied-427th |
| Points | 3 | Tied-438th |
| Turnovers | 0 | Tied-438th |
| 3-Point Field Goal Percentage | 0.0 | — |
| 3-Point Field Goals Attempted | 0 | Tied-421st |
| 3-Point Field Goals Made | 0 | Tied-379th |
| True Shooting Percentage | 52.1 | — |
| Total Turnovers | 0 | — |
| Assist Ratio | 0.0 | — |
| Points in the Paint | 0 | Tied-1st |
| Offensive Rebound Rate | 0.0 | — |
| Turnover Ratio | 0.0 | — |
| Brick Index | 0.00 | — |
| Usage Rate | 0.0 | — |
| Average Field Goals Made | 0.3 | — |
| Average Field Goals Attempted | 0.7 | — |
| Average 3-Point Field Goals Made | 0.0 | — |
| Average 3-Point Field Goals Attempted | 0.0 | — |
| Average Free Throws Made | 0.3 | — |
| Average Free Throws Attempted | 0.7 | — |
| Points Per Game | 1.0 | — |
| Offensive Rebounds Per Game | 0.0 | — |
| Assists Per Game | 0.0 | — |
| Turnovers Per Game | 0.0 | — |
| Offensive Rebound Percentage | 0.0 | — |
| Estimated Possessions | 2.8 | — |
| Estimated Possessions Per Game | 0.9 | — |
| Points Per Estimated Possession | 1.1 | — |
| Team Turnovers Per Game | 0.0 | — |
| Total Turnovers Per Game | 0.0 | — |
| 3-Point Field Goal Percentage | 0.0 | — |
| 2-Point Field Goals Made | 1.0 | Tied-56th |
| 2-Point Field Goals Attempted | 2.0 | Tied-28th |
| 2-Point Field Goals Made per Game | 0.3 | — |
| 2-Point Field Goals Attempted per Game | 0.7 | — |
| 2-Point Field Goal Percentage | 50.0 | — |
| Shooting Efficiency | 0.50 | — |
| Scoring Efficiency | 1.500 | — |
| Fieldgoals Made Per 48 | 9.6 | 2,610th |
| Fieldgoals Attempted Per 48 | 19.2 | 2,694th |
| 3-Point Fieldgoals Made Per 48 | 0.0 | 2,274th |
| 3-Point Fieldgoals Attempted Per 48 | 0.0 | 2,526th |
| Freethrows Made Per 48 | 9.6 | 2,346th |
| Freethrows Attempted Per 48 | 19.2 | 2,244th |
| Points Scored Per 48 | 28.8 | 2,628th |
| Offensive Rebounds Per 48 | 0.0 | 2,562nd |
| Assists Per 48 | 0.0 | 2,604th |
| Turnovers | 0.0 | 2,628th |
| P/40 | 24.0 | — |
| A/40 | 0.0 | — |
04 / EFFICIENCY, SHOOTING PROFILE, PER-36
Advanced metrics
True shooting %49.6%
Effective FG %42.9%
2-point FG %42.9%
3-point attempt rate0.0%
Free throw rate100.0%
Points per shot attempt1.43
% of points from 3s0.0%
Points per 36 min21.2
Rebounds per 36 min14.8
Assists per 36 min0.0
Steals per 36 min0.00
Blocks per 36 min0.00
Turnovers per 36 min0.00
Stocks (STL + BLK) per game0.00
Pts + Reb + Ast per game1.7
Efficiency (EFF) per game0.9
Game Score per game (Hollinger)0.6
Minutes per game1.7
Calculated by BallersCulture from the supplied 2026-27 box-score totals using standard formulas (hover a tile to see the formula). Tracking-based metrics such as BPM, VORP, on/off and RAPTOR are not available from this data source.
05 / 3 GAMES IN 2026-27
Game log: Regular season
| Date | Opp | Result | MIN | FG | FG% | 3PT | 3P% | FT | FT% | REB | AST | BLK | STL | PF | TO | PTS |
|---|---|---|---|---|---|---|---|---|---|---|---|---|---|---|---|---|
| Nov 10 | @ DET | L 122-111 | 2 | 1-1 | 100.0 | 0-0 | 0.0 | 0-0 | 0.0 | 1 | 0 | 0 | 0 | 1 | 0 | 2 |
| Nov 5 | vs ATL | L 120-105 | 3 | 0-1 | 0.0 | 0-0 | 0.0 | 0-0 | 0.0 | 1 | 0 | 0 | 0 | 0 | 0 | 0 |
| Oct 24 | vs TOR | L 112-102 | 1 | 0-0 | 0.0 | 0-0 | 0.0 | 1-2 | 50.0 | 0 | 0 | 0 | 0 | 0 | 0 | 1 |
06 / 2026-27 HOME / AWAY, RESULTS, MONTHS AND OPPONENTS
Splits
split
| Split | GP | MIN | FG | FG% | 3PT | 3P% | FT | FT% | OR | DR | REB | AST | BLK | STL | PF | TO | PTS |
|---|---|---|---|---|---|---|---|---|---|---|---|---|---|---|---|---|---|
| All Splits | 3 | 1.7 | 0.3-0.7 | 50.0 | 0.0-0.0 | 0.0 | 0.3-0.7 | 50.0 | 0.0 | 0.7 | 0.7 | 0.0 | 0.0 | 0.0 | 0.3 | 0.0 | 1.0 |
| Home | 2 | 2.0 | 0.0-0.5 | 0.0 | 0.0-0.0 | 0.0 | 0.5-1.0 | 50.0 | 0.0 | 0.5 | 0.5 | 0.0 | 0.0 | 0.0 | 0.0 | 0.0 | 0.5 |
| Road | 1 | 2.0 | 1.0-1.0 | 100.0 | 0.0-0.0 | 0.0 | 0.0-0.0 | 0.0 | 0.0 | 1.0 | 1.0 | 0.0 | 0.0 | 0.0 | 1.0 | 0.0 | 2.0 |
| vs. Division | 1 | 3.0 | 0.0-1.0 | 0.0 | 0.0-0.0 | 0.0 | 0.0-0.0 | 0.0 | 0.0 | 1.0 | 1.0 | 0.0 | 0.0 | 0.0 | 0.0 | 0.0 | 0.0 |
| vs. Conference | 3 | 1.7 | 0.3-0.7 | 50.0 | 0.0-0.0 | 0.0 | 0.3-0.7 | 50.0 | 0.0 | 0.7 | 0.7 | 0.0 | 0.0 | 0.0 | 0.3 | 0.0 | 1.0 |
| 3+ Days Rest | 3 | 1.7 | 0.3-0.7 | 50.0 | 0.0-0.0 | 0.0 | 0.3-0.7 | 50.0 | 0.0 | 0.7 | 0.7 | 0.0 | 0.0 | 0.0 | 0.3 | 0.0 | 1.0 |
Month
| Split | GP | MIN | FG | FG% | 3PT | 3P% | FT | FT% | OR | DR | REB | AST | BLK | STL | PF | TO | PTS |
|---|---|---|---|---|---|---|---|---|---|---|---|---|---|---|---|---|---|
| October | 1 | 1.0 | 0.0-0.0 | 0.0 | 0.0-0.0 | 0.0 | 1.0-2.0 | 50.0 | 0.0 | 0.0 | 0.0 | 0.0 | 0.0 | 0.0 | 0.0 | 0.0 | 1.0 |
| November | 2 | 2.0 | 0.5-1.0 | 50.0 | 0.0-0.0 | 0.0 | 0.0-0.0 | 0.0 | 0.0 | 1.0 | 1.0 | 0.0 | 0.0 | 0.0 | 0.5 | 0.0 | 1.0 |
| Pre All-Star | 3 | 1.7 | 0.3-0.7 | 50.0 | 0.0-0.0 | 0.0 | 0.3-0.7 | 50.0 | 0.0 | 0.7 | 0.7 | 0.0 | 0.0 | 0.0 | 0.3 | 0.0 | 1.0 |
Result
| Split | GP | MIN | FG | FG% | 3PT | 3P% | FT | FT% | OR | DR | REB | AST | BLK | STL | PF | TO | PTS |
|---|---|---|---|---|---|---|---|---|---|---|---|---|---|---|---|---|---|
| Losses | 3 | 1.7 | 0.3-0.7 | 50.0 | 0.0-0.0 | 0.0 | 0.3-0.7 | 50.0 | 0.0 | 0.7 | 0.7 | 0.0 | 0.0 | 0.0 | 0.3 | 0.0 | 1.0 |
Day
| Split | GP | MIN | FG | FG% | 3PT | 3P% | FT | FT% | OR | DR | REB | AST | BLK | STL | PF | TO | PTS |
|---|---|---|---|---|---|---|---|---|---|---|---|---|---|---|---|---|---|
| Monday | 1 | 2.0 | 1.0-1.0 | 100.0 | 0.0-0.0 | 0.0 | 0.0-0.0 | 0.0 | 0.0 | 1.0 | 1.0 | 0.0 | 0.0 | 0.0 | 1.0 | 0.0 | 2.0 |
| Wednesday | 1 | 3.0 | 0.0-1.0 | 0.0 | 0.0-0.0 | 0.0 | 0.0-0.0 | 0.0 | 0.0 | 1.0 | 1.0 | 0.0 | 0.0 | 0.0 | 0.0 | 0.0 | 0.0 |
| Friday | 1 | 1.0 | 0.0-0.0 | 0.0 | 0.0-0.0 | 0.0 | 1.0-2.0 | 50.0 | 0.0 | 0.0 | 0.0 | 0.0 | 0.0 | 0.0 | 0.0 | 0.0 | 1.0 |
Opponent
| Split | GP | MIN | FG | FG% | 3PT | 3P% | FT | FT% | OR | DR | REB | AST | BLK | STL | PF | TO | PTS |
|---|---|---|---|---|---|---|---|---|---|---|---|---|---|---|---|---|---|
| Atlanta Hawks | 1 | 3.0 | 0.0-1.0 | 0.0 | 0.0-0.0 | 0.0 | 0.0-0.0 | 0.0 | 0.0 | 1.0 | 1.0 | 0.0 | 0.0 | 0.0 | 0.0 | 0.0 | 0.0 |
| Detroit Pistons | 1 | 2.0 | 1.0-1.0 | 100.0 | 0.0-0.0 | 0.0 | 0.0-0.0 | 0.0 | 0.0 | 1.0 | 1.0 | 0.0 | 0.0 | 0.0 | 1.0 | 0.0 | 2.0 |
| Toronto Raptors | 1 | 1.0 | 0.0-0.0 | 0.0 | 0.0-0.0 | 0.0 | 1.0-2.0 | 50.0 | 0.0 | 0.0 | 0.0 | 0.0 | 0.0 | 0.0 | 0.0 | 0.0 | 1.0 |
07 / SEASON-BY-SEASON HISTORY
Career statistics
Regular Season Averages
| Season | Team | GP | GS | MIN | FG | FG% | 3PT | 3P% | FT | FT% | OR | DR | REB | AST | BLK | STL | PF | TO | PTS |
|---|---|---|---|---|---|---|---|---|---|---|---|---|---|---|---|---|---|---|---|
| 2026-27 | Washington Wizards | 3 | 0 | 1.7 | 0.3-0.7 | 50.0 | 0.0-0.0 | 0.0 | 0.3-0.7 | 50.0 | 0.0 | 0.7 | 0.7 | 0.0 | 0.0 | 0.0 | 0.3 | 0.0 | 1.0 |
| Career | — | 3 | 0 | 1.7 | 0.3-0.7 | 50.0 | 0.0-0.0 | 0.0 | 0.3-0.7 | 50.0 | 0.0 | 0.7 | 0.7 | 0.0 | 0.0 | 0.0 | 0.3 | 0.0 | 1.0 |
Regular Season Totals
| Season | Team | FG | FG% | 3PT | 3P% | FT | FT% | OR | DR | REB | AST | BLK | STL | PF | TO | PTS |
|---|---|---|---|---|---|---|---|---|---|---|---|---|---|---|---|---|
| 2026-27 | Washington Wizards | 1-2 | 50.0 | 0-0 | 0.0 | 1-2 | 50.0 | 0 | 2 | 2 | 0 | 0 | 0 | 1 | 0 | 3 |
| Career | — | 1-2 | 50.0 | 0-0 | 0.0 | 1-2 | 50.0 | 0 | 2 | 2 | 0 | 0 | 0 | 1 | 0 | 3 |
Regular Season Misc Totals
| Season | Team | DD2 | TD3 | DQ | EJECT | TECH | FLAG | AST/TO | STL/TO | SC-EFF | SH-EFF |
|---|---|---|---|---|---|---|---|---|---|---|---|
| 2026-27 | Washington Wizards | 0 | 0 | 0 | 0 | 0 | 0 | 0.0 | 0.0 | 1.500 | 0.50 |
| Career | — | 0 | 0 | 0 | 0 | 0 | 0 | 0.0 | 0.0 | 1.500 | 0.50 |
08 / SHOT CHART AND ZONE SHOOTING
Shot profile
Shot-location data is not connected. Add a BALLDONTLIE GOAT-tier NBA API key in NBA Players → Settings to enable shot charts and zone shooting.
09 / RECORD, TEAM STATS AND TEAMMATES
Team
Overall4-11
Home2-5
Road2-6
DIV2-3
CONF4-8
Last Ten Games2-8
Team records for 2026-27 (regular season).
Team statistics 2026-27
Defensive
| Metric | Total | Per game | NBA rank |
|---|---|---|---|
| Blocks | 83 | 5.533 | 1st |
| Defensive Rebounds | 463 | 30.867 | 3rd |
| Steals | 116 | 7.733 | 5th |
| Points Conceded Off Turnovers | 0 | 18 | — |
| Defensive Rebound Rate | 0.0 | — | — |
| Defensive Rebounds Per Game | 30.9 | — | — |
| Blocks Per Game | 5.5 | — | — |
| Steals Per Game | 7.7 | — | — |
| Defensive Rebounds Per 48 | 0.0 | — | — |
| Blocks Per 48 | 0.0 | — | — |
| Steals Per 48 | 0.0 | — | — |
General
| Metric | Total | Per game | NBA rank |
|---|---|---|---|
| Disqualifications | 2 | — | Tied-5th |
| Flagrant Fouls | 2 | 0.133 | Tied-2nd |
| Fouls | 311 | 20.733 | 6th |
| Rebound Rate | 48.2 | — | 13th |
| Ejections | 0 | — | — |
| Technical Fouls | 12 | 0.4 | Tied-10th |
| Rebounds | 626 | 41.734 | — |
| Minutes | 0 | — | — |
| Minutes Per Game | 0.0 | — | — |
| Fantasy Rating | 0.0 | — | — |
| Rating | 200.6 | — | — |
| Plus-Minus | -1 | -1 | Tied-1st |
| Game Day of Year | 0 | — | — |
| Rebounds Per Game | 41.7 | — | — |
| Fouls Per Game | 20.7 | — | — |
| Flagrant Fouls Per Game | 0.1 | — | — |
| Technical Fouls Per Game | 0.8 | — | — |
| Ejections Per Game | 0.0 | — | — |
| Disqualifications Per Game | 0.1 | — | — |
| Assist To Turnover Ratio | 1.7 | 1.743 | — |
| Steal To Foul Ratio | 0.4 | 0.373 | — |
| Block To Foul Ratio | 0.3 | 0.267 | — |
| Team Rebounds Per Game | 0.0 | — | — |
| Rebounds | 626 | 41.734 | — |
| Total Technical Fouls | 12 | 0.4 | — |
| Assist To Turnover Ratio | 25.6 | — | — |
| Team Rebounds | 0 | — | — |
| Steal To Turnover Ratio | 0.6 | 0.563 | — |
| Rebounds Per 48 Minutes | 0.0 | — | — |
| Fouls Per 48 Minutes | 0.0 | — | — |
| Flagrant Fouls Per 48 Minutes | 0.0 | — | — |
| Technical Fouls Per 48 Minutes | 0.0 | — | — |
| Ejections Per 48 Minutes | 0.0 | — | — |
| Disqualifications Per 48 Minutes | 0.0 | — | — |
| Games Played | 15 | — | Tied-1st |
| Games Started | 0 | — | — |
| Double Double | 0 | — | — |
| Triple Double | 0 | — | — |
Offensive
| Metric | Total | Per game | NBA rank |
|---|---|---|---|
| Assists | 359 | 23.933 | 8th |
| Effective Field Goal Percentage | 51.7 | — | 13th |
| Field Goals | 598/1307 | 0.458 | — |
| Field Goals Attempted | 1307 | 87.133 | 4th |
| Field Goals Made | 598 | 39.867 | 4th |
| Field Goal Percentage | 45.8 | 0.458 | 6th |
| Free Throws | 318/398 | 0.799 | — |
| Free Throw Percentage | 79.9 | 0.799 | 2nd |
| Free Throws Attempted | 398 | 26.533 | Tied-2nd |
| Free Throws Made | 318 | 21.2 | 1st |
| Offensive Rebounds | 163 | 10.867 | 8th |
| Points | 1669 | 111.267 | 4th |
| Turnovers | 206 | 13.733 | 6th |
| 3-Point Field Goal Percentage | 31.5 | 0.315 | 13th |
| 3-Point Field Goals Attempted | 492 | 32.8 | 13th |
| 3-Point Field Goals Made | 155 | 10.333 | 14th |
| True Shooting Percentage | 56.3 | — | 9th |
| Team Turnovers | 14 | — | 3rd |
| Total Turnovers | 220 | 13.733 | — |
| Assist Ratio | 17.4 | — | 14th |
| Points in the Paint | 752 | 50 | 1st |
| Offensive Rebound Rate | 25.6 | — | 12th |
| Turnover Ratio | 12.9 | — | 8th |
| Fast Break Points | 163 | — | — |
| Possessions | 1539 | — | 2nd |
| Pace Factor | 98.1 | — | 12th |
| Average Field Goals Made | 39.9 | — | — |
| Average Field Goals Attempted | 87.1 | — | — |
| Average 3-Point Field Goals Made | 10.3 | — | — |
| Average 3-Point Field Goals Attempted | 32.8 | — | — |
| Average Free Throws Made | 21.2 | — | — |
| Average Free Throws Attempted | 26.5 | — | — |
| Points Per Game | 111.3 | — | — |
| Offensive Rebounds Per Game | 10.9 | — | — |
| Assists Per Game | 23.9 | — | — |
| Turnovers Per Game | 13.7 | — | — |
| Offensive Rebound Percentage | 0.2 | 0.23 | — |
| Estimated Possessions | 1523.2 | 100.612 | — |
| Estimated Possessions Per Game | 101.5 | — | — |
| Points Per Estimated Possession | 1.1 | 1.106 | — |
| Team Turnovers Per Game | 0.9 | — | — |
| Total Turnovers Per Game | 14.7 | — | — |
| 3-Point Field Goal Percentage | 31.5 | 0.315 | 1st |
| 2-Point Field Goals Made | 443.0 | 29.534 | Tied-10th |
| 2-Point Field Goals Attempted | 815.0 | 54.333 | Tied-9th |
| 2-Point Field Goals Made per Game | 29.5 | — | — |
| 2-Point Field Goals Attempted per Game | 54.3 | — | — |
| 2-Point Field Goal Percentage | 54.4 | 0.544 | — |
| Shooting Efficiency | 0.52 | 0.517 | — |
| Scoring Efficiency | 1.277 | 1.277 | — |
| Fieldgoals Made Per 48 | 0.0 | — | — |
| Fieldgoals Attempted Per 48 | 0.0 | — | — |
| 3-Point Fieldgoals Made Per 48 | 0.0 | — | — |
| 3-Point Fieldgoals Attempted Per 48 | 0.0 | — | — |
| Freethrows Made Per 48 | 0.0 | — | — |
| Freethrows Attempted Per 48 | 0.0 | — | — |
| Points Scored Per 48 | 0.0 | — | — |
| Offensive Rebounds Per 48 | 0.0 | — | — |
| Assists Per 48 | 0.0 | — | — |
| Turnovers | 0.0 | — | — |
Teammates
 AJ DybantsaF #4
 Alex SarrC #20
 Alondes WilliamsG #31
 Anthony DavisF #23
 Anthony GillF #16
 Bilal CoulibalyG
 Bub CarringtonG #7
 Chris LivingstonF #24
 Deandre AytonC #8
 Jamir WatkinsG #5
 Jazian GortmanG
 Justin ChampagnieF #9
 Khris MiddletonF #22
 Kyshawn GeorgeF #18
 Reece BeekmanG #26
 Sharife CooperG #13
 Skal LabissiereC #17
 Steve Settle IIIF #14
 Trae YoungG #3
 Tre JohnsonG #12
 Tre MannG #1
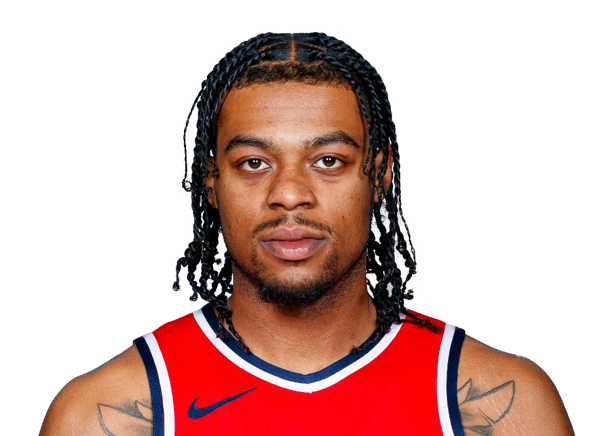 Trevor KeelsG #13
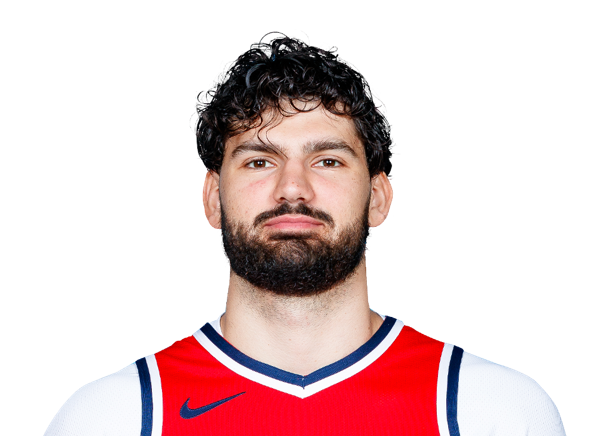 Tristan VukcevicF #00
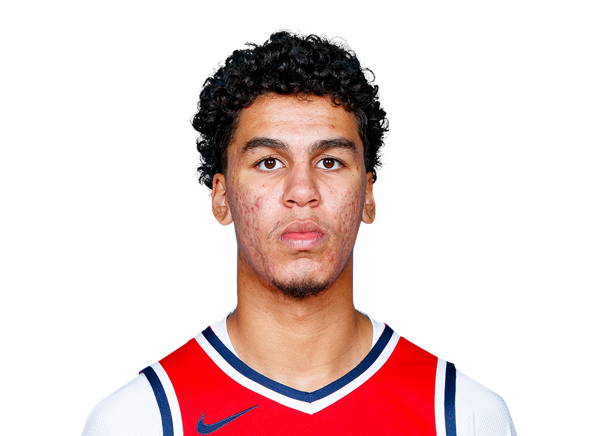 Will RileyG #27
10 / SALARY BY SEASON
Contract
No contract is on file for this player yet.
11 / LATEST REPORT
Injury status
No current injury report entry for this player.
12 / SIGNINGS, TRADES AND ROSTER MOVES
Transactions
No recorded transactions for this player.
13 / LATEST COVERAGE
Player news
LATEST UPDATEOkpara (illness) is available for Friday's game against Toronto.
Okpara will shed his questionable tag due to an illness and suit up Friday. However, the two-way player isn't guaranteed to see the floor.
31 July 2026Egusi, Nigerians, and Ewing - Washington feels like home for Wizards rookie Felix Okpara↗
19 July 2026Beekman's 14 assists guide Wizards past Hawks↗
16 July 2026Sanders scores 26, leads Clippers past Wizards↗
24 June 2026Players of Nigerian origin set for deepest NBA Draft Class ever↗
14 March 2026Felix Okpara elevates for the big-time block↗
14 March 2026Felix Okpara shows out with back-to-back alley-oop slams↗
13 March 2026Felix Okpara elevates for a massive block in transition↗
13 March 2026Auburn Tigers vs. Tennessee Volunteers: Game Highlights↗
14 / BIO, DRAFT AND CONTACT DETAILS
Biography & profile
TeamWashington Wizards
PositionForward
Jersey34
Height6' 11"
Weight237 lbs
Age22
Date of birthApr 20, 2004
BirthplaceLagos, Nigeria
CollegeTennessee
Experience0 yrs
StatusActive