Click a season to open this player’s full game log, splits and advanced stats for that year; click a team to open its page. A dash means no NBA games were recorded.
03 / EVERY CATEGORY THE PROVIDER REPORTS
Full statistical breakdown
Regular season 2026-27
Defensive
Metric
Total
NBA rank
Blocks
0
Tied-376th
Defensive Rebounds
8
Tied-346th
Steals
3
Tied-300th
Defensive Rebound Rate
0.0
—
Defensive Rebounds Per Game
1.1
—
Blocks Per Game
0.0
—
Steals Per Game
0.4
—
Defensive Rebounds Per 48
4.0
Tied-3,321st
Blocks Per 48
0.0
Tied-3,609th
Steals Per 48
1.5
Tied-2,880th
General
Metric
Total
NBA rank
Disqualifications
0
Tied-22nd
Flagrant Fouls
0
Tied-24th
Fouls
11
Tied-309th
Player Efficiency Rating
9.07
—
Rebound Rate
0.0
—
Ejections
0
Tied-7th
Technical Fouls
0
Tied-104th
Rebounds
11
—
Value Over Replacement Player
0.0
—
Minutes
96
5th
Minutes Per Game
13.7
—
Rating
7.6
Tied-276th
Plus-Minus
-44
Tied-1st
Rebounds Per Game
1.6
—
Fouls Per Game
1.6
—
Flagrant Fouls Per Game
0.0
—
Technical Fouls Per Game
0.0
—
Ejections Per Game
0.0
—
Disqualifications Per Game
0.0
—
Assist To Turnover Ratio
1.0
—
Steal To Foul Ratio
0.3
—
Block To Foul Ratio
0.0
—
Team Rebounds Per Game
0.0
—
Rebounds
11
—
Total Technical Fouls
0
—
Assist To Turnover Ratio
0.0
—
Steal To Turnover Ratio
0.4
—
Rebounds Per 48 Minutes
5.5
—
Fouls Per 48 Minutes
5.5
Tied-2,966th
Flagrant Fouls Per 48 Minutes
0.0
Tied-230th
Technical Fouls Per 48 Minutes
0.0
Tied-998th
Ejections Per 48 Minutes
0.0
Tied-67th
Disqualifications Per 48 Minutes
0.0
Tied-211th
R/40
4.6
—
Games Played
7
7th
Games Started
0
Tied-258th
Double Double
0
Tied-121st
Triple Double
0
Tied-13th
Offensive
Metric
Total
NBA rank
Assists
7
Tied-319th
Effective Field Goal Percentage
63.9
—
Field Goals
9/18
—
Field Goals Attempted
18
Tied-352nd
Field Goals Made
9
Tied-343rd
Field Goal Percentage
50.0
—
Free Throws
6/7
—
Free Throw Percentage
85.7
—
Free Throws Attempted
7
Tied-295th
Free Throws Made
6
Tied-276th
Offensive Rebounds
3
Tied-333rd
Points
29
Tied-330th
Turnovers
7
Tied-268th
3-Point Field Goal Percentage
45.5
—
3-Point Field Goals Attempted
11
Tied-300th
3-Point Field Goals Made
5
Tied-265th
True Shooting Percentage
68.8
—
Total Turnovers
7
—
Assist Ratio
20.0
—
Points in the Paint
0
Tied-1st
Offensive Rebound Rate
0.0
—
Turnover Ratio
20.0
—
Brick Index
0.00
—
Usage Rate
0.0
—
Average Field Goals Made
1.3
—
Average Field Goals Attempted
2.6
—
Average 3-Point Field Goals Made
0.7
—
Average 3-Point Field Goals Attempted
1.6
—
Average Free Throws Made
0.9
—
Average Free Throws Attempted
1.0
—
Points Per Game
4.1
—
Offensive Rebounds Per Game
0.4
—
Assists Per Game
1.0
—
Turnovers Per Game
1.0
—
Offensive Rebound Percentage
0.3
—
Estimated Possessions
24.8
—
Estimated Possessions Per Game
3.5
—
Points Per Estimated Possession
1.2
—
Team Turnovers Per Game
0.0
—
Total Turnovers Per Game
1.0
—
3-Point Field Goal Percentage
45.5
—
2-Point Field Goals Made
4.0
Tied-78th
2-Point Field Goals Attempted
7.0
Tied-52nd
2-Point Field Goals Made per Game
0.6
—
2-Point Field Goals Attempted per Game
1.0
—
2-Point Field Goal Percentage
57.1
—
Shooting Efficiency
0.64
—
Scoring Efficiency
1.611
—
Fieldgoals Made Per 48
4.5
Tied-3,292nd
Fieldgoals Attempted Per 48
9.0
Tied-3,379th
3-Point Fieldgoals Made Per 48
2.5
Tied-2,544th
3-Point Fieldgoals Attempted Per 48
5.5
Tied-2,880th
Freethrows Made Per 48
3.0
Tied-2,649th
Freethrows Attempted Per 48
3.5
Tied-2,832nd
Points Scored Per 48
14.5
Tied-3,168th
Offensive Rebounds Per 48
1.5
Tied-3,196th
Assists Per 48
3.5
Tied-3,062nd
Turnovers
3.5
Tied-2,572nd
P/40
12.1
—
A/40
2.9
—
04 / EFFICIENCY, SHOOTING PROFILE, PER-36
Advanced metrics
True shooting %67.4%
Effective FG %63.5%
2-point FG %60.0%
3-point attempt rate61.5%
Free throw rate38.5%
Points per shot attempt1.58
% of points from 3s51.2%
Assist-to-turnover1.00
Points per 36 min10.8
Rebounds per 36 min4.2
Assists per 36 min2.6
Steals per 36 min1.05
Blocks per 36 min0.00
Turnovers per 36 min2.63
Stocks (STL + BLK) per game0.40
Pts + Reb + Ast per game6.7
Efficiency (EFF) per game4.7
Game Score per game (Hollinger)2.8
Minutes per game13.7
Calculated by BallersCulture from the supplied 2026-27 box-score totals using standard formulas (hover a tile to see the formula). Tracking-based metrics such as BPM, VORP, on/off and RAPTOR are not available from this data source.
05 / 7 GAMES IN 2026-27
Game log: Regular season
Date
Opp
Result
MIN
FG
FG%
3PT
3P%
FT
FT%
REB
AST
BLK
STL
PF
TO
PTS
Nov 17
vs MEM
L 136-120
18
3-5
60.0
2-3
66.7
1-1
100.0
3
3
0
1
4
1
9
Nov 16
vs HOU
L 147-119
9
3-4
75.0
2-3
66.7
0-0
0.0
0
2
0
0
0
0
8
Oct 31
vs CHA
W 95-79
5
0-1
0.0
0-1
0.0
0-0
0.0
0
0
0
0
1
0
0
Oct 29
@ CLE
L 121-111
23
1-2
50.0
1-2
50.0
1-2
50.0
3
2
0
0
2
3
4
Oct 27
@ CHA
L 110-103
13
0-0
0.0
0-0
0.0
0-0
0.0
1
0
0
0
3
1
0
Oct 24
vs TOR
L 112-102
16
1-4
25.0
0-2
0.0
4-4
100.0
2
0
0
2
0
1
6
Oct 22
vs MIL
W 128-116
12
1-2
50.0
0-0
0.0
0-0
0.0
2
0
0
0
1
1
2
06 / 2026-27 HOME / AWAY, RESULTS, MONTHS AND OPPONENTS
Splits
split
Split
GP
MIN
FG
FG%
3PT
3P%
FT
FT%
OR
DR
REB
AST
BLK
STL
PF
TO
PTS
All Splits
7
13.7
1.3-2.6
50.0
0.7-1.6
45.5
0.9-1.0
85.7
0.4
1.1
1.6
1.0
0.0
0.4
1.6
1.0
4.1
Home
5
12.0
1.6-3.2
50.0
0.8-1.8
44.4
1.0-1.0
100.0
0.6
0.8
1.4
1.0
0.0
0.6
1.2
0.6
5.0
Road
2
18.0
0.5-1.0
50.0
0.5-1.0
50.0
0.5-1.0
50.0
0.0
2.0
2.0
1.0
0.0
0.0
2.5
2.0
2.0
vs. Division
2
9.0
0.0-0.5
0.0
0.0-0.5
0.0
0.0-0.0
0.0
0.0
0.5
0.5
0.0
0.0
0.0
2.0
0.5
0.0
vs. Conference
5
13.8
0.6-1.8
33.3
0.2-1.0
20.0
1.0-1.2
83.3
0.2
1.4
1.6
0.4
0.0
0.4
1.4
1.2
2.4
3+ Days Rest
2
10.5
2.0-3.0
66.7
1.0-1.5
66.7
0.0-0.0
0.0
0.5
0.5
1.0
1.0
0.0
0.0
0.5
0.5
5.0
Month
Split
GP
MIN
FG
FG%
3PT
3P%
FT
FT%
OR
DR
REB
AST
BLK
STL
PF
TO
PTS
October
5
13.8
0.6-1.8
33.3
0.2-1.0
20.0
1.0-1.2
83.3
0.2
1.4
1.6
0.4
0.0
0.4
1.4
1.2
2.4
November
2
13.5
3.0-4.5
66.7
2.0-3.0
66.7
0.5-0.5
100.0
1.0
0.5
1.5
2.5
0.0
0.5
2.0
0.5
8.5
Pre All-Star
7
13.7
1.3-2.6
50.0
0.7-1.6
45.5
0.9-1.0
85.7
0.4
1.1
1.6
1.0
0.0
0.4
1.6
1.0
4.1
Result
Split
GP
MIN
FG
FG%
3PT
3P%
FT
FT%
OR
DR
REB
AST
BLK
STL
PF
TO
PTS
Wins
2
8.5
0.5-1.5
33.3
0.0-0.5
0.0
0.0-0.0
0.0
0.5
0.5
1.0
0.0
0.0
0.0
1.0
0.5
1.0
Losses
5
15.8
1.6-3.0
53.3
1.0-2.0
50.0
1.2-1.4
85.7
0.4
1.4
1.8
1.4
0.0
0.6
1.8
1.2
5.4
Day
Split
GP
MIN
FG
FG%
3PT
3P%
FT
FT%
OR
DR
REB
AST
BLK
STL
PF
TO
PTS
Monday
2
15.5
1.5-2.5
60.0
1.0-1.5
66.7
0.5-0.5
100.0
1.0
1.0
2.0
1.5
0.0
0.5
3.5
1.0
4.5
Wednesday
2
17.5
1.0-2.0
50.0
0.5-1.0
50.0
0.5-1.0
50.0
0.5
2.0
2.5
1.0
0.0
0.0
1.5
2.0
3.0
Friday
2
10.0
0.5-2.5
20.0
0.0-1.5
0.0
2.0-2.0
100.0
0.0
1.0
1.0
0.0
0.0
1.0
0.5
0.5
3.0
Sunday
1
9.0
3.0-4.0
75.0
2.0-3.0
66.7
0.0-0.0
0.0
0.0
0.0
0.0
2.0
0.0
0.0
0.0
0.0
8.0
Opponent
Split
GP
MIN
FG
FG%
3PT
3P%
FT
FT%
OR
DR
REB
AST
BLK
STL
PF
TO
PTS
Charlotte Hornets
2
9.0
0.0-0.5
0.0
0.0-0.5
0.0
0.0-0.0
0.0
0.0
0.5
0.5
0.0
0.0
0.0
2.0
0.5
0.0
Cleveland Cavaliers
1
23.0
1.0-2.0
50.0
1.0-2.0
50.0
1.0-2.0
50.0
0.0
3.0
3.0
2.0
0.0
0.0
2.0
3.0
4.0
Houston Rockets
1
9.0
3.0-4.0
75.0
2.0-3.0
66.7
0.0-0.0
0.0
0.0
0.0
0.0
2.0
0.0
0.0
0.0
0.0
8.0
Memphis Grizzlies
1
18.0
3.0-5.0
60.0
2.0-3.0
66.7
1.0-1.0
100.0
2.0
1.0
3.0
3.0
0.0
1.0
4.0
1.0
9.0
Milwaukee Bucks
1
12.0
1.0-2.0
50.0
0.0-0.0
0.0
0.0-0.0
0.0
1.0
1.0
2.0
0.0
0.0
0.0
1.0
1.0
2.0
Toronto Raptors
1
16.0
1.0-4.0
25.0
0.0-2.0
0.0
4.0-4.0
100.0
0.0
2.0
2.0
0.0
0.0
2.0
0.0
1.0
6.0
07 / SEASON-BY-SEASON HISTORY
Career statistics
Regular Season Averages
Season
Team
GP
GS
MIN
FG
FG%
3PT
3P%
FT
FT%
OR
DR
REB
AST
BLK
STL
PF
TO
PTS
2012-13
Detroit Pistons
27
0
17.6
2.3-5.2
44.0
0.5-1.7
31.1
1.0-1.2
84.4
0.1
1.7
1.9
1.0
0.1
0.6
2.0
0.4
6.1
2013-14
Milwaukee Bucks
82
64
30.0
4.6-10.4
44.0
1.5-3.5
41.4
1.4-1.7
86.1
0.7
3.0
3.8
2.1
0.2
1.0
3.0
1.5
12.1
2014-15
Milwaukee Bucks
79
58
30.1
5.1-11.0
46.7
1.4-3.4
40.7
1.7-2.0
85.9
0.6
3.8
4.4
2.3
0.1
1.5
2.3
1.4
13.4
2015-16
Milwaukee Bucks
79
79
36.1
6.4-14.5
44.4
1.8-4.6
39.6
3.5-3.9
88.8
0.6
3.3
3.8
4.2
0.2
1.7
2.6
2.3
18.2
2016-17
Milwaukee Bucks
29
23
30.7
5.2-11.5
45.0
1.6-3.6
43.3
2.8-3.2
88.0
0.4
3.8
4.2
3.4
0.2
1.4
2.7
2.2
14.7
2017-18
Milwaukee Bucks
82
82
36.4
7.2-15.5
46.6
1.8-5.0
35.9
3.9-4.4
88.4
0.5
4.7
5.2
4.0
0.3
1.5
3.3
2.3
20.1
2018-19
Milwaukee Bucks
77
77
31.1
6.6-14.9
44.1
2.3-6.2
37.8
2.8-3.4
83.7
0.6
5.3
6.0
4.3
0.1
1.0
2.2
2.3
18.3
2019-20
Milwaukee Bucks
62
59
29.9
7.6-15.3
49.7
2.4-5.7
41.5
3.4-3.7
91.6
0.7
5.5
6.2
4.3
0.1
0.9
2.3
2.2
20.9
2020-21
Milwaukee Bucks
68
68
33.4
7.5-15.8
47.6
2.2-5.4
41.4
3.1-3.5
89.8
0.8
5.2
6.0
5.4
0.1
1.1
2.4
2.6
20.4
2021-22
Milwaukee Bucks
66
66
32.4
6.8-15.5
44.3
2.5-6.6
37.3
3.9-4.4
89.0
0.6
4.8
5.4
5.4
0.3
1.2
2.4
2.9
20.1
2022-23
Milwaukee Bucks
33
19
24.3
5.4-12.3
43.6
1.5-4.9
31.5
2.8-3.1
90.2
0.8
3.4
4.2
4.9
0.2
0.7
2.1
2.2
15.1
2023-24
Milwaukee Bucks
55
55
27.0
5.8-11.7
49.3
1.7-4.5
38.1
1.8-2.2
83.3
0.7
3.9
4.7
5.3
0.3
0.9
2.6
2.3
15.1
2024-25
Milwaukee Bucks
23
7
23.2
4.7-9.2
51.2
1.5-3.7
40.7
1.7-2.0
84.8
0.2
3.5
3.7
4.4
0.2
0.7
2.3
1.6
12.6
2024-25
Washington Wizards
14
14
22.1
3.7-9.0
41.3
0.9-3.4
27.7
2.4-2.7
86.8
0.6
3.1
3.7
3.4
0.2
1.3
1.6
1.4
10.7
2024-25
2024 25 Totals
37
21
22.8
4.3-9.1
47.5
1.3-3.6
36.1
1.9-2.3
85.7
0.4
3.4
3.7
4.1
0.2
0.9
2.0
1.5
11.9
2025-26
Washington Wizards
34
34
24.3
3.8-8.8
43.3
1.0-2.9
33.3
1.7-2.0
84.1
0.9
3.1
3.9
3.3
0.3
0.8
2.5
1.7
10.3
2025-26
Dallas Mavericks
29
16
21.1
3.3-8.3
40.4
1.2-3.0
39.1
2.1-2.3
91.0
0.7
2.6
3.3
2.2
0.0
0.5
2.0
1.8
10.0
2025-26
2025 26 Totals
63
50
22.8
3.6-8.6
42.0
1.1-3.0
36.0
1.9-2.2
87.5
0.8
2.9
3.7
2.8
0.1
0.7
2.3
1.7
10.2
2026-27
Washington Wizards
7
0
13.7
1.3-2.6
50.0
0.7-1.6
45.5
0.9-1.0
85.7
0.4
1.1
1.6
1.0
0.0
0.4
1.6
1.0
4.1
Career
—
846
721
30.0
5.8-12.7
45.8
1.8-4.5
38.6
2.6-3.0
87.8
0.6
4.0
4.7
3.8
0.2
1.1
2.5
2.0
16.0
Regular Season Totals
Season
Team
FG
FG%
3PT
3P%
FT
FT%
OR
DR
REB
AST
BLK
STL
PF
TO
PTS
2012-13
Detroit Pistons
62-141
44.0
14-45
31.1
27-32
84.4
4
46
50
28
4
15
53
11
165
2013-14
Milwaukee Bucks
376-854
44.0
120-290
41.4
118-137
86.1
60
250
310
169
20
83
243
123
990
2014-15
Milwaukee Bucks
406-869
46.7
109-268
40.7
134-156
85.9
48
299
347
182
11
122
183
113
1055
2015-16
Milwaukee Bucks
507-1142
44.4
143-361
39.6
277-312
88.8
44
258
302
331
19
131
204
180
1434
2016-17
Milwaukee Bucks
150-333
45.0
45-104
43.3
81-92
88.0
11
111
122
99
7
41
79
65
426
2017-18
Milwaukee Bucks
593-1272
46.6
146-407
35.9
320-362
88.4
45
384
429
328
21
119
270
191
1652
2018-19
Milwaukee Bucks
506-1148
44.1
179-474
37.8
216-258
83.7
50
411
461
331
7
80
172
174
1407
2019-20
Milwaukee Bucks
471-947
49.7
147-354
41.5
208-227
91.6
44
338
382
265
7
53
142
137
1297
2020-21
Milwaukee Bucks
511-1074
47.6
151-365
41.4
212-236
89.8
54
352
406
370
9
74
160
178
1385
2021-22
Milwaukee Bucks
452-1021
44.3
162-434
37.3
259-291
89.0
41
315
356
358
18
76
160
190
1325
2022-23
Milwaukee Bucks
177-406
43.6
51-162
31.5
92-102
90.2
28
112
140
163
5
23
68
71
497
2023-24
Milwaukee Bucks
317-643
49.3
94-247
38.1
100-120
83.3
40
217
257
292
15
51
141
127
828
2024-25
Milwaukee Bucks
108-211
51.2
35-86
40.7
39-46
84.8
5
80
85
102
5
17
52
37
290
2024-25
Washington Wizards
52-126
41.3
13-47
27.7
33-38
86.8
8
44
52
48
3
18
23
19
150
2024-25
2024 25 Totals
160-337
47.5
48-133
36.1
72-84
85.7
13
124
137
150
8
35
75
56
440
2025-26
Washington Wizards
130-300
43.3
33-99
33.3
58-69
84.1
30
104
134
111
9
26
86
57
351
2025-26
Dallas Mavericks
97-240
40.4
34-87
39.1
61-67
91.0
21
76
97
65
0
15
58
51
289
2025-26
2025 26 Totals
227-540
42.0
67-186
36.0
119-136
87.5
51
180
231
176
9
41
144
108
640
2026-27
Washington Wizards
9-18
50.0
5-11
45.5
6-7
85.7
3
8
11
7
0
3
11
7
29
Career
—
4924-10745
45.8
1481-3841
38.6
2241-2552
87.8
536
3405
3941
3249
160
947
2105
1731
13570
Regular Season Misc Totals
Season
Team
DD2
TD3
DQ
EJECT
TECH
FLAG
AST/TO
STL/TO
SC-EFF
SH-EFF
2012-13
Detroit Pistons
0
0
0
0
0
0
2.5
1.4
1.170
0.49
2013-14
Milwaukee Bucks
0
0
4
0
4
1
1.4
0.7
1.159
0.51
2014-15
Milwaukee Bucks
1
0
1
0
3
0
1.6
1.1
1.214
0.53
2015-16
Milwaukee Bucks
1
0
1
1
6
0
1.8
0.7
1.256
0.51
2016-17
Milwaukee Bucks
0
0
1
0
2
0
1.5
0.6
1.279
0.52
2017-18
Milwaukee Bucks
5
1
1
1
4
0
1.7
0.6
1.299
0.52
2018-19
Milwaukee Bucks
7
0
2
0
0
0
1.9
0.5
1.226
0.52
2019-20
Milwaukee Bucks
7
0
0
0
1
1
1.9
0.4
1.370
0.57
2020-21
Milwaukee Bucks
10
0
0
0
2
0
2.1
0.4
1.290
0.55
2021-22
Milwaukee Bucks
4
0
0
1
3
1
1.9
0.4
1.298
0.52
2022-23
Milwaukee Bucks
4
0
0
0
2
1
2.3
0.3
1.224
0.50
2023-24
Milwaukee Bucks
5
1
0
0
2
0
2.3
0.4
1.288
0.57
2024-25
Milwaukee Bucks
0
0
0
0
0
0
2.8
0.5
1.374
0.59
2024-25
Washington Wizards
0
0
0
0
1
0
2.5
0.9
1.190
0.46
2024-25
2024 25 Totals
0
0
0
0
1
1
2.7
0.6
1.306
0.55
2025-26
Washington Wizards
2
0
0
0
1
0
1.9
0.5
1.170
0.49
2025-26
Dallas Mavericks
0
0
0
0
1
0
1.3
0.3
1.204
0.48
2025-26
2025 26 Totals
2
0
0
0
2
0
1.6
0.4
1.185
0.48
2026-27
Washington Wizards
0
0
0
0
0
0
1.0
0.4
1.611
0.64
Career
—
46
2
10
3
32
4
1.9
0.5
1.263
0.53
Scoring, rebounding and assist trend
08 / SHOT CHART AND ZONE SHOOTING
Shot profile
Shot-location data is not connected. Add a BALLDONTLIE GOAT-tier NBA API key in NBA Players → Settings to enable shot charts and zone shooting.
LATEST UPDATEMiddleton had nine points (3-5 FG, 2-3 3Pt, 1-1 FT), three rebounds, three assists and one steal in 18 minutes during Monday's 136-120 loss to the Grizzlies.
Middleton appeared for the seventh time this season and just the second time in the past nine games. After playing in five of the first six games, it appears that Middleton has shifted to the fringe of the rotation, playing only in emergencies. Now in the twilight of his career, Middleton's days of being a fantasy-relevant player are well behind him.




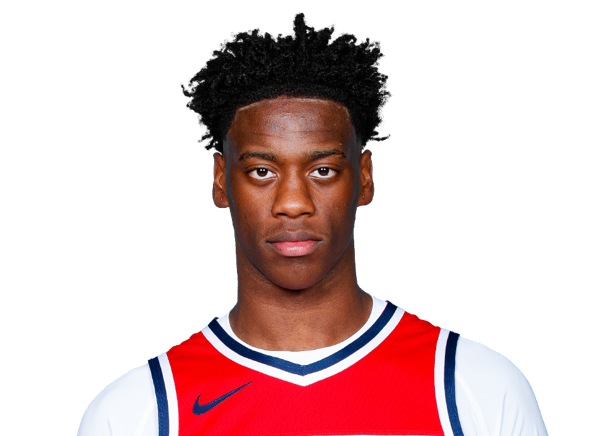 AJ DybantsaF #4
 Alex SarrC #20
 Alondes WilliamsG #31
 Anthony DavisF #23
 Anthony GillF #16
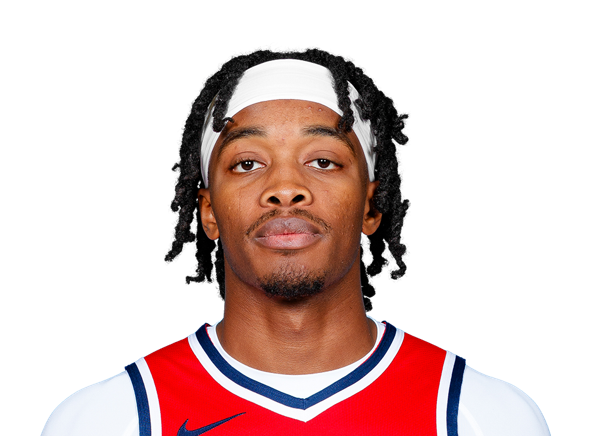 Bilal CoulibalyG
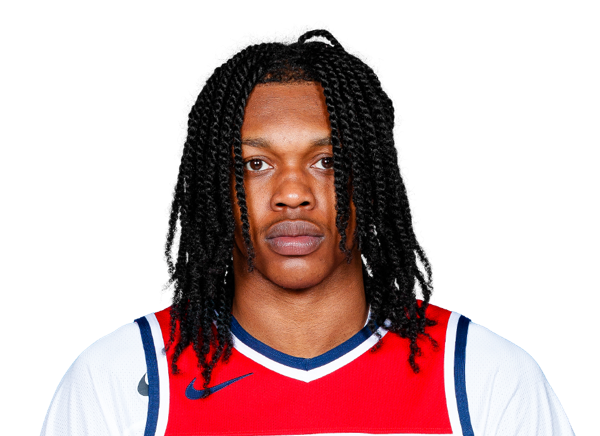 Bub CarringtonG #7
 Chris LivingstonF #24
 Deandre AytonC #8
 Felix OkparaF #34
 Jamir WatkinsG #5
 Jazian GortmanG
 Justin ChampagnieF #9
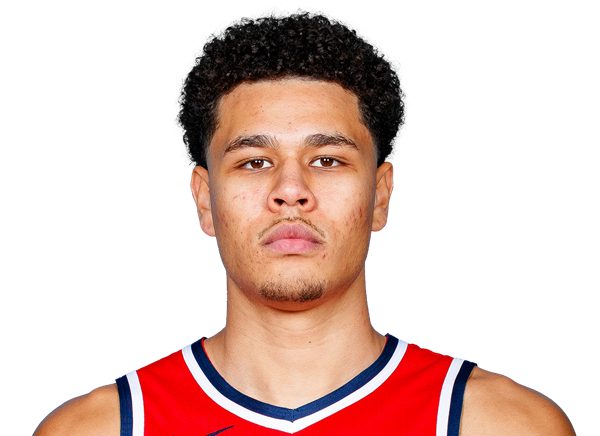 Kyshawn GeorgeF #18
 Reece BeekmanG #26
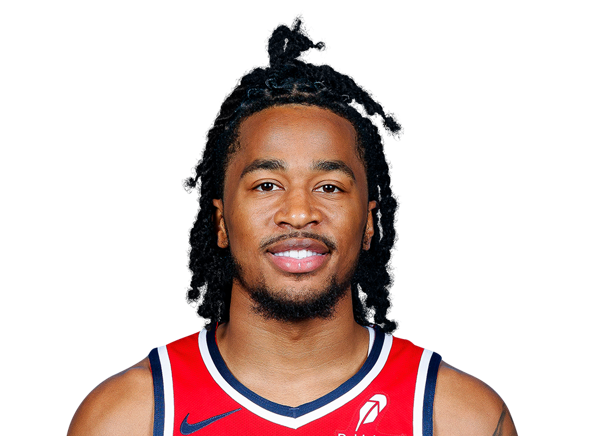 Sharife CooperG #13
 Skal LabissiereC #17
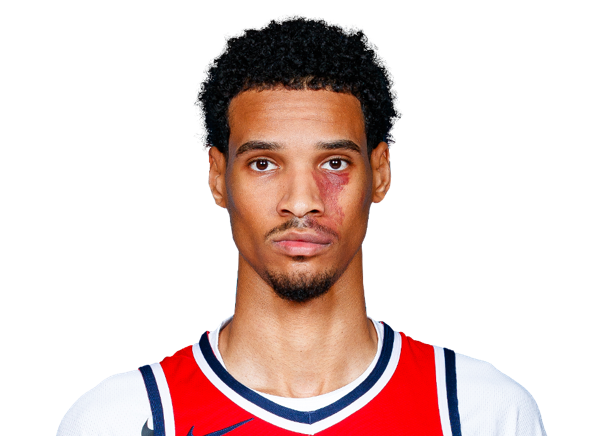 Steve Settle IIIF #14
 Trae YoungG #3
 Tre JohnsonG #12
 Tre MannG #1
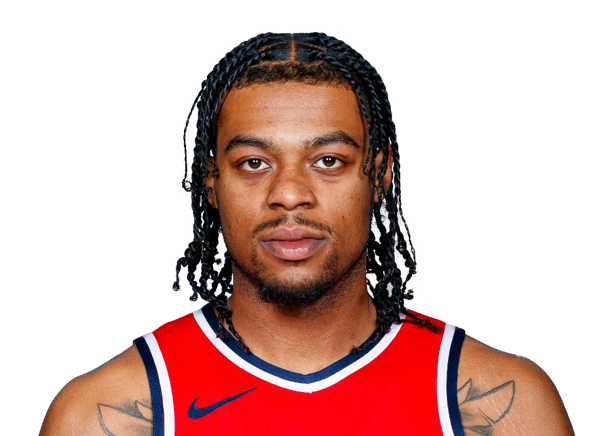 Trevor KeelsG #13
 Tristan VukcevicF #00
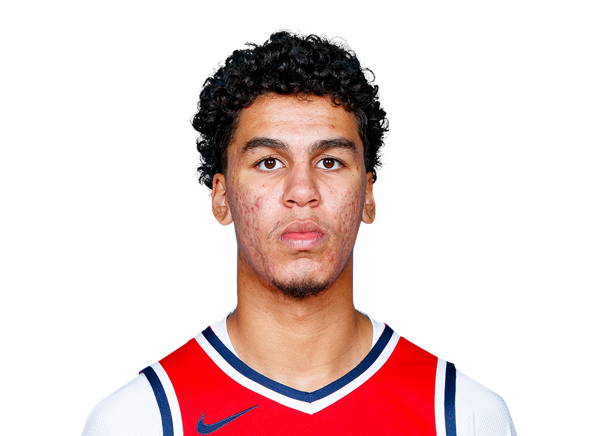 Will RileyG #27