Click a season to open this player’s full game log, splits and advanced stats for that year; click a team to open its page. A dash means no NBA games were recorded.
03 / EVERY CATEGORY THE PROVIDER REPORTS
Full statistical breakdown
Regular season 2026-27
Defensive
Metric
Total
NBA rank
Blocks
1
Tied-289th
Defensive Rebounds
1
Tied-430th
Steals
1
Tied-360th
Defensive Rebound Rate
0.0
—
Defensive Rebounds Per Game
0.1
283rd
Blocks Per Game
0.1
Tied-239th
Steals Per Game
0.1
276th
Defensive Rebounds Per 48
0.6
3,440th
Blocks Per 48
0.6
2,312th
Steals Per 48
0.6
2,880th
General
Metric
Total
NBA rank
Disqualifications
0
Tied-21st
Flagrant Fouls
0
Tied-22nd
Fouls
6
Tied-354th
Player Efficiency Rating
12.66
192nd
Rebound Rate
0.0
—
Ejections
0
Tied-7th
Technical Fouls
0
Tied-101st
Rebounds
5
—
Value Over Replacement Player
2.2
—
Minutes
80
Tied-6th
Minutes Per Game
7.3
—
Rating
4.3
Tied-168th
Plus-Minus
-42
Tied-1st
Rebounds Per Game
0.5
283rd
Fouls Per Game
0.5
282nd
Flagrant Fouls Per Game
0.0
Tied-19th
Technical Fouls Per Game
0.0
Tied-82nd
Ejections Per Game
0.0
Tied-6th
Disqualifications Per Game
0.0
Tied-20th
Assist To Turnover Ratio
1.5
—
Steal To Foul Ratio
0.2
—
Block To Foul Ratio
0.2
—
Team Rebounds Per Game
0.0
—
Rebounds
5
—
Total Technical Fouls
0
—
Assist To Turnover Ratio
0.0
—
Steal To Turnover Ratio
0.5
—
Rebounds Per 48 Minutes
3.0
—
Fouls Per 48 Minutes
3.6
2,832nd
Flagrant Fouls Per 48 Minutes
0.0
176th
Technical Fouls Per 48 Minutes
0.0
808th
Ejections Per 48 Minutes
0.0
56th
Disqualifications Per 48 Minutes
0.0
168th
R/40
2.5
—
Games Played
11
11th
Games Started
0
Tied-257th
Double Double
0
Tied-119th
Triple Double
0
Tied-12th
Offensive
Metric
Total
NBA rank
Assists
3
Tied-362nd
Effective Field Goal Percentage
59.1
—
Field Goals
11/22
—
Field Goals Attempted
22
Tied-334th
Field Goals Made
11
Tied-323rd
Field Goal Percentage
50.0
—
Free Throws
7/9
—
Free Throw Percentage
77.8
Tied-138th
Free Throws Attempted
9
Tied-268th
Free Throws Made
7
Tied-260th
Offensive Rebounds
4
Tied-296th
Points
33
Tied-319th
Turnovers
2
Tied-365th
3-Point Field Goal Percentage
33.3
Tied-153rd
3-Point Field Goals Attempted
12
Tied-292nd
3-Point Field Goals Made
4
Tied-282nd
True Shooting Percentage
63.6
—
Total Turnovers
2
—
Assist Ratio
9.7
—
Points in the Paint
0
Tied-1st
Offensive Rebound Rate
0.0
—
Turnover Ratio
6.5
—
Brick Index
0.00
—
Usage Rate
0.0
—
Average Field Goals Made
1.0
—
Average Field Goals Attempted
2.0
76th
Average 3-Point Field Goals Made
0.4
—
Average 3-Point Field Goals Attempted
1.1
245th
Average Free Throws Made
0.6
—
Average Free Throws Attempted
0.8
231st
Points Per Game
3.0
279th
Offensive Rebounds Per Game
0.4
Tied-247th
Assists Per Game
0.3
281st
Turnovers Per Game
0.2
279th
Offensive Rebound Percentage
0.4
—
Estimated Possessions
23.6
—
Estimated Possessions Per Game
2.1
—
Points Per Estimated Possession
1.4
—
Team Turnovers Per Game
0.0
—
Total Turnovers Per Game
0.2
—
3-Point Field Goal Percentage
33.3
—
2-Point Field Goals Made
7.0
Tied-41st
2-Point Field Goals Attempted
10.0
Tied-42nd
2-Point Field Goals Made per Game
0.6
—
2-Point Field Goals Attempted per Game
0.9
—
2-Point Field Goal Percentage
70.0
—
Shooting Efficiency
0.59
—
Scoring Efficiency
1.500
—
Fieldgoals Made Per 48
6.6
2,584th
Fieldgoals Attempted Per 48
13.2
2,672nd
3-Point Fieldgoals Made Per 48
2.4
2,256th
3-Point Fieldgoals Attempted Per 48
7.2
2,336th
Freethrows Made Per 48
4.2
2,080th
Freethrows Attempted Per 48
5.4
2,144th
Points Scored Per 48
19.8
2,552nd
Offensive Rebounds Per 48
2.4
2,368th
Assists Per 48
1.8
2,896th
Turnovers
1.2
2,920th
P/40
16.5
—
A/40
1.5
—
04 / EFFICIENCY, SHOOTING PROFILE, PER-36
Advanced metrics
True shooting %63.8%
Effective FG %60.0%
2-point FG %66.7%
3-point attempt rate55.0%
Free throw rate40.0%
Points per shot attempt1.50
% of points from 3s40.0%
Assist-to-turnover1.50
Points per 36 min14.8
Rebounds per 36 min2.5
Assists per 36 min1.5
Steals per 36 min0.49
Blocks per 36 min0.49
Turnovers per 36 min0.99
Stocks (STL + BLK) per game0.20
Pts + Reb + Ast per game3.8
Efficiency (EFF) per game2.6
Game Score per game (Hollinger)2.2
Minutes per game7.3
Calculated by BallersCulture from the supplied 2026-27 box-score totals using standard formulas (hover a tile to see the formula). Tracking-based metrics such as BPM, VORP, on/off and RAPTOR are not available from this data source.
05 / 11 GAMES IN 2026-27
Game log: Regular season
Date
Opp
Result
MIN
FG
FG%
3PT
3P%
FT
FT%
REB
AST
BLK
STL
PF
TO
PTS
Nov 16
vs HOU
L 147-119
16
4-6
66.7
2-3
66.7
4-5
80.0
3
0
0
1
2
0
14
Nov 13
vs DET
L 144-140 2OT
3
1-1
100.0
1-1
100.0
0-0
0.0
0
0
0
0
0
0
3
Nov 10
@ DET
L 122-111
4
0-0
0.0
0-0
0.0
0-0
0.0
0
1
0
0
0
0
0
Nov 8
@ OKC
L 114-75
20
2-5
40.0
0-3
0.0
1-2
50.0
2
1
0
0
2
0
5
Nov 7
@ ATL
L 139-132
9
3-4
75.0
1-1
100.0
0-0
0.0
0
0
0
0
0
0
7
Nov 5
vs ATL
L 120-105
13
0-3
0.0
0-2
0.0
0-0
0.0
0
0
1
0
0
0
0
Nov 3
@ ORL
W 103-94
4
0-0
0.0
0-0
0.0
0-0
0.0
0
1
0
0
1
0
0
Oct 31
vs CHA
W 95-79
1
0-1
0.0
0-1
0.0
0-0
0.0
0
0
0
0
0
0
0
Oct 27
@ CHA
L 110-103
4
1-1
100.0
0-0
0.0
0-0
0.0
0
0
0
0
0
2
2
Oct 25
@ CHI
W 124-120
5
0-1
0.0
0-1
0.0
2-2
100.0
0
0
0
0
1
0
2
Oct 24
vs TOR
L 112-102
1
0-0
0.0
0-0
0.0
0-0
0.0
0
0
0
0
0
0
0
06 / 2026-27 HOME / AWAY, RESULTS, MONTHS AND OPPONENTS
Splits
split
Split
GP
MIN
FG
FG%
3PT
3P%
FT
FT%
OR
DR
REB
AST
BLK
STL
PF
TO
PTS
All Splits
11
7.3
1.0-2.0
50.0
0.4-1.1
33.3
0.6-0.8
77.8
0.4
0.1
0.5
0.3
0.1
0.1
0.5
0.2
3.0
Home
5
6.8
1.0-2.2
45.5
0.6-1.4
42.9
0.8-1.0
80.0
0.6
0.0
0.6
0.0
0.2
0.2
0.4
0.0
3.4
Road
6
7.7
1.0-1.8
54.5
0.2-0.8
20.0
0.5-0.7
75.0
0.2
0.2
0.3
0.5
0.0
0.0
0.7
0.3
2.7
vs. Division
5
6.2
0.8-1.8
44.4
0.2-0.8
25.0
0.0-0.0
0.0
0.0
0.0
0.0
0.2
0.2
0.0
0.2
0.4
1.8
vs. Conference
9
4.9
0.6-1.2
45.5
0.2-0.7
33.3
0.2-0.2
100.0
0.0
0.0
0.0
0.2
0.1
0.0
0.2
0.2
1.6
3+ Days Rest
2
1.0
0.0-0.5
0.0
0.0-0.5
0.0
0.0-0.0
0.0
0.0
0.0
0.0
0.0
0.0
0.0
0.0
0.0
0.0
Month
Split
GP
MIN
FG
FG%
3PT
3P%
FT
FT%
OR
DR
REB
AST
BLK
STL
PF
TO
PTS
October
4
2.8
0.3-0.8
33.3
0.0-0.5
0.0
0.5-0.5
100.0
0.0
0.0
0.0
0.0
0.0
0.0
0.3
0.5
1.0
November
7
10.0
1.4-2.7
52.6
0.6-1.4
40.0
0.7-1.0
71.4
0.6
0.1
0.7
0.4
0.1
0.1
0.7
0.0
4.1
Pre All-Star
11
7.3
1.0-2.0
50.0
0.4-1.1
33.3
0.6-0.8
77.8
0.4
0.1
0.5
0.3
0.1
0.1
0.5
0.2
3.0
Result
Split
GP
MIN
FG
FG%
3PT
3P%
FT
FT%
OR
DR
REB
AST
BLK
STL
PF
TO
PTS
Wins
3
3.0
0.0-0.7
0.0
0.0-0.7
0.0
0.7-0.7
100.0
0.0
0.0
0.0
0.3
0.0
0.0
0.7
0.0
0.7
Losses
8
8.9
1.4-2.5
55.0
0.5-1.3
40.0
0.6-0.9
71.4
0.5
0.1
0.6
0.3
0.1
0.1
0.5
0.3
3.9
Day
Split
GP
MIN
FG
FG%
3PT
3P%
FT
FT%
OR
DR
REB
AST
BLK
STL
PF
TO
PTS
Monday
3
4.0
0.3-0.3
100.0
0.0-0.0
0.0
0.0-0.0
0.0
0.0
0.0
0.0
0.7
0.0
0.0
0.3
0.7
0.7
Wednesday
1
13.0
0.0-3.0
0.0
0.0-2.0
0.0
0.0-0.0
0.0
0.0
0.0
0.0
0.0
1.0
0.0
0.0
0.0
0.0
Thursday
1
3.0
1.0-1.0
100.0
1.0-1.0
100.0
0.0-0.0
0.0
0.0
0.0
0.0
0.0
0.0
0.0
0.0
0.0
3.0
Friday
3
3.7
1.0-1.7
60.0
0.3-0.7
50.0
0.0-0.0
0.0
0.0
0.0
0.0
0.0
0.0
0.0
0.0
0.0
2.3
Saturday
2
12.5
1.0-3.0
33.3
0.0-2.0
0.0
1.5-2.0
75.0
0.5
0.5
1.0
0.5
0.0
0.0
1.5
0.0
3.5
Sunday
1
16.0
4.0-6.0
66.7
2.0-3.0
66.7
4.0-5.0
80.0
3.0
0.0
3.0
0.0
0.0
1.0
2.0
0.0
14.0
Opponent
Split
GP
MIN
FG
FG%
3PT
3P%
FT
FT%
OR
DR
REB
AST
BLK
STL
PF
TO
PTS
Atlanta Hawks
2
11.0
1.5-3.5
42.9
0.5-1.5
33.3
0.0-0.0
0.0
0.0
0.0
0.0
0.0
0.5
0.0
0.0
0.0
3.5
Charlotte Hornets
2
2.5
0.5-1.0
50.0
0.0-0.5
0.0
0.0-0.0
0.0
0.0
0.0
0.0
0.0
0.0
0.0
0.0
1.0
1.0
Chicago Bulls
1
5.0
0.0-1.0
0.0
0.0-1.0
0.0
2.0-2.0
100.0
0.0
0.0
0.0
0.0
0.0
0.0
1.0
0.0
2.0
Detroit Pistons
2
4.0
0.5-0.5
100.0
0.5-0.5
100.0
0.0-0.0
0.0
0.0
0.0
0.0
0.5
0.0
0.0
0.0
0.0
1.5
Houston Rockets
1
16.0
4.0-6.0
66.7
2.0-3.0
66.7
4.0-5.0
80.0
3.0
0.0
3.0
0.0
0.0
1.0
2.0
0.0
14.0
Orlando Magic
1
4.0
0.0-0.0
0.0
0.0-0.0
0.0
0.0-0.0
0.0
0.0
0.0
0.0
1.0
0.0
0.0
1.0
0.0
0.0
Oklahoma City Thunder
1
20.0
2.0-5.0
40.0
0.0-3.0
0.0
1.0-2.0
50.0
1.0
1.0
2.0
1.0
0.0
0.0
2.0
0.0
5.0
Toronto Raptors
1
1.0
0.0-0.0
0.0
0.0-0.0
0.0
0.0-0.0
0.0
0.0
0.0
0.0
0.0
0.0
0.0
0.0
0.0
0.0
07 / SEASON-BY-SEASON HISTORY
Career statistics
Regular Season Averages
Season
Team
GP
GS
MIN
FG
FG%
3PT
3P%
FT
FT%
OR
DR
REB
AST
BLK
STL
PF
TO
PTS
2025-26
Washington Wizards
74
18
22.1
3.7-8.4
43.9
1.1-3.3
31.6
1.9-2.4
80.0
0.8
2.1
2.9
2.0
0.1
0.7
1.2
1.3
10.3
2026-27
Washington Wizards
11
0
7.3
1.0-2.0
50.0
0.4-1.1
33.3
0.6-0.8
77.8
0.4
0.1
0.5
0.3
0.1
0.1
0.5
0.2
3.0
Career
—
85
18
20.1
3.3-7.5
44.1
1.0-3.0
31.7
1.8-2.2
79.9
0.7
1.8
2.6
1.8
0.1
0.6
1.1
1.1
9.4
Regular Season Totals
Season
Team
FG
FG%
3PT
3P%
FT
FT%
OR
DR
REB
AST
BLK
STL
PF
TO
PTS
2025-26
Washington Wizards
271-618
43.9
78-247
31.6
144-180
80.0
56
156
212
146
9
54
91
94
764
2026-27
Washington Wizards
11-22
50.0
4-12
33.3
7-9
77.8
4
1
5
3
1
1
6
2
33
Career
—
282-640
44.1
82-259
31.7
151-189
79.9
60
157
217
149
10
55
97
96
797
Regular Season Misc Totals
Season
Team
DD2
TD3
DQ
EJECT
TECH
FLAG
AST/TO
STL/TO
SC-EFF
SH-EFF
2025-26
Washington Wizards
2
0
0
0
0
0
1.6
0.6
1.236
0.50
2026-27
Washington Wizards
0
0
0
0
0
0
1.5
0.5
1.500
0.59
Career
—
2
0
0
0
0
0
1.6
0.6
1.245
0.50
Scoring, rebounding and assist trend
08 / SHOT CHART AND ZONE SHOOTING
Shot profile
Shot-location data is not connected. Add a BALLDONTLIE GOAT-tier NBA API key in NBA Players → Settings to enable shot charts and zone shooting.
LATEST UPDATEWashington exercised the third-year team option on Riley on Sunday, Brett Siegel of ClutchPoints.com reports.
Riley, the 21st pick in the 2025 NBA Draft, has averaged 9.8 points, 2.7 rebounds, 1.9 assists and 0.7 blocks in 21.1 minutes over 78 regular-season appearances. After playing in 74 contests (18 starts) in 2025-26, Riley has fallen out of the rotation in 2026-27, playing just 2.8 minutes per game. Still, the Wizards like his potential for development as depth on the wing behind AJ Dybantsa, Kyshawn George and Bilal Coulibaly.


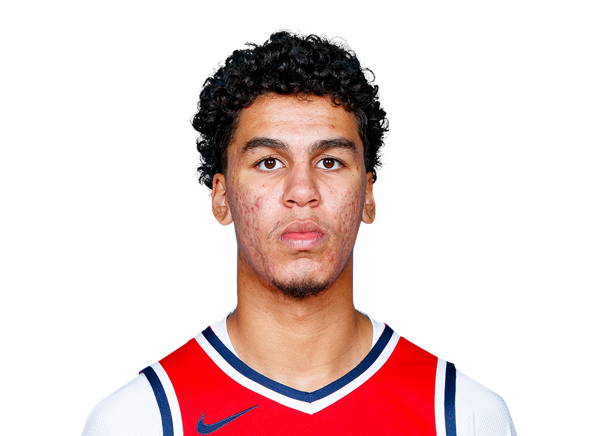

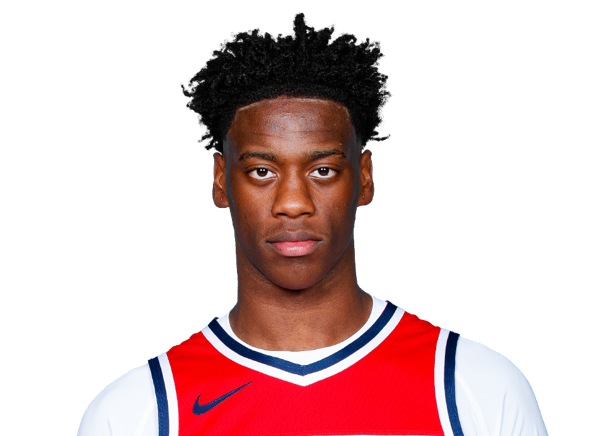 AJ DybantsaF #4
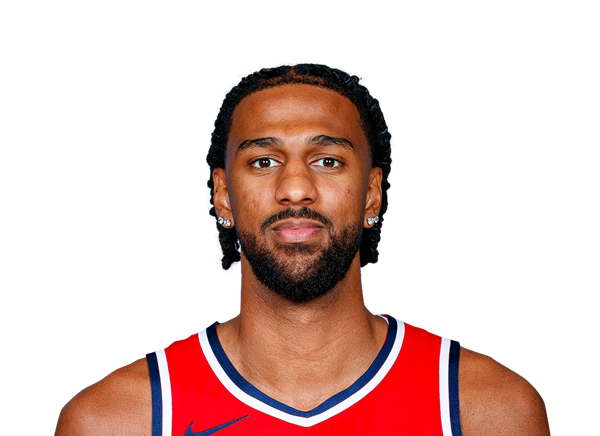 Alex SarrC #20
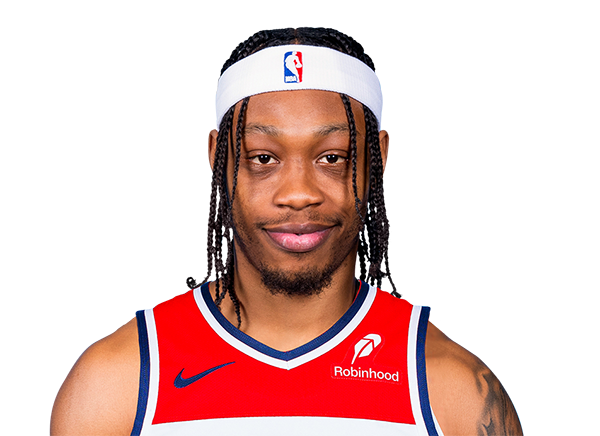 Alondes WilliamsG #31
 Anthony DavisF #23
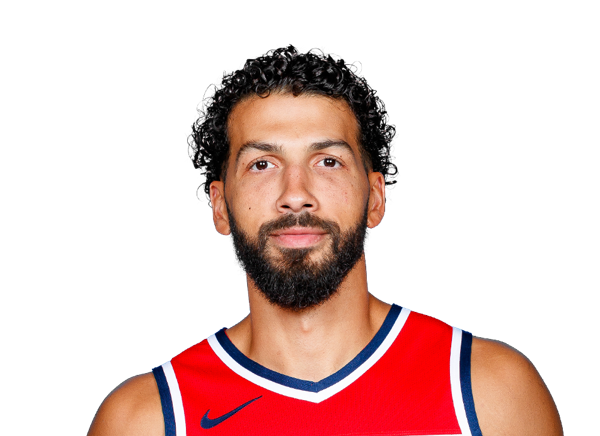 Anthony GillF #16
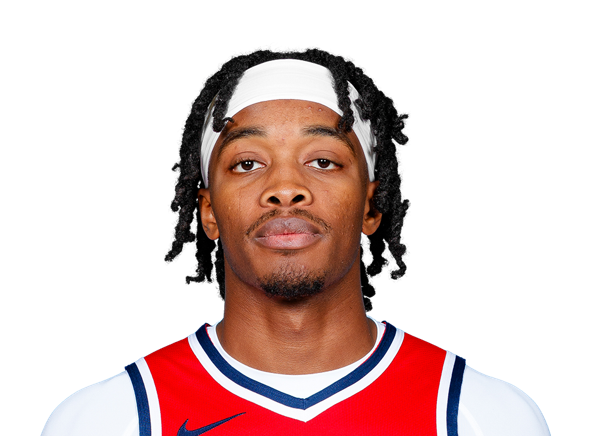 Bilal CoulibalyG
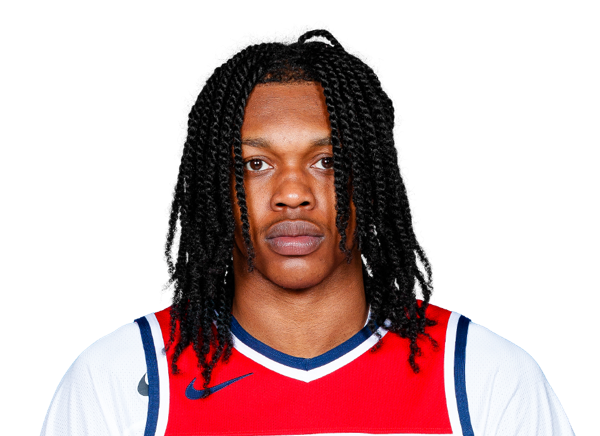 Bub CarringtonG #7
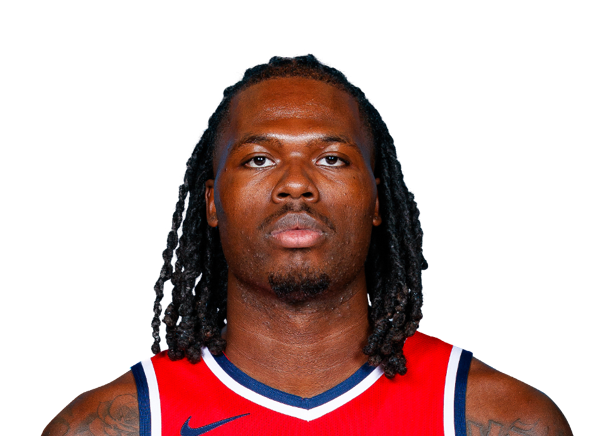 Chris LivingstonF #24
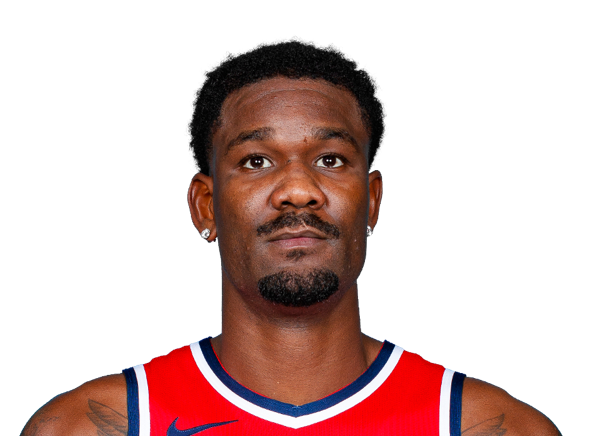 Deandre AytonC #8
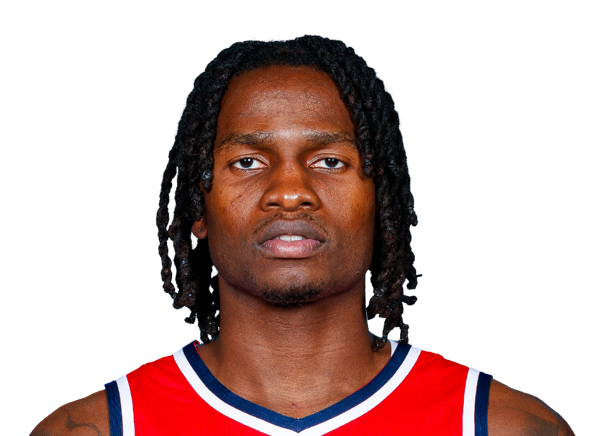 Felix OkparaF #34
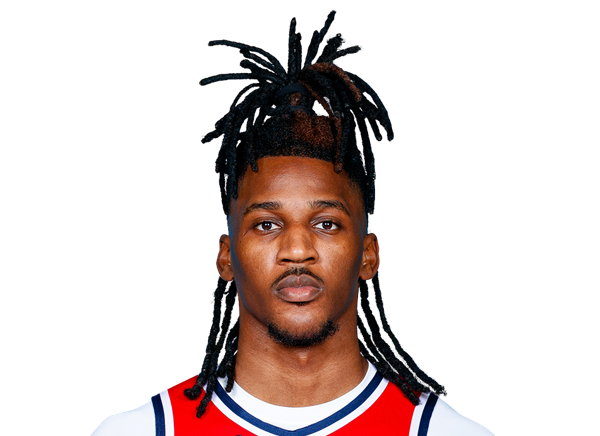 Jamir WatkinsG #5
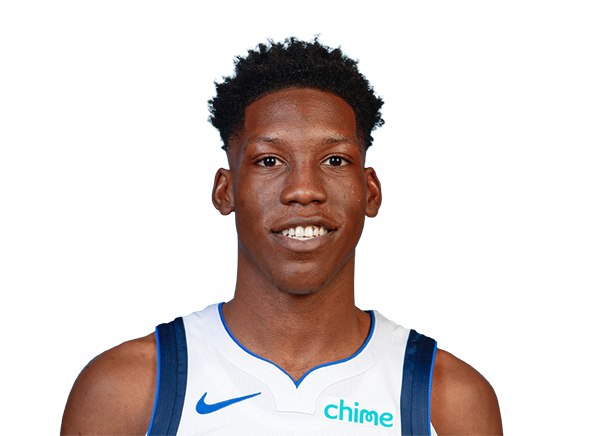 Jazian GortmanG
 Justin ChampagnieF #9
 Khris MiddletonF #22
 Kyshawn GeorgeF #18
 Reece BeekmanG #26
 Sharife CooperG #13
 Skal LabissiereC #17
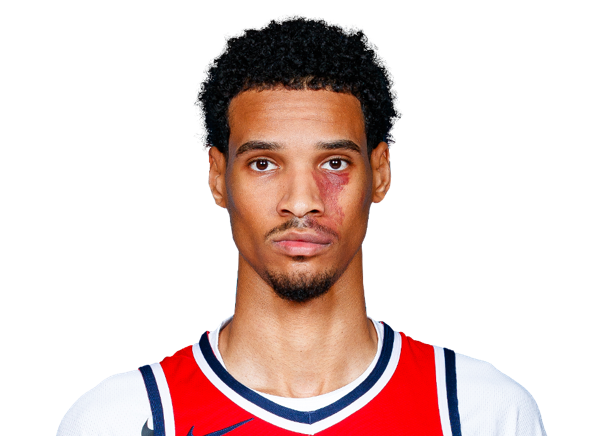 Steve Settle IIIF #14
 Trae YoungG #3
 Tre JohnsonG #12
 Tre MannG #1
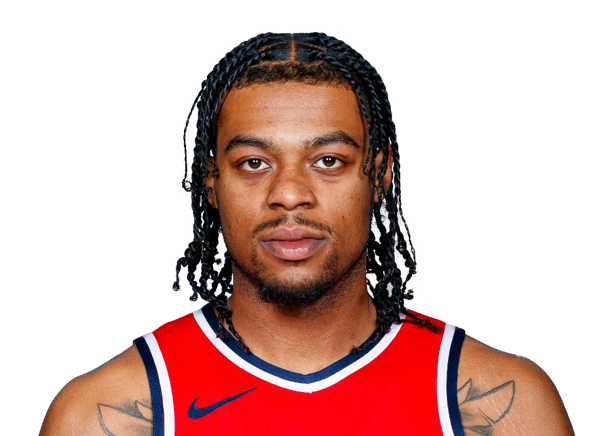 Trevor KeelsG #13
 Tristan VukcevicF #00