Click a season to open this player’s full game log, splits and advanced stats for that year; click a team to open its page. A dash means no NBA games were recorded.
03 / EVERY CATEGORY THE PROVIDER REPORTS
Full statistical breakdown
Regular season 2026-27
Defensive
Metric
Total
NBA rank
Blocks
15
Tied-16th
Defensive Rebounds
118
3rd
Steals
11
Tied-108th
Defensive Rebound Rate
0.0
—
Defensive Rebounds Per Game
9.1
4th
Blocks Per Game
1.2
Tied-18th
Steals Per Game
0.8
119th
Defensive Rebounds Per 48
13.5
144th
Blocks Per 48
1.7
Tied-768th
Steals Per 48
1.3
Tied-5,184th
General
Metric
Total
NBA rank
Disqualifications
0
Tied-21st
Flagrant Fouls
0
Tied-22nd
Fouls
32
Tied-71st
Player Efficiency Rating
29.45
4th
Rebound Rate
0.0
—
Ejections
0
Tied-7th
Technical Fouls
0
Tied-101st
Rebounds
162
—
Value Over Replacement Player
0.0
—
Minutes
421
1st
Minutes Per Game
32.4
—
Rating
52.8
Tied-21st
Plus-Minus
+1
Tied-1st
Rebounds Per Game
12.5
3rd
Fouls Per Game
2.5
Tied-89th
Flagrant Fouls Per Game
0.0
Tied-19th
Technical Fouls Per Game
0.0
Tied-82nd
Ejections Per Game
0.0
Tied-6th
Disqualifications Per Game
0.0
Tied-20th
Assist To Turnover Ratio
1.5
—
Steal To Foul Ratio
0.3
—
Block To Foul Ratio
0.5
—
Team Rebounds Per Game
0.0
—
Rebounds
162
—
Total Technical Fouls
0
—
Assist To Turnover Ratio
0.0
—
Steal To Turnover Ratio
0.3
—
Rebounds Per 48 Minutes
18.5
—
Fouls Per 48 Minutes
3.6
Tied-3,408th
Flagrant Fouls Per 48 Minutes
0.0
Tied-1,056th
Technical Fouls Per 48 Minutes
0.0
Tied-4,848th
Ejections Per 48 Minutes
0.0
Tied-336th
Disqualifications Per 48 Minutes
0.0
Tied-1,008th
R/40
15.4
—
Games Played
13
13th
Games Started
13
Tied-22nd
Double Double
10
Tied-2nd
Triple Double
2
2nd
Offensive
Metric
Total
NBA rank
Assists
67
Tied-31st
Effective Field Goal Percentage
61.1
—
Field Goals
147/247
—
Field Goals Attempted
247
7th
Field Goals Made
147
Tied-2nd
Field Goal Percentage
59.5
7th
Free Throws
74/119
—
Free Throw Percentage
62.2
249th
Free Throws Attempted
119
2nd
Free Throws Made
74
15th
Offensive Rebounds
44
Tied-5th
Points
376
4th
Turnovers
44
Tied-8th
3-Point Field Goal Percentage
25.8
231st
3-Point Field Goals Attempted
31
Tied-210th
3-Point Field Goals Made
8
Tied-229th
True Shooting Percentage
62.8
—
Total Turnovers
44
—
Assist Ratio
16.3
—
Points in the Paint
0
Tied-1st
Offensive Rebound Rate
0.0
—
Turnover Ratio
10.7
—
Brick Index
0.00
—
Usage Rate
0.0
—
Average Field Goals Made
11.3
3rd
Average Field Goals Attempted
19.0
461st
Average 3-Point Field Goals Made
0.6
—
Average 3-Point Field Goals Attempted
2.4
Tied-201st
Average Free Throws Made
5.7
19th
Average Free Throws Attempted
9.2
2nd
Points Per Game
28.9
3rd
Offensive Rebounds Per Game
3.4
7th
Assists Per Game
5.2
37th
Turnovers Per Game
3.4
10th
Offensive Rebound Percentage
0.4
—
Estimated Possessions
294.6
—
Estimated Possessions Per Game
22.7
—
Points Per Estimated Possession
1.3
—
Team Turnovers Per Game
0.0
—
Total Turnovers Per Game
3.4
—
3-Point Field Goal Percentage
25.8
—
2-Point Field Goals Made
139.0
227th
2-Point Field Goals Attempted
216.0
217th
2-Point Field Goals Made per Game
10.7
—
2-Point Field Goals Attempted per Game
16.6
—
2-Point Field Goal Percentage
64.4
7th
Shooting Efficiency
0.61
—
Scoring Efficiency
1.522
—
Fieldgoals Made Per 48
16.8
Tied-96th
Fieldgoals Attempted Per 48
28.2
336th
3-Point Fieldgoals Made Per 48
0.9
Tied-10,992nd
3-Point Fieldgoals Attempted Per 48
3.5
Tied-10,080th
Freethrows Made Per 48
8.4
720th
Freethrows Attempted Per 48
13.6
96th
Points Scored Per 48
42.9
192nd
Offensive Rebounds Per 48
5.0
Tied-240th
Assists Per 48
7.6
Tied-1,488th
Turnovers
5.0
Tied-384th
P/40
35.7
—
A/40
6.4
—
04 / EFFICIENCY, SHOOTING PROFILE, PER-36
Advanced metrics
True shooting %62.7%
Effective FG %61.1%
2-point FG %64.5%
3-point attempt rate12.6%
Free throw rate48.4%
Points per shot attempt1.52
% of points from 3s6.2%
Assist-to-turnover1.53
Points per 36 min32.1
Rebounds per 36 min13.9
Assists per 36 min5.8
Steals per 36 min0.89
Blocks per 36 min1.33
Turnovers per 36 min3.78
Stocks (STL + BLK) per game2.00
Pts + Reb + Ast per game46.6
Efficiency (EFF) per game34.0
Game Score per game (Hollinger)24.7
Minutes per game32.4
Calculated by BallersCulture from the supplied 2026-27 box-score totals using standard formulas (hover a tile to see the formula). Tracking-based metrics such as BPM, VORP, on/off and RAPTOR are not available from this data source.
05 / 13 GAMES IN 2026-27
Game log: Regular season
Date
Opp
Result
MIN
FG
FG%
3PT
3P%
FT
FT%
REB
AST
BLK
STL
PF
TO
PTS
Nov 15
vs DET
W 137-117
31
13-17
76.5
1-2
50.0
7-9
77.8
14
8
3
1
1
3
34
Nov 14
vs CLE
W 133-121
31
15-20
75.0
1-2
50.0
6-11
54.5
9
2
1
0
0
4
37
Nov 11
@ UTAH
W 115-109
31
12-21
57.1
1-2
50.0
5-9
55.6
11
4
0
0
3
1
30
Nov 9
@ SAC
W 114-108
34
14-23
60.9
0-1
0.0
1-7
14.3
14
3
2
2
2
5
29
Nov 6
@ GS
L 120-100
31
7-13
53.8
1-5
20.0
5-7
71.4
14
4
0
0
2
4
20
Nov 5
@ LAC
W 117-116 OT
41
8-20
40.0
0-2
0.0
11-13
84.6
14
6
3
2
2
3
27
Nov 3
@ LAL
L 138-117
34
10-17
58.8
0-3
0.0
10-15
66.7
12
7
2
1
3
7
30
Oct 31
vs IND
W 145-125
31
13-19
68.4
1-2
50.0
4-6
66.7
18
10
1
0
3
1
31
Oct 29
@ ATL
W 129-117
31
11-18
61.1
0-2
0.0
2-5
40.0
18
3
1
1
2
2
24
Oct 27
vs DAL
L 113-109
39
12-23
52.2
2-4
50.0
3-7
42.9
14
11
1
0
0
5
29
Oct 25
@ CHA
L 115-110
25
4-11
36.4
0-1
0.0
6-8
75.0
6
3
0
1
6
3
14
Oct 24
vs DET
L 128-111
33
15-26
57.7
1-3
33.3
5-8
62.5
12
5
1
2
3
3
36
Oct 22
vs MIN
L 131-106
30
13-19
68.4
0-2
0.0
9-14
64.3
6
1
0
1
5
3
35
06 / 2026-27 HOME / AWAY, RESULTS, MONTHS AND OPPONENTS
Splits
split
Split
GP
MIN
FG
FG%
3PT
3P%
FT
FT%
OR
DR
REB
AST
BLK
STL
PF
TO
PTS
All Splits
13
32.4
11.3-19.0
59.5
0.6-2.4
25.8
5.7-9.2
62.2
3.4
9.1
12.5
5.2
1.2
0.8
2.5
3.4
28.9
Home
6
32.5
13.5-20.7
65.3
1.0-2.5
40.0
5.7-9.2
61.8
3.7
8.5
12.2
6.2
1.2
0.7
2.0
3.2
33.7
Road
7
32.3
9.4-17.6
53.7
0.3-2.3
12.5
5.7-9.1
62.5
3.1
9.6
12.7
4.3
1.1
1.0
2.9
3.6
24.9
vs. Division
2
28.0
7.5-14.5
51.7
0.0-1.5
0.0
4.0-6.5
61.5
4.5
7.5
12.0
3.0
0.5
1.0
4.0
2.5
19.0
vs. Conference
6
30.3
11.8-18.5
64.0
0.7-2.0
33.3
5.0-7.8
63.8
4.3
8.5
12.8
5.2
1.2
0.8
2.5
2.7
29.3
3+ Days Rest
1
30.0
13.0-19.0
68.4
0.0-2.0
0.0
9.0-14.0
64.3
1.0
5.0
6.0
1.0
0.0
1.0
5.0
3.0
35.0
Month
Split
GP
MIN
FG
FG%
3PT
3P%
FT
FT%
OR
DR
REB
AST
BLK
STL
PF
TO
PTS
October
6
31.5
11.3-19.3
58.6
0.7-2.3
28.6
4.8-8.0
60.4
4.3
8.0
12.3
5.5
0.7
0.8
3.2
2.8
28.2
November
7
33.1
11.3-18.7
60.3
0.6-2.4
23.5
6.4-10.1
63.4
2.6
10.0
12.6
4.9
1.6
0.9
1.9
3.9
29.6
Pre All-Star
13
32.4
11.3-19.0
59.5
0.6-2.4
25.8
5.7-9.2
62.2
3.4
9.1
12.5
5.2
1.2
0.8
2.5
3.4
28.9
Result
Split
GP
MIN
FG
FG%
3PT
3P%
FT
FT%
OR
DR
REB
AST
BLK
STL
PF
TO
PTS
Wins
7
32.7
12.3-19.7
62.3
0.6-1.9
30.8
5.1-8.6
60.0
3.6
10.4
14.0
5.1
1.6
0.9
1.9
2.7
30.3
Losses
6
32.0
10.2-18.2
56.0
0.7-3.0
22.2
6.3-9.8
64.4
3.2
7.5
10.7
5.2
0.7
0.8
3.2
4.2
27.3
Position
Split
GP
MIN
FG
FG%
3PT
3P%
FT
FT%
OR
DR
REB
AST
BLK
STL
PF
TO
PTS
As Starter
13
32.4
11.3-19.0
59.5
0.6-2.4
25.8
5.7-9.2
62.2
3.4
9.1
12.5
5.2
1.2
0.8
2.5
3.4
28.9
Day
Split
GP
MIN
FG
FG%
3PT
3P%
FT
FT%
OR
DR
REB
AST
BLK
STL
PF
TO
PTS
Monday
2
36.5
11.0-20.0
55.0
1.0-3.5
28.6
6.5-11.0
59.1
2.5
10.5
13.0
9.0
1.5
0.5
1.5
6.0
29.5
Tuesday
1
31.0
12.0-21.0
57.1
1.0-2.0
50.0
5.0-9.0
55.6
2.0
9.0
11.0
4.0
0.0
0.0
3.0
1.0
30.0
Wednesday
3
33.7
10.7-19.0
56.1
0.0-2.0
0.0
7.3-10.7
68.8
3.3
9.3
12.7
3.3
1.3
1.3
3.0
2.7
28.7
Thursday
1
31.0
7.0-13.0
53.8
1.0-5.0
20.0
5.0-7.0
71.4
3.0
11.0
14.0
4.0
0.0
0.0
2.0
4.0
20.0
Friday
3
31.7
14.3-21.7
66.2
1.0-2.3
42.9
5.0-8.3
60.0
4.7
8.3
13.0
5.7
1.0
0.7
2.0
2.7
34.7
Saturday
2
28.0
8.5-14.0
60.7
0.5-1.5
33.3
6.5-8.5
76.5
3.5
6.5
10.0
5.5
1.5
1.0
3.5
3.0
24.0
Sunday
1
34.0
14.0-23.0
60.9
0.0-1.0
0.0
1.0-7.0
14.3
3.0
11.0
14.0
3.0
2.0
2.0
2.0
5.0
29.0
Opponent
Split
GP
MIN
FG
FG%
3PT
3P%
FT
FT%
OR
DR
REB
AST
BLK
STL
PF
TO
PTS
Atlanta Hawks
1
31.0
11.0-18.0
61.1
0.0-2.0
0.0
2.0-5.0
40.0
5.0
13.0
18.0
3.0
1.0
1.0
2.0
2.0
24.0
Charlotte Hornets
1
25.0
4.0-11.0
36.4
0.0-1.0
0.0
6.0-8.0
75.0
4.0
2.0
6.0
3.0
0.0
1.0
6.0
3.0
14.0
Cleveland Cavaliers
1
31.0
15.0-20.0
75.0
1.0-2.0
50.0
6.0-11.0
54.5
2.0
7.0
9.0
2.0
1.0
0.0
0.0
4.0
37.0
Dallas Mavericks
1
39.0
12.0-23.0
52.2
2.0-4.0
50.0
3.0-7.0
42.9
4.0
10.0
14.0
11.0
1.0
0.0
0.0
5.0
29.0
Detroit Pistons
2
32.0
14.0-21.5
65.1
1.0-2.5
40.0
6.0-8.5
70.6
4.5
8.5
13.0
6.5
2.0
1.5
2.0
3.0
35.0
Golden State Warriors
1
31.0
7.0-13.0
53.8
1.0-5.0
20.0
5.0-7.0
71.4
3.0
11.0
14.0
4.0
0.0
0.0
2.0
4.0
20.0
Indiana Pacers
1
31.0
13.0-19.0
68.4
1.0-2.0
50.0
4.0-6.0
66.7
6.0
12.0
18.0
10.0
1.0
0.0
3.0
1.0
31.0
Los Angeles Clippers
1
41.0
8.0-20.0
40.0
0.0-2.0
0.0
11.0-13.0
84.6
4.0
10.0
14.0
6.0
3.0
2.0
2.0
3.0
27.0
Los Angeles Lakers
1
34.0
10.0-17.0
58.8
0.0-3.0
0.0
10.0-15.0
66.7
1.0
11.0
12.0
7.0
2.0
1.0
3.0
7.0
30.0
Minnesota Timberwolves
1
30.0
13.0-19.0
68.4
0.0-2.0
0.0
9.0-14.0
64.3
1.0
5.0
6.0
1.0
0.0
1.0
5.0
3.0
35.0
Sacramento Kings
1
34.0
14.0-23.0
60.9
0.0-1.0
0.0
1.0-7.0
14.3
3.0
11.0
14.0
3.0
2.0
2.0
2.0
5.0
29.0
Utah Jazz
1
31.0
12.0-21.0
57.1
1.0-2.0
50.0
5.0-9.0
55.6
2.0
9.0
11.0
4.0
0.0
0.0
3.0
1.0
30.0
07 / SEASON-BY-SEASON HISTORY
Career statistics
Regular Season Averages
Season
Team
GP
GS
MIN
FG
FG%
3PT
3P%
FT
FT%
OR
DR
REB
AST
BLK
STL
PF
TO
PTS
2013-14
Milwaukee Bucks
77
23
24.6
2.2-5.4
41.4
0.5-1.5
34.7
1.8-2.6
68.3
1.0
3.4
4.4
1.9
0.8
0.8
2.2
1.6
6.8
2014-15
Milwaukee Bucks
81
71
31.4
4.7-9.6
49.1
0.1-0.5
15.9
3.2-4.3
74.1
1.2
5.5
6.7
2.6
1.0
0.9
3.1
2.1
12.7
2015-16
Milwaukee Bucks
80
79
35.3
6.4-12.7
50.6
0.4-1.4
25.7
3.7-5.1
72.4
1.4
6.2
7.7
4.3
1.4
1.2
3.2
2.6
16.9
2016-17
Milwaukee Bucks
80
80
35.6
8.2-15.7
52.1
0.6-2.3
27.2
5.9-7.7
77.0
1.8
7.0
8.8
5.4
1.9
1.6
3.1
2.9
22.9
2017-18
Milwaukee Bucks
75
75
36.7
9.9-18.7
52.9
0.6-1.9
30.7
6.5-8.5
76.0
2.1
8.0
10.0
4.8
1.4
1.5
3.1
3.0
26.9
2018-19
Milwaukee Bucks
72
72
32.8
10.0-17.3
57.8
0.7-2.8
25.6
6.9-9.5
72.9
2.2
10.3
12.5
5.9
1.5
1.3
3.2
3.7
27.7
2019-20
Milwaukee Bucks
63
63
30.4
10.9-19.7
55.3
1.4-4.7
30.4
6.3-10.0
63.3
2.2
11.4
13.6
5.6
1.0
1.0
3.1
3.7
29.5
2020-21
Milwaukee Bucks
61
61
33.0
10.3-18.0
56.9
1.1-3.6
30.3
6.5-9.5
68.5
1.6
9.4
11.0
5.9
1.2
1.2
2.8
3.4
28.1
2021-22
Milwaukee Bucks
67
67
32.9
10.3-18.6
55.3
1.1-3.6
29.3
8.3-11.4
72.2
2.0
9.6
11.6
5.8
1.4
1.1
3.2
3.3
29.9
2022-23
Milwaukee Bucks
63
63
32.1
11.2-20.3
55.3
0.7-2.7
27.5
7.9-12.3
64.5
2.2
9.6
11.8
5.7
0.8
0.8
3.1
3.9
31.1
2023-24
Milwaukee Bucks
73
73
35.2
11.5-18.8
61.1
0.5-1.7
27.4
7.0-10.7
65.7
2.7
8.8
11.5
6.5
1.1
1.2
2.9
3.4
30.4
2024-25
Milwaukee Bucks
67
67
34.2
11.8-19.7
60.1
0.2-0.9
22.2
6.5-10.6
61.7
2.2
9.7
11.9
6.5
1.2
0.9
2.3
3.1
30.4
2025-26
Milwaukee Bucks
36
36
28.9
10.4-16.6
62.4
0.4-1.3
33.3
6.4-9.9
65.0
2.7
7.1
9.8
5.4
0.7
0.9
2.4
3.2
27.6
2026-27
Miami Heat
13
13
32.4
11.3-19.0
59.5
0.6-2.4
25.8
5.7-9.2
62.2
3.4
9.1
12.5
5.2
1.2
0.8
2.5
3.4
28.9
Career
—
908
843
32.7
8.9-16.0
55.4
0.6-2.2
28.5
5.8-8.4
69.0
1.9
8.0
10.0
5.0
1.2
1.1
2.9
3.0
24.1
Regular Season Totals
Season
Team
FG
FG%
3PT
3P%
FT
FT%
OR
DR
REB
AST
BLK
STL
PF
TO
PTS
2013-14
Milwaukee Bucks
173-418
41.4
41-118
34.7
138-202
68.3
78
261
339
150
61
60
173
122
525
2014-15
Milwaukee Bucks
383-780
49.1
7-44
15.9
257-347
74.1
100
442
542
207
85
73
254
173
1030
2015-16
Milwaukee Bucks
513-1013
50.6
28-109
25.7
296-409
72.4
113
499
612
345
113
94
258
208
1350
2016-17
Milwaukee Bucks
656-1259
52.1
49-180
27.2
471-612
77.0
142
558
700
434
151
131
246
234
1832
2017-18
Milwaukee Bucks
742-1402
52.9
43-140
30.7
487-641
76.0
156
597
753
361
106
109
231
223
2014
2018-19
Milwaukee Bucks
721-1247
57.8
52-203
25.6
500-686
72.9
159
739
898
424
110
92
232
268
1994
2019-20
Milwaukee Bucks
685-1238
55.3
89-293
30.4
398-629
63.3
140
716
856
354
66
61
195
230
1857
2020-21
Milwaukee Bucks
626-1100
56.9
67-221
30.3
398-581
68.5
97
574
671
357
73
72
168
207
1717
2021-22
Milwaukee Bucks
689-1245
55.3
71-242
29.3
553-766
72.2
134
644
778
388
91
72
212
219
2002
2022-23
Milwaukee Bucks
707-1278
55.3
47-171
27.5
498-772
64.5
137
605
742
359
51
52
197
246
1959
2023-24
Milwaukee Bucks
837-1369
61.1
34-124
27.4
514-782
65.7
196
645
841
476
79
87
210
250
2222
2024-25
Milwaukee Bucks
793-1319
60.1
14-63
22.2
436-707
61.7
147
651
798
433
78
58
155
206
2036
2025-26
Milwaukee Bucks
373-598
62.4
15-45
33.3
232-357
65.0
98
254
352
196
24
34
86
115
993
2026-27
Miami Heat
147-247
59.5
8-31
25.8
74-119
62.2
44
118
162
67
15
11
32
44
376
Career
—
8045-14513
55.4
565-1984
28.5
5252-7610
69.0
1741
7303
9044
4551
1103
1006
2649
2745
21907
Regular Season Misc Totals
Season
Team
DD2
TD3
DQ
EJECT
TECH
FLAG
AST/TO
STL/TO
SC-EFF
SH-EFF
2013-14
Milwaukee Bucks
2
0
2
0
2
0
1.2
0.5
1.256
0.46
2014-15
Milwaukee Bucks
10
0
1
0
2
0
1.2
0.4
1.321
0.50
2015-16
Milwaukee Bucks
21
5
7
1
3
1
1.7
0.5
1.333
0.52
2016-17
Milwaukee Bucks
32
3
4
0
3
0
1.9
0.6
1.455
0.54
2017-18
Milwaukee Bucks
42
1
2
1
3
2
1.6
0.5
1.437
0.54
2018-19
Milwaukee Bucks
54
5
2
0
4
1
1.6
0.3
1.599
0.60
2019-20
Milwaukee Bucks
56
4
4
1
5
2
1.5
0.3
1.500
0.59
2020-21
Milwaukee Bucks
41
7
1
0
5
2
1.7
0.3
1.561
0.60
2021-22
Milwaukee Bucks
46
4
2
0
3
1
1.8
0.3
1.608
0.58
2022-23
Milwaukee Bucks
46
6
3
0
6
0
1.5
0.2
1.533
0.57
2023-24
Milwaukee Bucks
57
10
0
1
4
0
1.9
0.3
1.623
0.62
2024-25
Milwaukee Bucks
55
11
0
0
1
0
2.1
0.3
1.544
0.61
2025-26
Milwaukee Bucks
19
0
0
0
1
0
1.7
0.3
1.661
0.64
2026-27
Miami Heat
10
2
0
0
0
0
1.5
0.3
1.522
0.61
Career
—
491
58
28
4
42
9
1.7
0.4
1.509
0.57
Scoring, rebounding and assist trend
08 / SHOT CHART AND ZONE SHOOTING
Shot profile
Shot-location data is not connected. Add a BALLDONTLIE GOAT-tier NBA API key in NBA Players → Settings to enable shot charts and zone shooting.
LATEST UPDATEAntetokounmpo delivered 34 points (13-17 FG, 1-2 3Pt, 7-9 FT), 14 rebounds, eight assists, a steal and three blocks across 31 minutes in Saturday's 137-117 win over the Pistons.
Antetokounmpo followed Friday's 37-point performance against Cleveland with another dominant outing, this time coming within two assists of a triple-double. He's scored at least 30 points in his last three appearances, and his partnership with Bam Adebayo is beginning to produce the results Miami envisioned. Antetokounmpo has notched 10 double-doubles over his last 11 appearances.




 Andrew WigginsF #22
 Bam AdebayoC #13
 Bez MbengG #19
 Bobby PortisF #95
 Bobby Portis Jr.F #95
 Davion MitchellG #2
 Dennis Smith Jr.G
 Dru SmithG #12
 Ezra AusarF
 Gabe MadsenG
 Ian SchieffelinF #20
 J’Vonne HadleyF #14
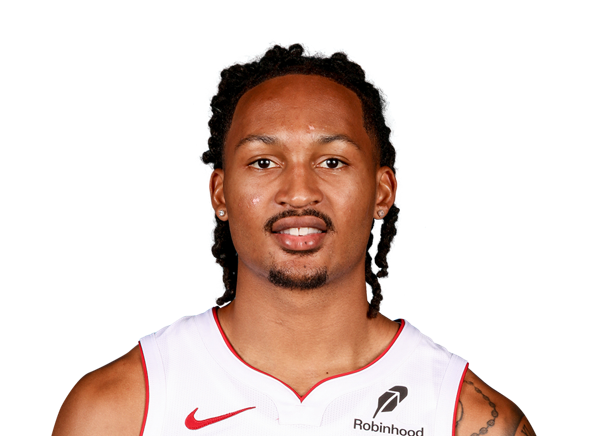 Jahmir YoungG #17
 Keshad JohnsonF #16
 Klay ThompsonG #11
 Kylor KelleyC
 Lamar WilkersonG #3
 Lester QuinonesG #25
 Myron GardnerF #15
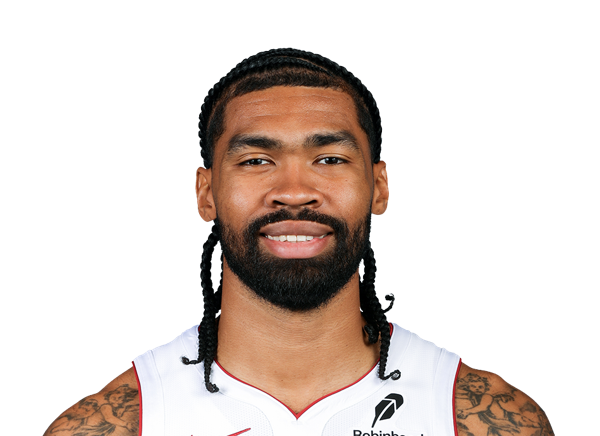 Nick RichardsC #8
 Nikola JovicF #5
 Pelle LarssonG #9
 Ryan ConwellG #4
 Simone FontecchioF
 Tim Hardaway Jr.G #10
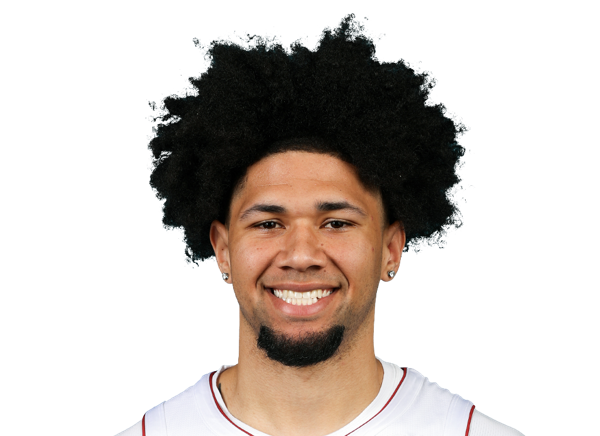 Tre DonaldsonG #24